
Trading position (short-term; our opinion): No positions are justified from the risk/reward perspective.
On Friday, crude oil gained 5.84% as the International Energy Agency cut its forecast for supply increases later this year. Thanks to this news, light crude increased more than $2 from an intraday low, finishing the day slightly below $49 per barrel. Is it time for higher values of the commodity or rather another pause before new lows?
At the end of the previous week, crude oil rebounded sharply and erased over 60% of Thursday’s decline as the IEA in its monthly oil report reduced its forecast for the increase in non-OPEC oil supply this year by 350,000 barrels a day, saying that the production cut is expected to fuel demand for OPEC's own output. Is it enough to trigger further improvement and higher values of the commodity? (charts courtesy of http://stockcharts.com).
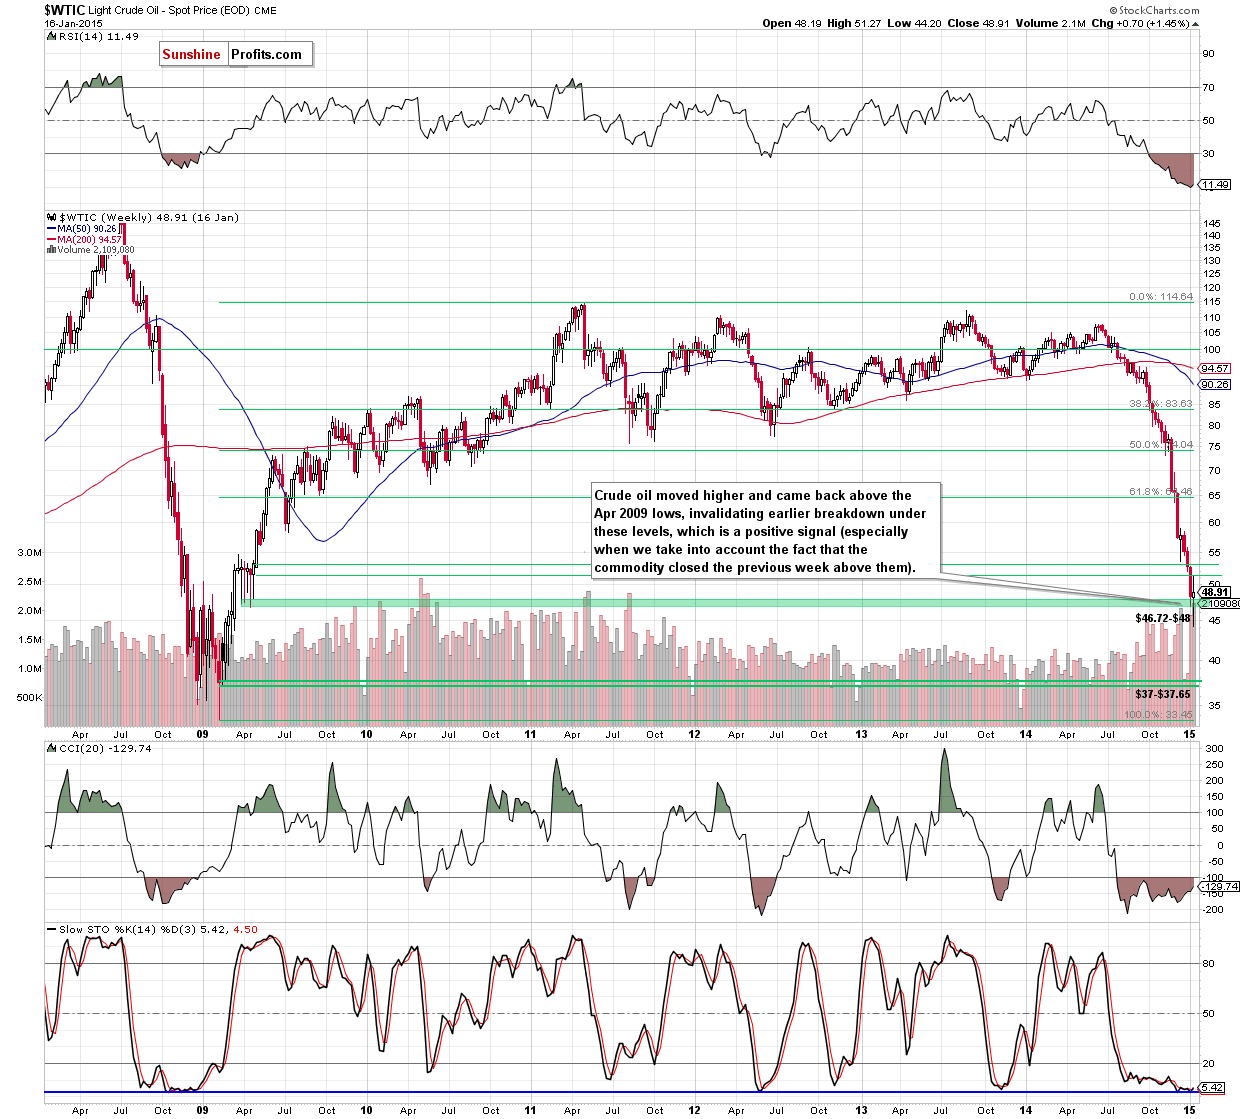
The first thing that catches the eye on the weekly chart is an invalidation of the brakdwon under the support zone created by the Apr 2009 lows, which is a positive signal - especialy when we take into account the fact that the commodity closed the previous week above these levels. This suggests futher improvement and another attempt to climb above the previously-broken 76.4% and 78.6% Fibonacci retracement levels in the coming week.
Are there any short-term factors that could hinder the realization of the above-mentioned scenario? Let’s check.
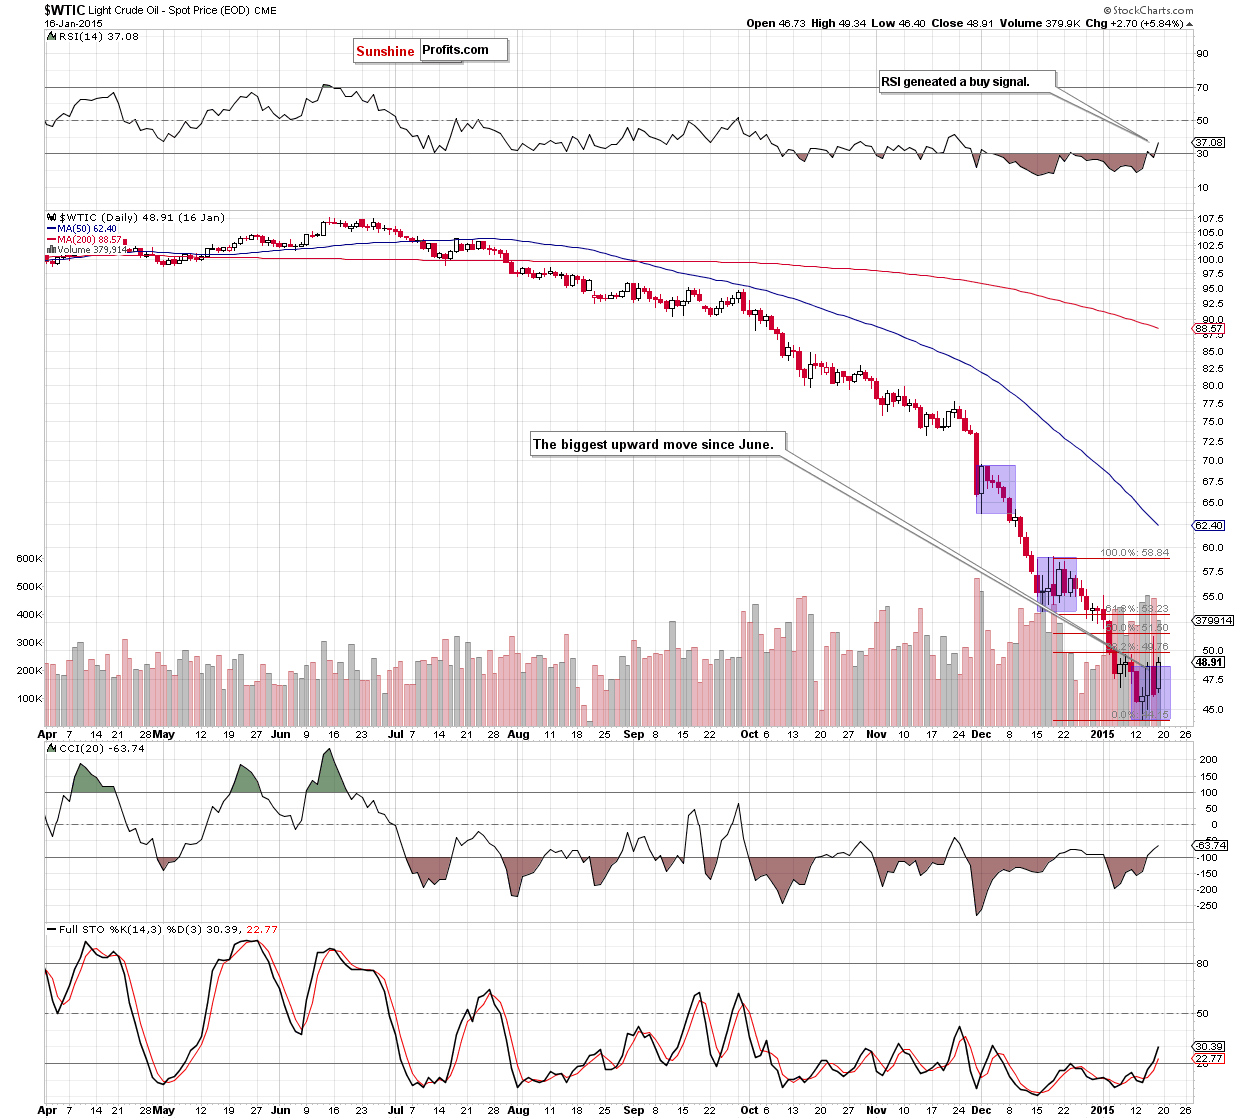
Looking at the daily chart, we see that crude oil moved sharply higher and erased over 60% of Thursday’s decline. Although this is a bullish signal that suggests further rally, Friday’s increase materialized on relative low volume (compared to what we saw in the first half of the week), which means that oil bulls might be not as strength as it seems at the first glance. Additionally, the commodity is still trading under the 50% Fibonacci retracement based on the mid-Dec-Jan decline, which keeps gains in check. On top of that, the last week’s rally is the biggest upward move since June. In all previous cases, bigger corrections (marked with blue) were just another stops before new lows.
Will it be different this time? From technical point of view, we see that crude oil invalidated the breakdown below the Apr 2009 lows and all daily indicators generated buy signals, which suggests that a trend reversal might be just around the corner. Nevertheless, in our opinion, as long as crude oil is trading under Thursday’s high and the 50% Fibonacci retracement another pullback and a test of the Apr 2009 lows in the coming day(s) should not surprise us.
Summing up, crude oil rebounded sharply, invalidating the breakdown below the Apr 2009 lows and closing the previous week above them. Although this is a bullish signal, the commodity is still trading under the 50% Fibonacci retracement based on the mid-Dec-Jan decline. Therefore, we think that a trend reversal (and an upward move to the Dec highs around $60) will be likely only if we see a breakout above this key resistance, which won’t be followed by a fresh low. Until this time, another pullback and a test of the Apr 2009 lows in the coming day(s) should not surprise us.
Very short-term outlook: mixed
Short-term outlook: mixed
MT outlook: mixed
LT outlook: bullish
Trading position (short-term; our opinion): No positions are justified from the risk/reward perspective at the moment, but we will keep you informed should anything change.
Thank you.
Nadia Simmons
Forex & Oil Trading Strategist
Przemyslaw Radomski, CFA
Founder, Editor-in-chief
Gold & Silver Trading Alerts
Forex Trading Alerts
Oil Investment Updates
Oil Trading Alerts

