
On Monday, crude oil lost 5.19% as Goldman Sachs and Société Générale cut their price forecast for 2015. In this environment, light crude declined below the important support zone, hitting a fresh 2015 low. Is it time for a test of $40?
Yesterday, crude oil dropped below $46 per barrel as Goldman Sachs cut its price forecast for WTI to average $47.15 a barrel in 2015, down from $73.75 in its last forecast. The bank also sees WTI slipping to $40.50 per barrel in the second quarter, before recovering slightly in the second half of the year. Additionally, Société Générale lowered its 2015 oil price forecast for WTI by $14 to $51.00 a barrel, down from $65 per barrel. Because of these circumstances, the commodity dropped below its important support zone. Will we see crude oil at $40 this month? (charts courtesy of http://stockcharts.com).
Quoiting our Oil Trading Alert posted on Jan 8:
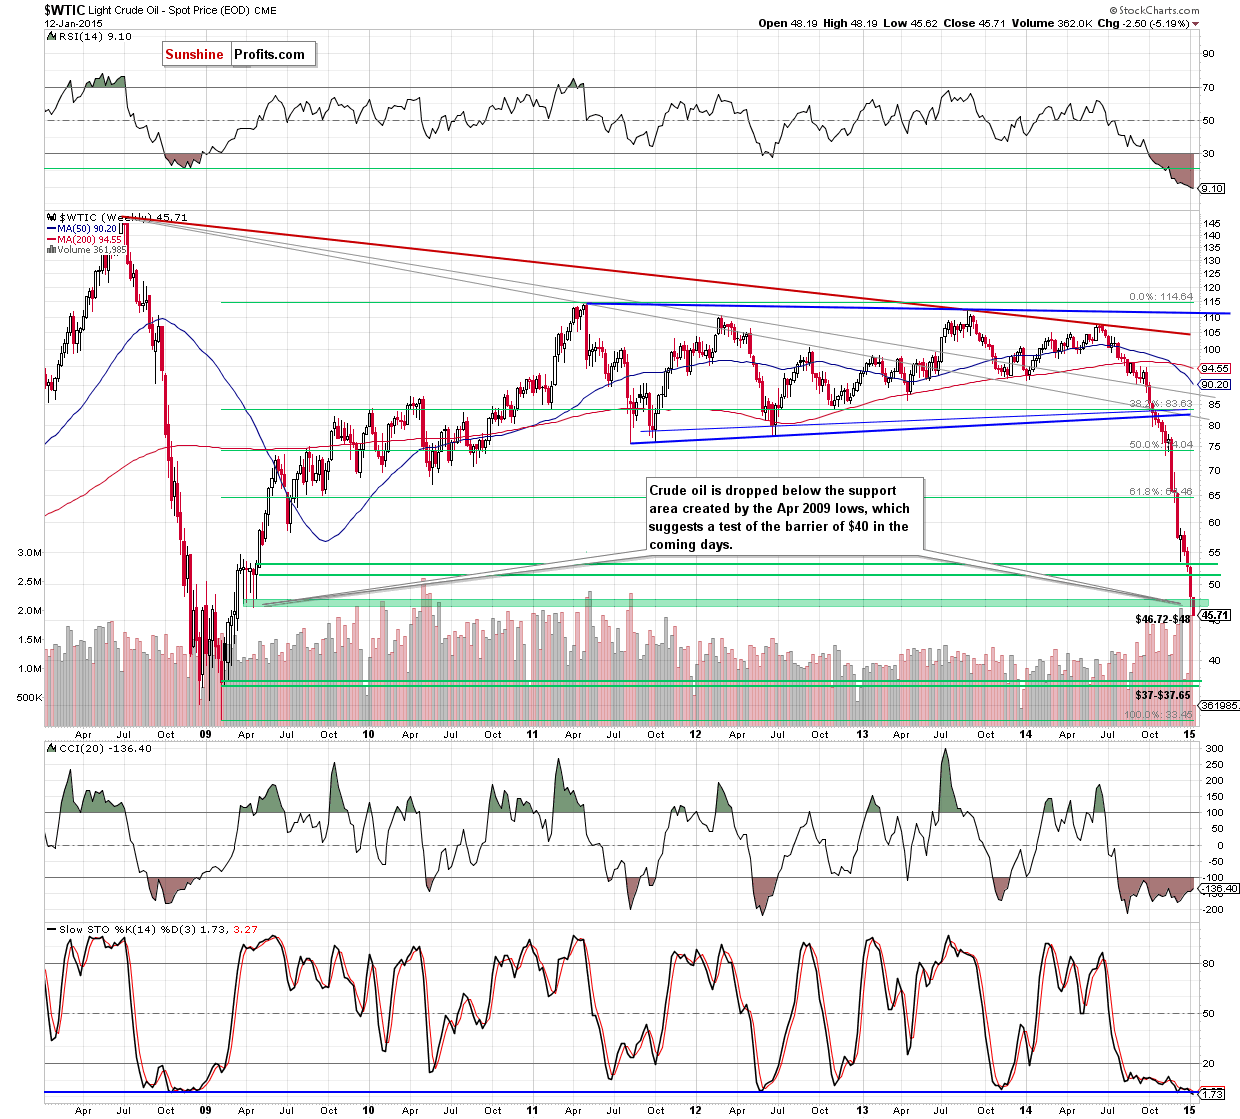
(…) although yesterday’s upswing materialized on huge volume (…), the commodity is still trading well below the 38.2% Fibonacci retracement (based on the Dec-Jan decline) and the Dec lows. (…) we saw similar situation in mid-Dec. Back then, a rebound confirmed by huge volume resulted in a doji candlestick, which triggered only a short-lived corrective upswing that took crude oil to the first important Fibonacci resistance. Despite this increase, oil bulls were unable to push the commodity higher (similarly to what we noticed at the beginning of Dec), which translated to a fresh multi-year low. Taking all the above into account, we think that as long as there is no bigger upswing (bigger than $5.85, which won’t be followed by a fresh multi-year low) and a successful breakout above the 38.2% Fibonacci retracement (based on the Dec-Jan decline), a sizable upward move is not likely to be seen and another test of the lower border of the support zone (at $46.72) can’t be ruled out.
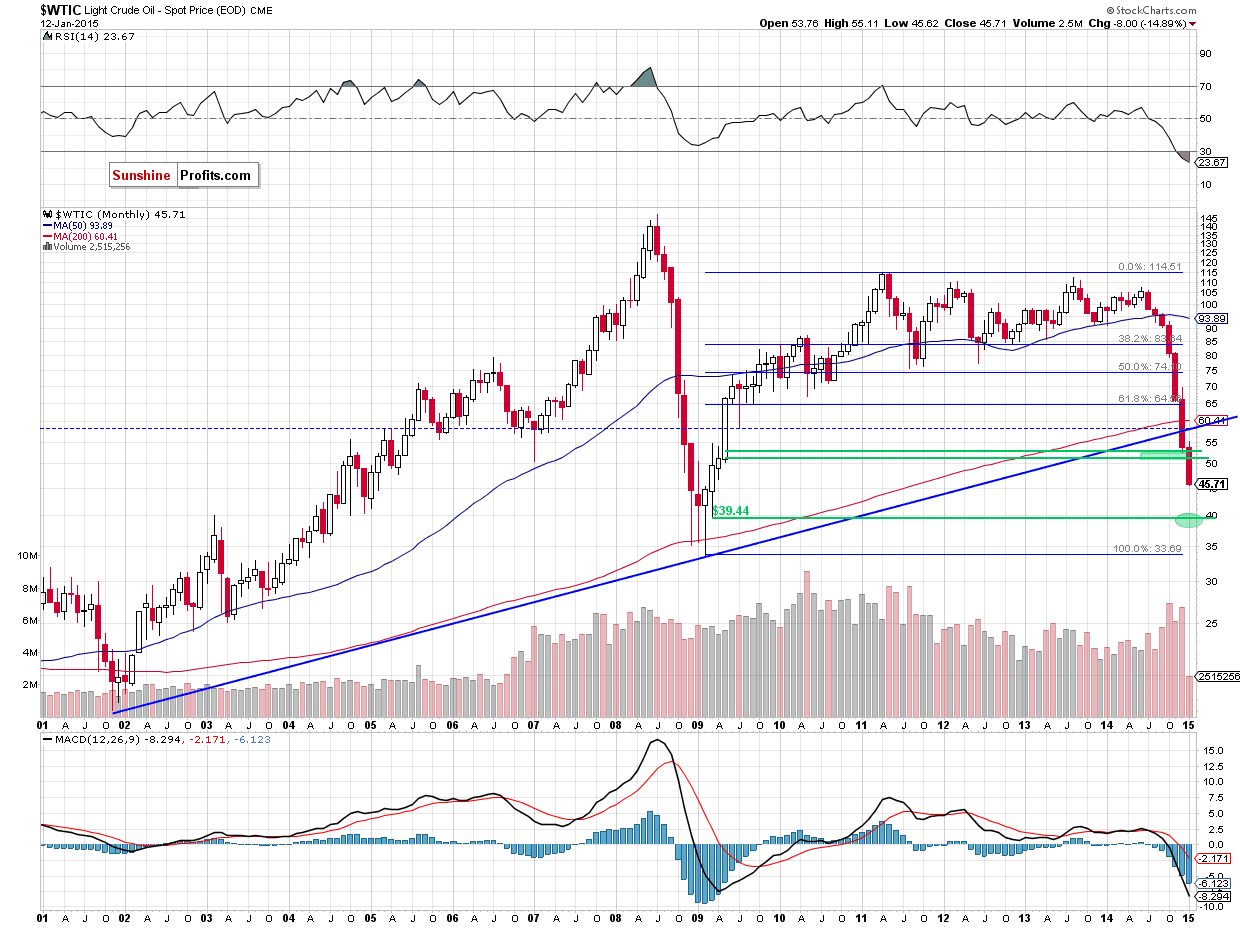
Looking at the charts, we see that currency bears not only tested of the lower border of the support zone (as we expected), but also managed to broke below it. This is a strong negative signal, which suggests further deterioration and a drop to the next psychological barrier of $40 in the coming week(s) (this area is supported by the Mar 2009 low of $39.44).
Summing up, the most important event of yesterday’s session was a breakdown below the support zone created by the Apr 2009 lows. This is a strong bearish signal, which suggests further deterioration. Therefore, we think that opening short positions is justified from the risk/reward perspective at the moment.
Very short-term outlook: bearish
Short-term outlook: mixed with bearish bias
MT outlook: mixed
LT outlook: bullish
Trading position (short-term; our opinion): Short positions with a stop-loss order at $48.34 and an initial price target at $38 are justified from the risk/reward perspective at the moment. We will keep you informed should anything change.
Thank you.
Nadia Simmons
Forex & Oil Trading Strategist
Przemyslaw Radomski, CFA
Founder, Editor-in-chief
Gold & Silver Trading Alerts
Forex Trading Alerts
Oil Investment Updates
Oil Trading Alerts

