
Trading position (short-term; our opinion): No positions are justified from the risk/reward perspective.
On Thursday, crude oil gained 0.35% as Wednesday’s upbeat data and slightly bullish report on U.S. crude inventories continued to weigh. As a result, light crude climbed to an intraday high of $49.65, but did this move change anything?
In recent days, investors’ sentiment recovered amid growing expectations that the European Central Bank could implement quantitative easing on its next meeting on January 22. The commodity received also an additional support as Wednesday’s ADP report showed that the U.S. private sector added a bigger-than-expected jobs in December, boosting the outlook for the U.S. recovery. In these circumstances, light crude extended gains and approached the barrier of $50, but will we see a comeback above this level in the coming week? (charts courtesy of http://stockcharts.com).
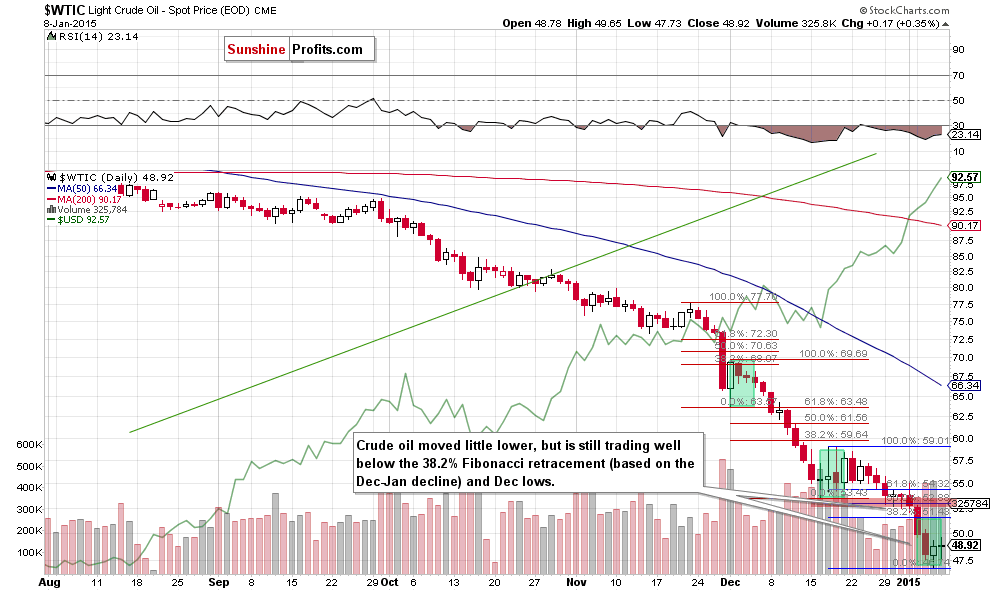
Looking at the daily chart, we see that although crude moved little higher, this move didn’t change the situation in the very short-term perspective (not to mention the short- or medium-term outlook) as the commodity is still trading below the 38.2% Fibonacci retracement and the Dec lows. Therefore, what we wrote in our previous Oil Trading Alert is up-to-date:
(…) we saw similar situation in mid-Dec. Back then, a rebound confirmed by huge volume resulted in a doji candlestick, which triggered only a short-lived corrective upswing that took crude oil to the first important Fibonacci resistance. Despite this increase, oil bulls were unable to push the commodity higher (similarly to what we noticed at the beginning of Dec), which translated to a fresh multi-year low. Taking all the above into account, we think that as long as there is no bigger upswing (bigger than $5.85, which won’t be followed by a fresh multi-year low) and a successful breakout above the 38.2% Fibonacci retracement (based on the Dec-Jan decline), a sizable upward move is not likely to be seen and another test of the lower border of the support zone (at $46.72) can’t be ruled out.
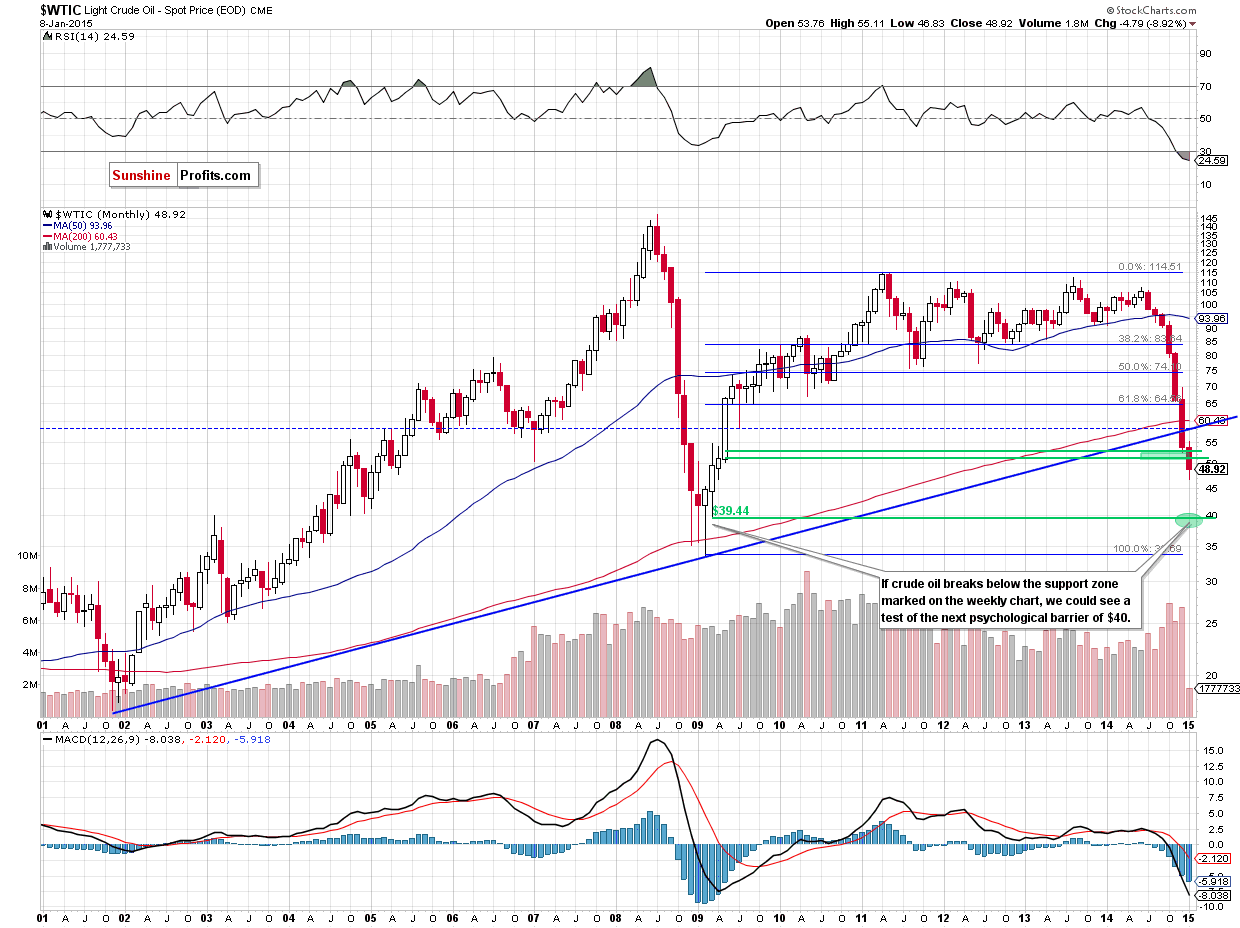
(…) what could happen if light crude drops below this support. (…) if crude oil extends losses, we could see a test of the strength of the next psychologically important barier of $40 in the coming month (this area is supported by the Mar 2009 low of $39.44).
Summing up, although crude oil moved little higher, the commodity is still trading below the 38.2% Fibonacci retracement (based on the Dec-Jan decline) and the Dec lows. Taking this fact into account, and combining it with price action that we saw in the previous month (two unsuccessful attempts to break above this first important Fibonacci resistance), we believe that as long as there is no bigger upswing (bigger than $5.85, which won’t be followed by a fresh multi-year low) and a successful breakout above the 38.2% Fibonacci retracement, a sizable upward move is not likely to be seen and another test of the lower border of the support zone (at $46.72) can’t be ruled out.
Very short-term outlook: mixed
Short-term outlook: mixed
MT outlook: mixed
LT outlook: bullish
Trading position (short-term; our opinion): No positions are justified from the risk/reward perspective at the moment. However, if we see an invalidation of the breakdown below the level of $50, we’ll consider opening long positions. We will keep you informed should anything change.
Thank you.
Nadia Simmons
Forex & Oil Trading Strategist
Przemyslaw Radomski, CFA
Founder, Editor-in-chief
Gold & Silver Trading Alerts
Forex Trading Alerts
Oil Investment Updates
Oil Trading Alerts

