-
Bearish Signals Remain for Brent and WTI Crude Oil
September 15, 2022, 10:34 AMAfter the bearish progress, oil prices slipped slightly as worries about the global growth outlook overtook fears about the supply shortage.
Macroeconomics
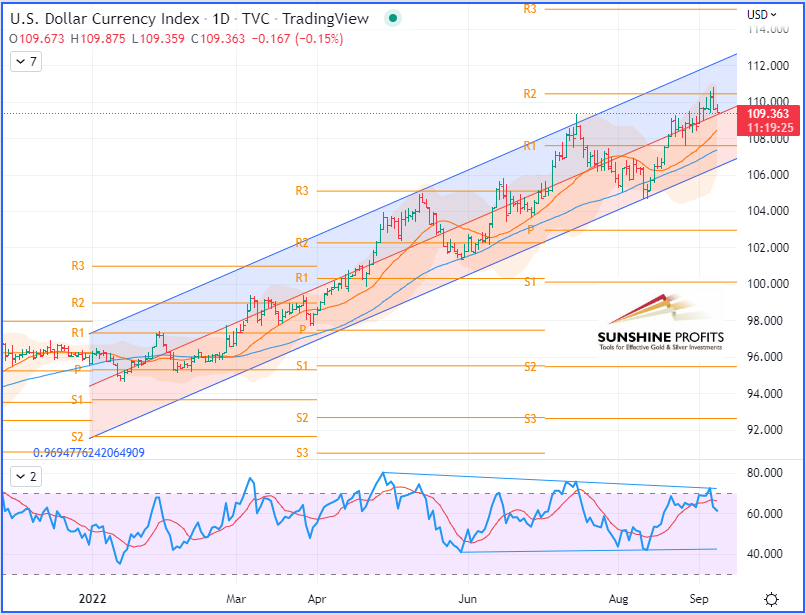
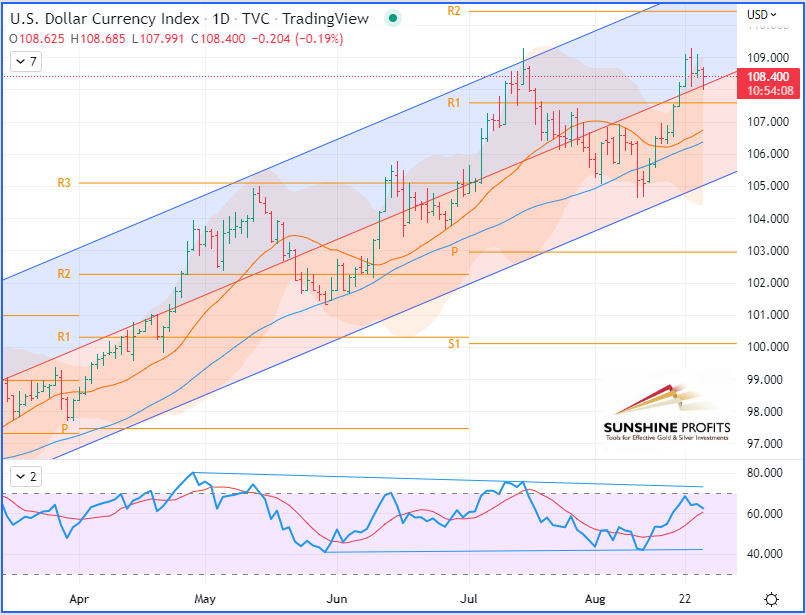
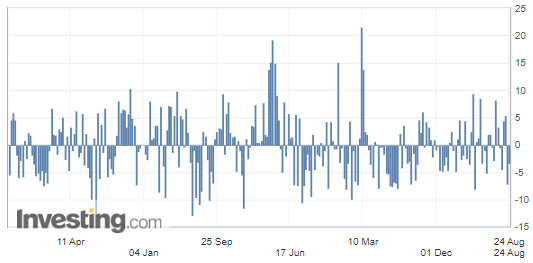
On the macroeconomic view, the greenback found support on its 50-Day Moving Average (DMA) at the beginning of the week before resuming its rally upward and approaching its monthly highs of $110-110.50. Will the quarterly R3 pivot ($115) be reached anytime soon, or will the $110.50 level be left as its two-decade high?
Regarding U.S. economic data, the inflation figures came out on Tuesday, and the Consumer Price Index (CPI) showed a slight deceleration from 8.5% in July to 8.3% in August, while the reading still appeared to have decelerated at a lower pace than expectations (as consensus forecast a drop to 8.1%). However, the Core CPI – another measuring tool for inflation that does not take into account energy prices nor volatile food – showed an increase of 0.6% in August (double the 0.3% forecast) by reaching 6.3% year-on-year, versus 6.1% forecast and 5.9% in the previous month. Therefore, these above figures may provide cover for the US Federal Reserve to deliver another hefty interest rate increase next week.
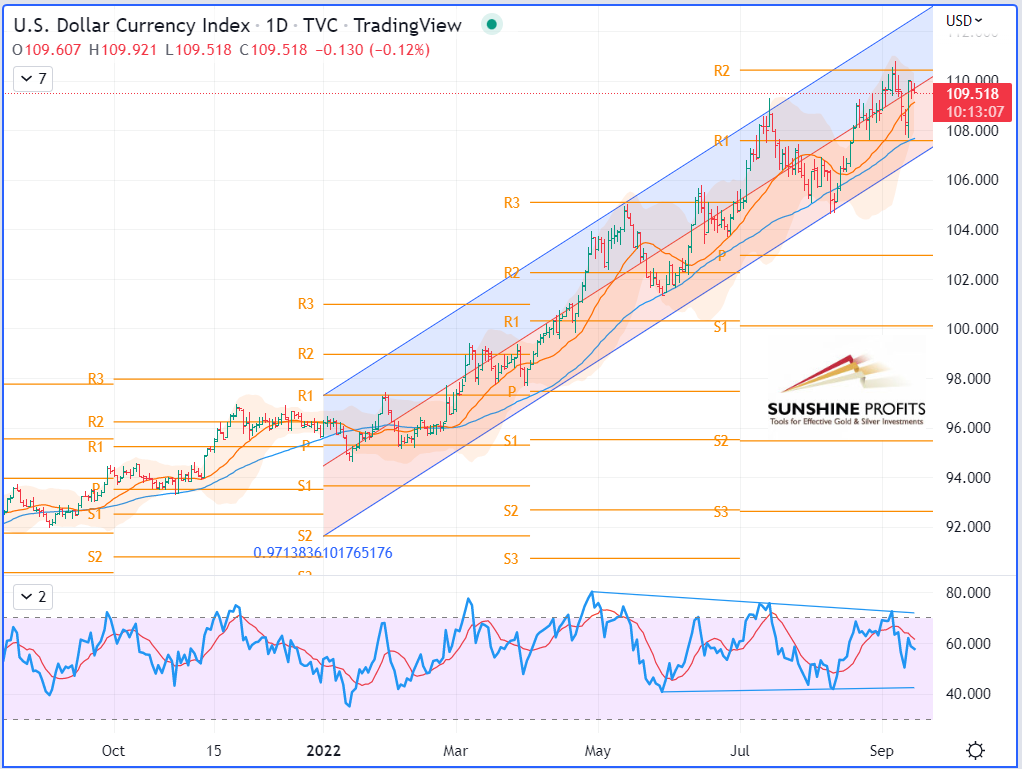
U.S. Dollar Currency Index (DXY), daily chart
Fundamental Analysis
Repeated lockdowns in China are weighing on the growth of global oil demand, said on Wednesday the International Energy Agency (IEA), after revising its forecasts for 2022 very slightly downwards, but anticipating a rebound for 2023. Overall, although slowed down, the growth of oil remains sustained, particularly because, for example, in the Middle East or the United States, it benefits from recourse to the detriment of natural gas, which has become very expensive.
Regarding Russia, its oil exports reached 7.6 Mb/d (390,000 barrels per day less than before the war in Ukraine) in August, for export revenues estimated at 17.7 billion dollars (1.2 billion less).
Meanwhile, Russian oil giant Rosneft announced Thursday a net profit up 13.1% in the first half of 2022 compared to the same period the previous year, despite adverse external factors in the midst of the Russian offensive in Ukraine. Its Chief Executive, Igor Ivanovich Sechin, pointed out that the significant increase in the cost of logistics, rail transport tariffs of 18.6% since the beginning of the year, as well as the rise in electricity costs and the unprecedented hike in the Russian central bank's key rate (currently at 8%), negatively impacted on the results.
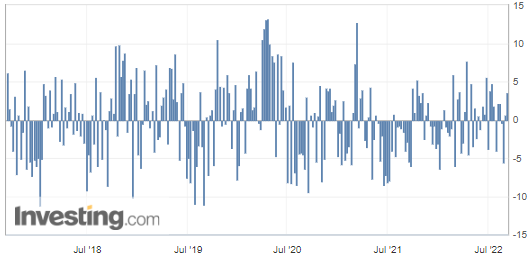
U.S. Crude Oil Inventories
On Wednesday, the Energy Information Administration (EIA) released the weekly change in the count of barrels of commercial crude oil held by US firms. During the week ended September 11, oil stocks were building an excess of 2.442M barrels, while analysts were anticipating a number three times lower.

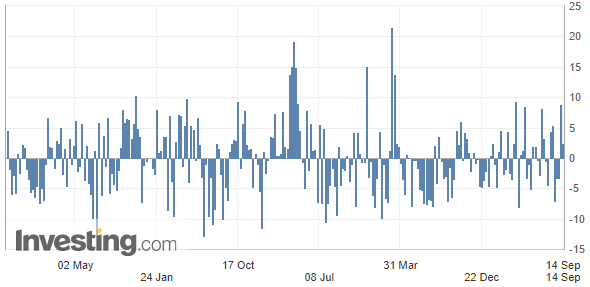
(Source: Investing.com)
Diplomacy & Geopolitics
Chinese President Xi Jinping is making his first trip abroad on September 15 and 16 since the start of the COVID-19 crisis. In the current geopolitical context, his planned meeting with the head of the Kremlin should take on a strategic dimension at the summit of the Shanghai Cooperation Organization (SCO). This economic and military structure was founded in 2001 to ensure the security and stability of a large territory, including Russia, Central Asia, and China. It is the first time in three years that the summit has been held in person, and this year it will bring together the leaders of 15 countries, five fewer than the G20 and twice as many as the G7. In addition to China, India, Kazakhstan, Kyrgyzstan, Pakistan, Uzbekistan, Russia, and Tajikistan, which are the current member states, Iran, Belarus, and Mongolia will participate as observing countries. Finally, Turkey, Azerbaijan, Armenia, and Turkmenistan will attend the event as states interested in the SCO, as the Russian daily Moskovsky Komsomolets points out.
Technical Analysis
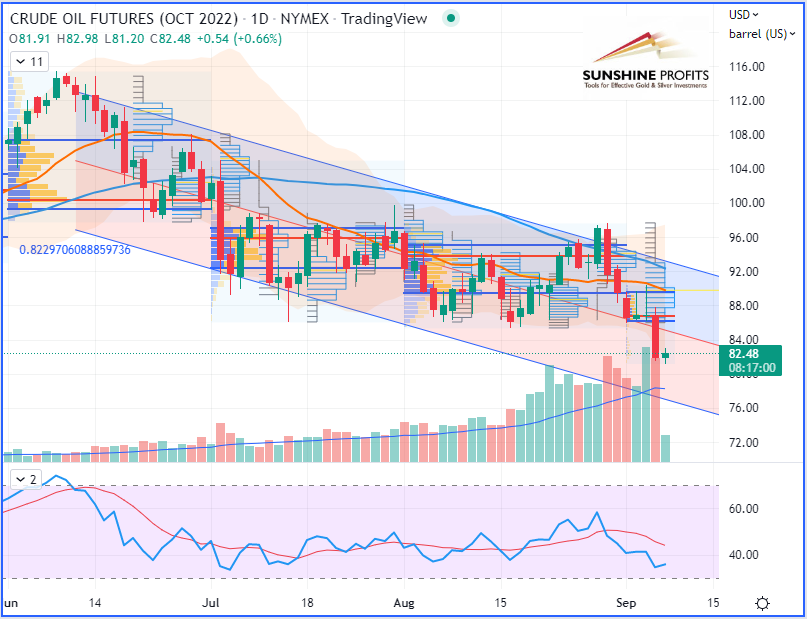
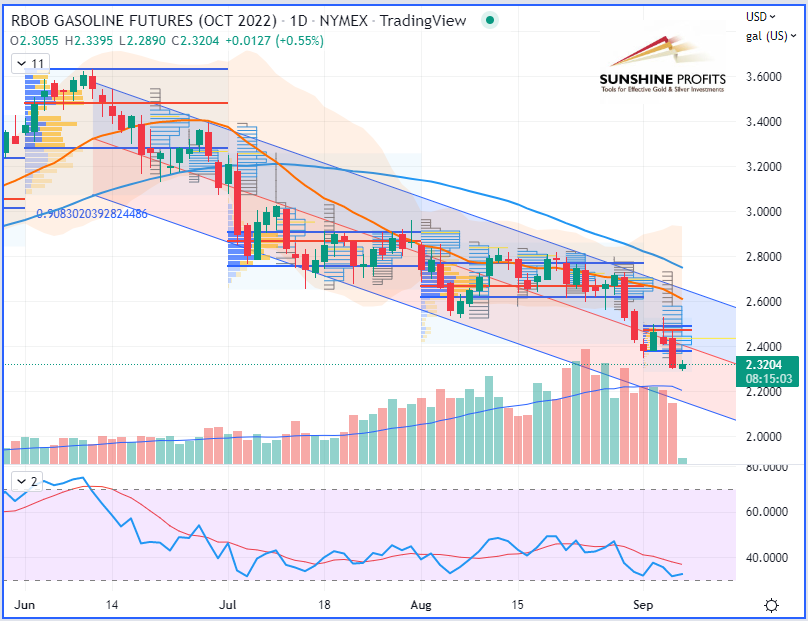
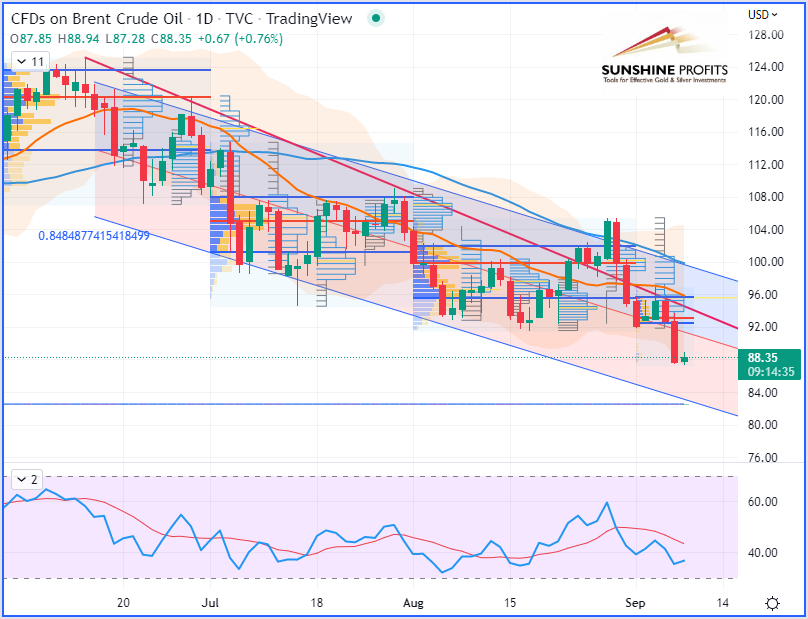
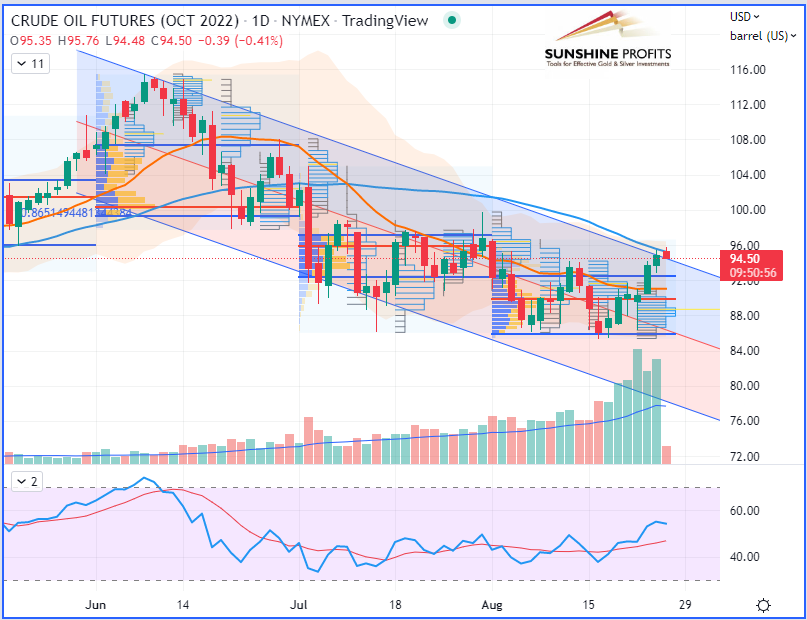
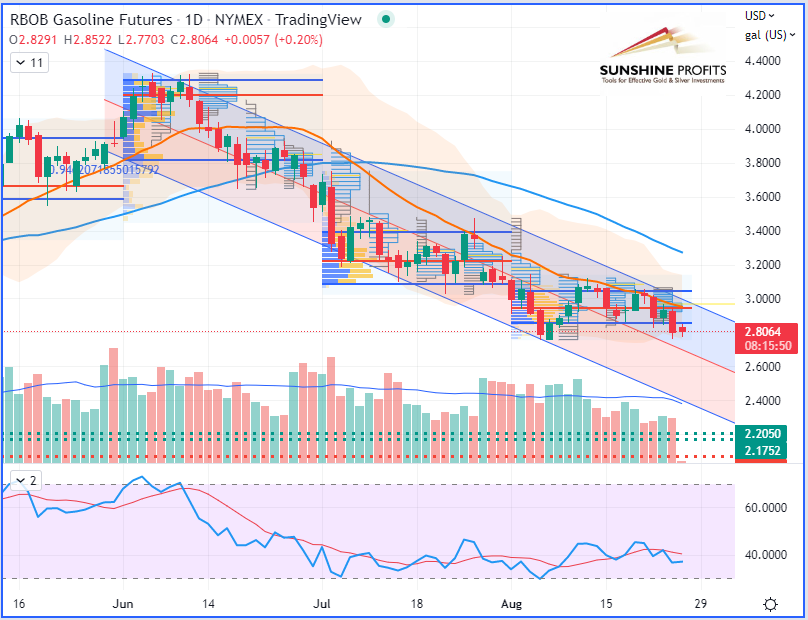
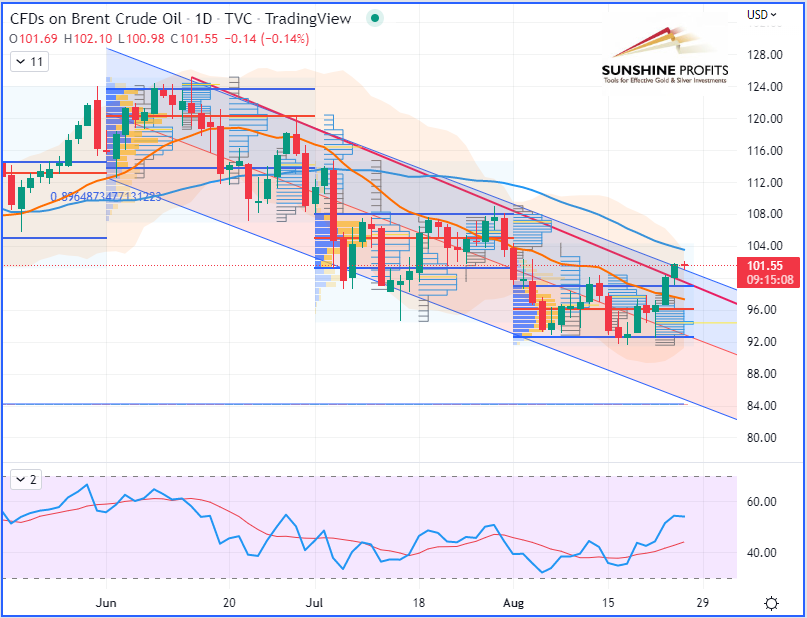
On the daily chart, WTI crude oil (October contract) is falling back to its mean regression line (or median of its regression channel), currently set at 77 periods on the daily chart to get a Pearson’s R (coefficient) above 0.87, that is to say, with a 4-month correlation over 87% for WTI, 93% for RBOB Gasoline, and 90% for Brent (see the charts below).
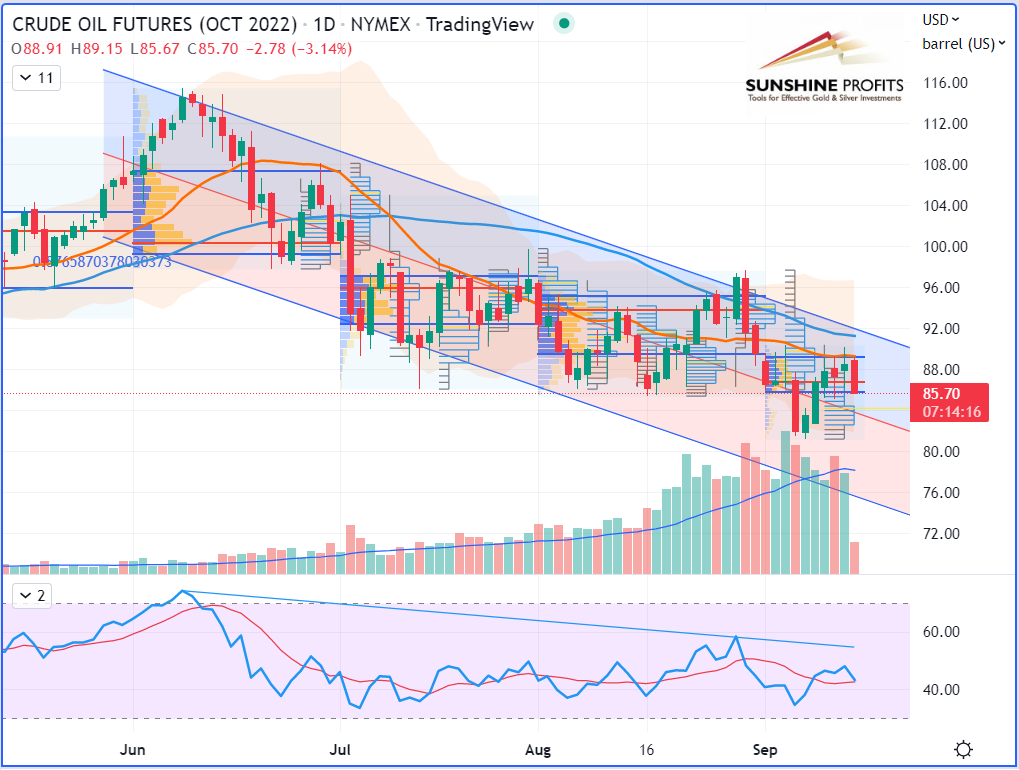
WTI Crude Oil (CLV22) Futures (October contract, daily chart)
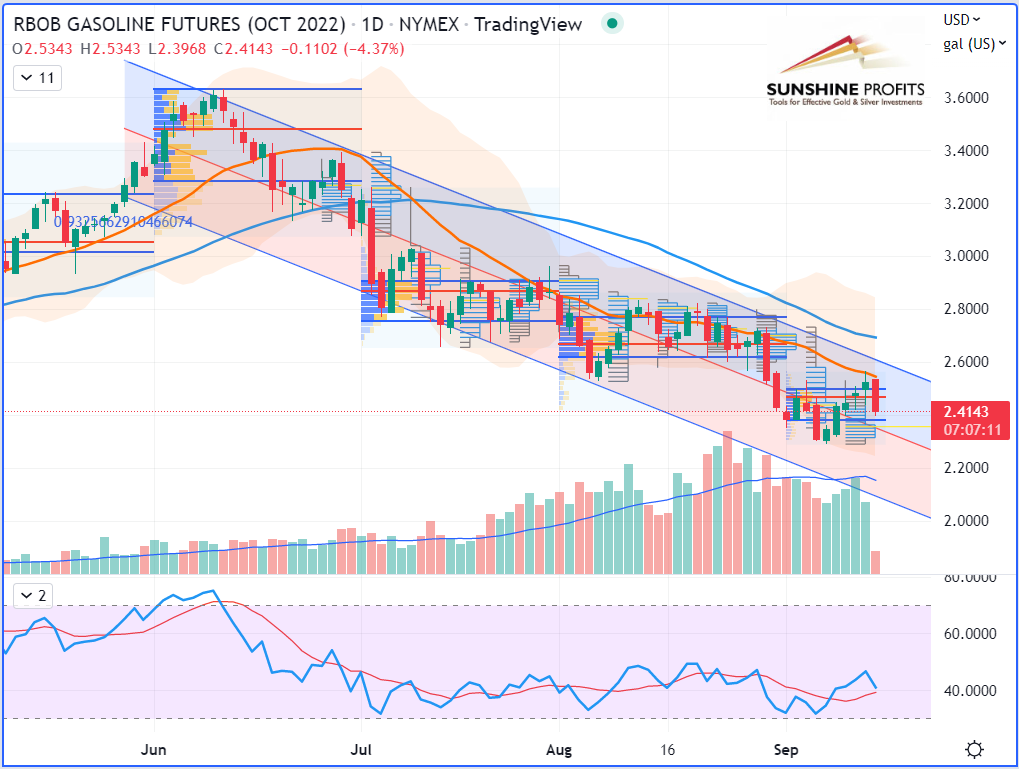
RBOB Gasoline (RBV22) Futures (October contract, daily chart)
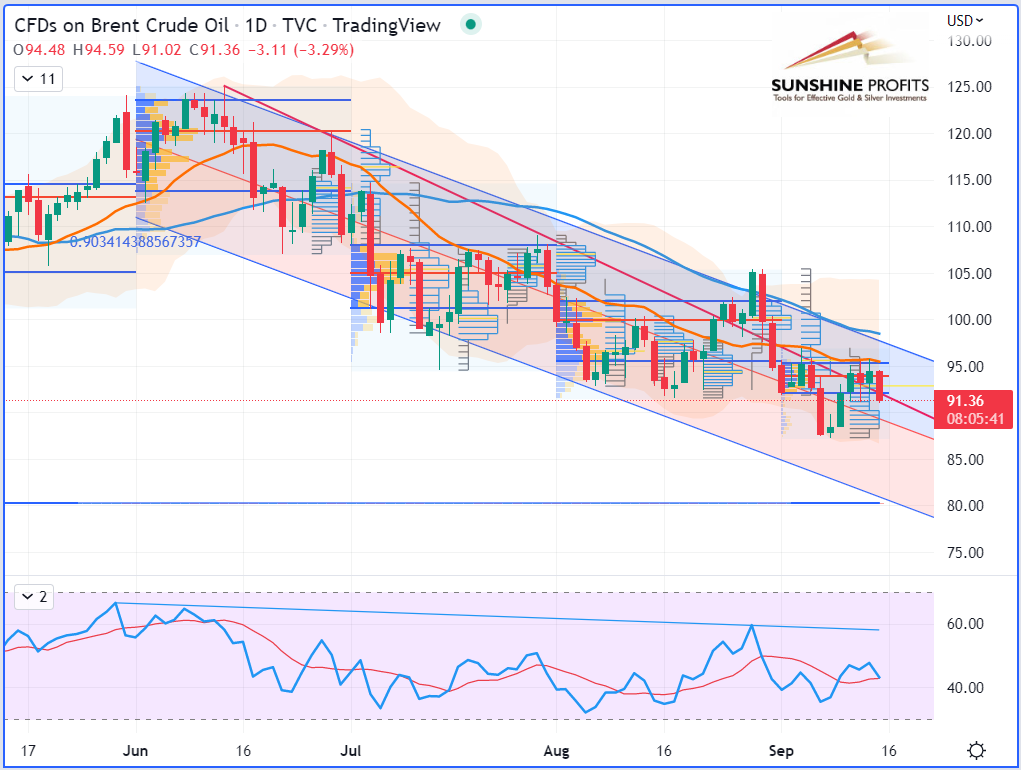
Brent Crude Oil (BRNV22) Futures (October contract, daily chart) – Contract for Difference (CFD) UKOIL
That’s all, folks, for today. Stay tuned for our next oil trading alert!
Today's premium Oil Trading Alert includes details of our new trading position. Interested in more exclusive updates? Join our premium Oil Trading Alerts newsletter and read all the details today.
Thank you.
Sebastien Bischeri,
Oil & Gas Trading Strategist -
WTI Crude Oil Has (Finally) Broken Through Its Summer Support
September 8, 2022, 10:18 AMWhat are the (macro-)economic, geopolitical, and technical factors driving oil prices this week?
Despite Saudi-led OPEC+ output cuts, black gold has walked down the stairs to re-explore the lower floor after progressing in their July-August range between $85 and $100.
Macroeconomics
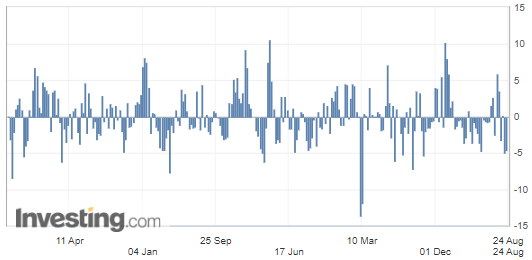
On the macroeconomic view, the greenback explored a new roof as the DXY marched just above $110 at the beginning of the week – still regularly progressing within its yearly regression channel with a Pearson’s R (correlation coefficient) of 97 %.
U.S. Dollar Currency Index (DXY), daily chart
Fundamental Analysis
On Monday, Saudi-leaded OPEC+ members agreed to a small production cut of 100,000 barrels per day from October onwards to bolster prices. The key to this decision is also the possible return of Iran to the market if the economic sanctions are lifted. Indeed, Iran could add up to 1 million bpd to the market even though President Joe Biden told Israeli Prime Minister Yair Lapid during their meeting a week ago that an Iranian nuclear deal was out of the question in the short-term.
It seems that the risk of losing Russian energy supplies is no longer enough to support prices, as traders are focused on demand. In addition, poor Chinese trade figures have recently been published, with a sharp slowdown in export growth, to 7.1% year on year in August (compared to 18% in July). On oil more specifically, Chinese crude imports are down 4.7% since the start of the year compared to the same period in 2021, and imports of refined products have shrunk by 15.9%. Added to this is the new wave of health restrictions, which now affect several hundred million Chinese, to stem a new wave of COVID-19 cases with very strict policies.
U.S. API Weekly Crude Oil Stock
On Wednesday, the American Petroleum Institute (API) released the weekly change in crude oil stock. During the week ended September 4, oil inventory levels were build to an excess of 3.645M barrels, while analysts were anticipating a very light decline.

(Source: Investing.com)
Geopolitics
Russian President Vladimir Putin uses oil and gas as an economic weapon, but the market, rather than worrying about its effect on supply, has turned its attention to the effect on weakening demand at high energy prices. Moreover, on Wednesday, the Russian head of state warned that Russia would no longer deliver oil or gas to countries that would cap the prices of hydrocarbons exported by Moscow since the G7-group and the European Union have prepared projects ranging in this direction.
“Russia will respond to price caps on Russian oil by shipping more oil to Asia,” Russian Energy Minister Nikolai Shulginov said on Tuesday morning at the Eastern Economic Forum in Vladivostok.
“Russia and partners are considering setting up their own insurer to facilitate oil trade.”
“Nothing has been decided on Nord Stream 1 gas pipeline resumption.”
These comments expressed by Nikolai Shulginov came just a few days after members of the G7-group agreed last Friday to impose a price cap on Russian oil in a bid to hit Moscow's ability to finance the war in Ukraine.
Technical Analysis
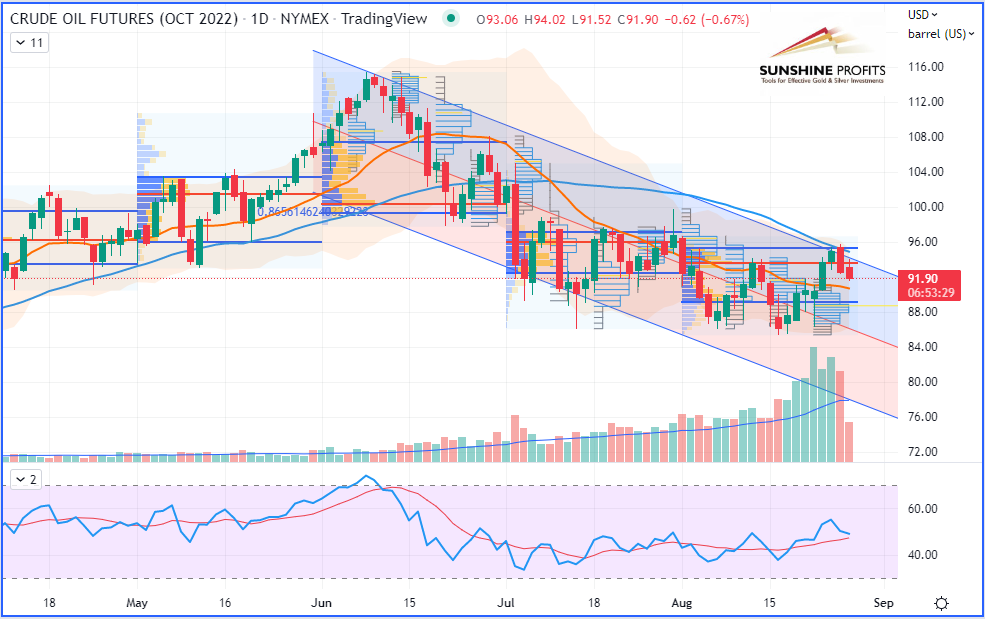
On the daily chart, WTI crude oil (October contract) has just broken below its 10-week support and is moving towards the lower band of the regression channel (which was set with two standard deviations from the mean regression line).
WTI Crude Oil (CLV22) Futures (October contract, daily chart)
RBOB Gasoline (RBV22) Futures (October contract, daily chart)
Brent Crude Oil (BRNV22) Futures (October contract, daily chart) – Contract for Difference (CFD) UKOIL
Today's premium Oil Trading Alert includes details of our new trading position. Interested in more exclusive updates? Join our premium Oil Trading Alerts newsletter and read all the details today.
Thank you.
Sebastien Bischeri,
Oil & Gas Trading Strategist -
Trade Review: How to Spread Risk for a Trade
September 1, 2022, 9:53 AMWelcome on board! Today, I will provide a quick review of last week’s WTI crude oil trade, which has been a little more complex to manage than I originally thought…
My short trade entry was done right around $94.50-95.25 – around the 50-day moving average (DMA) – with a stop placed at the previous swing low ($99.75).
Then, as the market fell rapidly into the August value area (VA), I decided to drag my stop lower ($95.76) and so well above the 50-DMA. In the meantime, as the market retraced slightly while finding rejection to the upside, it finally settled by forming a “doji” candlestick on Friday.
A reminder on risk management:
If, like me, you followed the risk management guidelines that I presented in this article that were recalled below the trading position section – that is to say, by dragging the stop slightly lower when price was reaching levels below the midpoint to target one ($90.07) – then let’s recap how to locate the new stop placement by taking the following example:
- Let’s say you entered at $95;
- The first target was defined at $90;
- When the price falls below the midpoint: 90.07+(95-90.07)/2 = $92.54;
- The market made its low on Friday (Aug-26) at $91.08 (so just $1 above its initial target);
- Thus, given that this low was $1.46 below the midpoint (92.54-91.08 = 1.46), the stop can be dragged down $1.46 below the entry ($95) to protect the trade, therefore at $93.55 precisely.
WTI Crude Oil (CLV22) Futures (October contract, daily chart) – Chart based on Aug-26’s data, however the market closed on a “doji” candle (in other terms, it closed at its open price) – See following chart with highlighted doji…
Personally, this is what I’ve been doing myself:
Since I provided 3 targets for that trade, I entered with 3 micro e-mini contracts (MCL), with 3 initial stops placed at $99.75. On Friday (Aug-26), I dragged the stop for one contract (first third of the position) at $95.76, then another stop for the second contract (second third of the position) at $93.55 (as defined below), and I left the third stop (last third of the position) at the initial level of $99.75. By doing so, my risk was spread to different levels.
If you noticed in my last article, I suggested reducing the risk just before the weekend. This is crucial to do so before the weekend. I know there might be some slippage risk eventually when the market opens on Sunday night and if something happens during the weekend. However this is still better than doing nothing and seeing some profits being swept away by sudden events that were not priced in the market.
On Saturday, there was a geopolitical event that wasn’t expected at all, and as a result, it shook the oil market towards the upside on Monday (Aug-29).
Indeed, there were unexpected fights in Libya's capital of Tripoli - the worst fighting in years - which were quickly priced into the oil market on Monday because the situation could have a significant impact on Libyan oil exports. Consequently, during that strong move up, two of my stops got triggered on Monday (Aug-29). Those were placed at $93.55 (so about $145 gross profits) and $95.76 (about $77 losses) on micro e-mini contracts, excluding commissions.
Since I had left my last target at $86.07 for the last remaining third of my trading position, as the market today just moved below my second stop and also made a lower low over the third consecutive day, I just finally dragged my last stop at the high of today’s candlestick, so hopefully this will leave enough breathing space prior to reach the last and final target ($86.07).
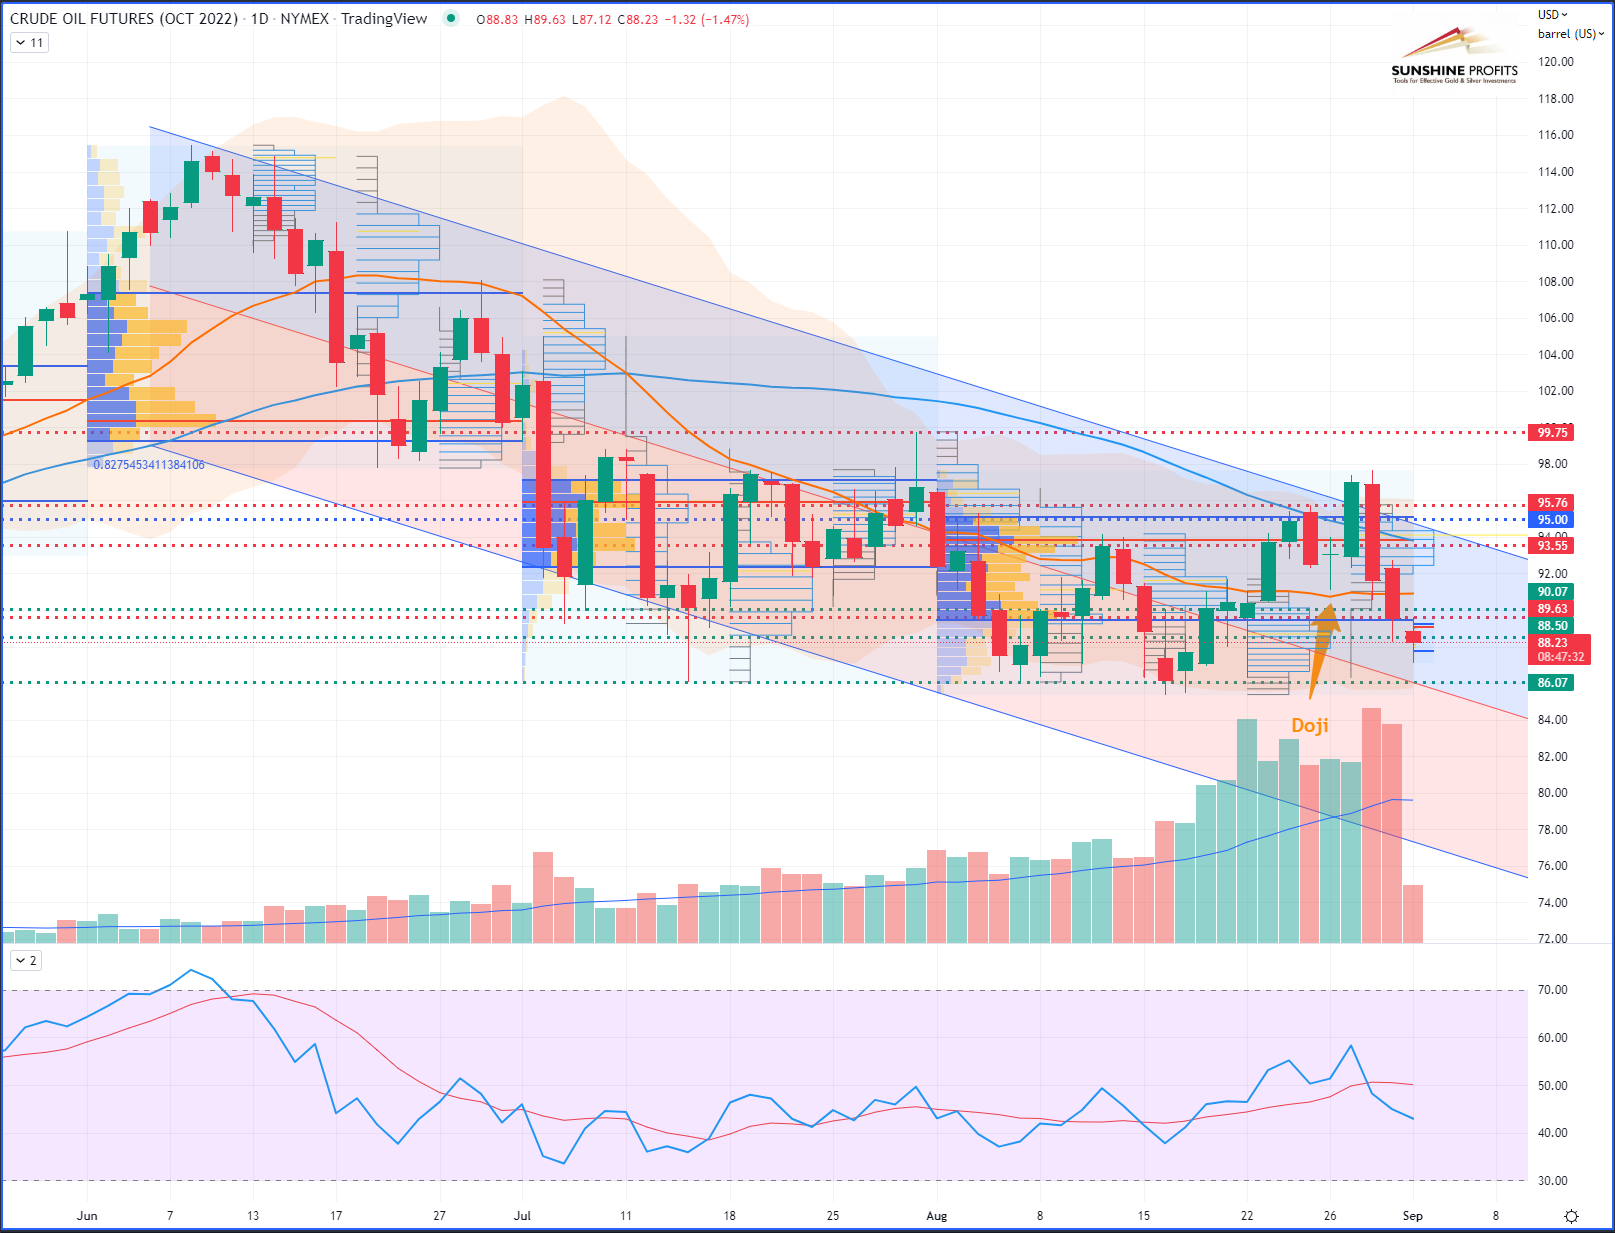
WTI Crude Oil (CLV22) Futures (October contract, daily chart) – Chart based on today’s updated data.
I hope this will make sense to you guys, and if that may help you see risk management in a more dynamic dimension, as I am trying to do, then it would be helpful to get your feedback.
How do you manage your risk? Do you use multiple stop levels as well in certain situations? Do you prefer sticking to a static level to allow your entire trade position to "breathe," or do you prefer manually closing a position whenever it reaches a desired level or gives you potential reversal signals? In the latter case, which signals would you rely on?
That’s all, folks. Have a great weekend! By the way, from this new starting month, expect some more trading alerts, with the introduction of new charting tools and some market insights presented in a new format. So just stay tuned!
As always, I welcome any recommendations you may have on different assets, markets, or products, so feel free to write me back or send your own suggestions in the comments section.
Today's premium Oil Trading Alert includes details of our new trading position. Interested in more exclusive updates? Join our premium Oil Trading Alerts newsletter and read all the details today.
Thank you.
Sebastien Bischeri,
Oil & Gas Trading Strategist -
Trade Management: Risk Reduction Before the Weekend
August 26, 2022, 11:16 AMAvailable to premium subscribers only.
Today's premium Oil Trading Alert includes details of our new trading position. Interested in more exclusive updates? Join our premium Oil Trading Alerts newsletter and read all the details today.
Thank you.
Sebastien Bischeri,
Oil & Gas Trading Strategist -
WTI Crude Oil Is Facing a Strong Hesitation Area
August 25, 2022, 10:34 AMWhat are the (macro-)economic, geopolitical, and technical factors driving oil prices this week?
Crude oil settled on Wednesday at its highest level in nearly a month, boosted by another larger-than-expected drop in U.S. crude inventories. The prospect of a possible OPEC+ production cut announced by Saudi Arabia following a potential return of Iranian barrels into the market also played a part in this.
Macroeconomics
On the macroeconomic view, the greenback went towards its highest level against a basket of currencies this week as the US dollar index (DXY) topped 109.270 on Tuesday – just getting close enough to its 109.294 top reached on July-14.
U.S. Dollar Currency Index (DXY), daily chart
Fundamental Analysis
On Wednesday, the Energy Information Administration (EIA) released the weekly change in Crude Oil Inventories.
U.S. Crude Oil Inventories
During the week ended August 19, commercial oil stocks contracted by 3.3M barrels, while analysts were anticipating a lighter decline.

On the other hand, strategic oil reserves have lost 8.1M barrels, a record, according to Kpler. All in all, U.S. stocks, both commercial and strategic, are at their lowest level for nearly 20 years (since June 2003).
(Source: Investing.com)
This contraction in crude stocks is largely attributable to the high level of exports since the acceleration in European demand is helping to push up US exports and therefore lower inventories. Indeed, total crude and refined product exports reached an all-time high level last week – 11M barrels per day – 40% more than a year ago at the same time.
U.S. Gasoline Inventories
Regarding the U.S. gasoline demand figures, the market players were sensitive to the maintenance of gasoline inventories at an almost unchanged level, while analysts expected a drop of 1.5 million barrels over the week.

(Source: Investing.com)
This may trigger the effect of heightening concerns about an economic slowdown given that weekly gasoline demand figures have been very volatile throughout the summer.
Geopolitics
On the geopolitical scene, the negotiations around the Iranian nuclear deal, foretelling a return of Iranian barrels, were followed by the eventual prospects of OPEC+ members, which would cut their output in this eventuality, so it offset the bearish factor that I was mentioning last week.
Technical Analysis – Introduction to Regression Channels
On the daily chart, WTI crude oil (October contract) has just reached the upper band of the regression channel, set up as two standard deviations from the mean regression line. The latter being the best fit with a Pearson’s R coefficient of 86.5. For those who are not too familiar with this statistical tool, it just means that the regression-based (mean) trend line is defined with a correlation of about 86.5 % compared to the evolution of prices since the end of May. For a quick introduction to regression channels, here is a short video published by TD Ameritrade.
Therefore, the price area around $ 94.50, which also corresponds to the location of the 50-day moving average, could potentially be a good level to enter a short trade with a relatively tight stop and a price target providing a fairly good risk/reward ratio from a money management point of view. More details of this trade projection will be provided within our subscribers’ section.
WTI Crude Oil (CLV22) Futures October contract, daily chart)
RBOB Gasoline (RBV22) Futures (October contract, daily chart)
Brent Crude Oil (BRNV22) Futures (October contract, daily chart) – Contract for Difference (CFD) UKOIL
Today's premium Oil Trading Alert includes details of our new trading position. Interested in more exclusive updates? Join our premium Oil Trading Alerts newsletter and read all the details today.
Thank you.
Sebastien Bischeri,
Oil & Gas Trading Strategist


Free Gold & Oil Newsletter
with details not available
to 99% investors
+ 7 days of Gold Alerts
+ Mining Stock Rankings
Gold Alerts
More-
Status
New 2024 Lows in Miners, New Highs in The USD Index
January 17, 2024, 12:19 PM -
Status
Soaring USD is SO Unsurprising – And SO Full of Implications
January 16, 2024, 8:40 AM -
Status
Rare Opportunity in Rare Earth Minerals?
January 15, 2024, 2:06 PM
Metals charts