

Just like a month ago, we begin the current Oil Investment Update with the words that we used to summarize the situation in the previous update (on Nov 7, 2016). We summarized the situation in the following way:
(…) oil bears accumulated enough strength to push the commodity below the barrier of $50, triggering a decline that erased almost all mid-Sep – Oct upward move. Although such price action doesn’t bode well for crude oil, we should keep in mind that not only crude oil, but also the oil-to-oil stocks, oil-to-gold, oil-to-stocks and the WTIC:UDN ratio reached their important support zones. Additionally, the current position of the daily indicators (not only in the case of crude oil, but also in the case of all our above-mentioned ratios) suggests that the space for declines may be limited as they slipped to the levels not seen since Aug or Sep and there are positive divergences, which increase the probability of reversal in near future. Therefore, if we see such price action, and crude oil rebounds from current levels, we’ll see (…) a rebound to around $47.36-$48, where the previously-broken 50-day moving average and the red support/resistance line (based on the Aug and mid-Sep lows) are. If this area is broken, the next targets would be: the medium-term black rising support/resistance line based on the Feb and Aug lows (…), the barrier of $50 and the 2016 high of $52.22, which together create the red resistance zone marked on the daily chart.
From today’s point of view, we clearly see that oil bulls realized the above-mentioned scenario and pushed crude oil not only to the red resistance zone, but also to a fresh 2016 high of $52.42. Although this was a bullish signal, the key resistance lines continue to keep declines in check. Will we see breakouts and fresh peaks in the coming weeks? Let’s jump right into charts (charts courtesy of http://stockcharts.com) and try to find an answer to this question.
Crude Oil
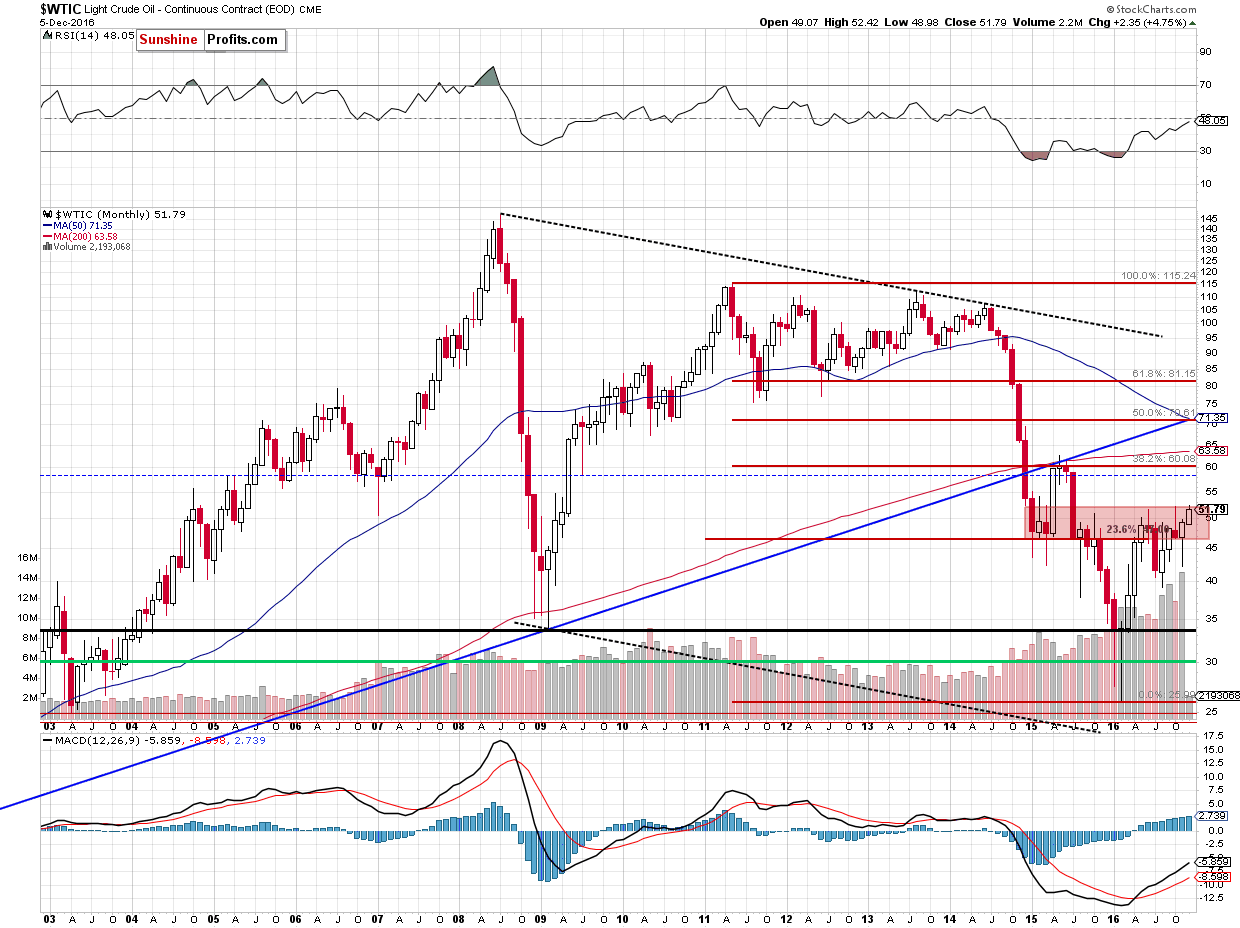
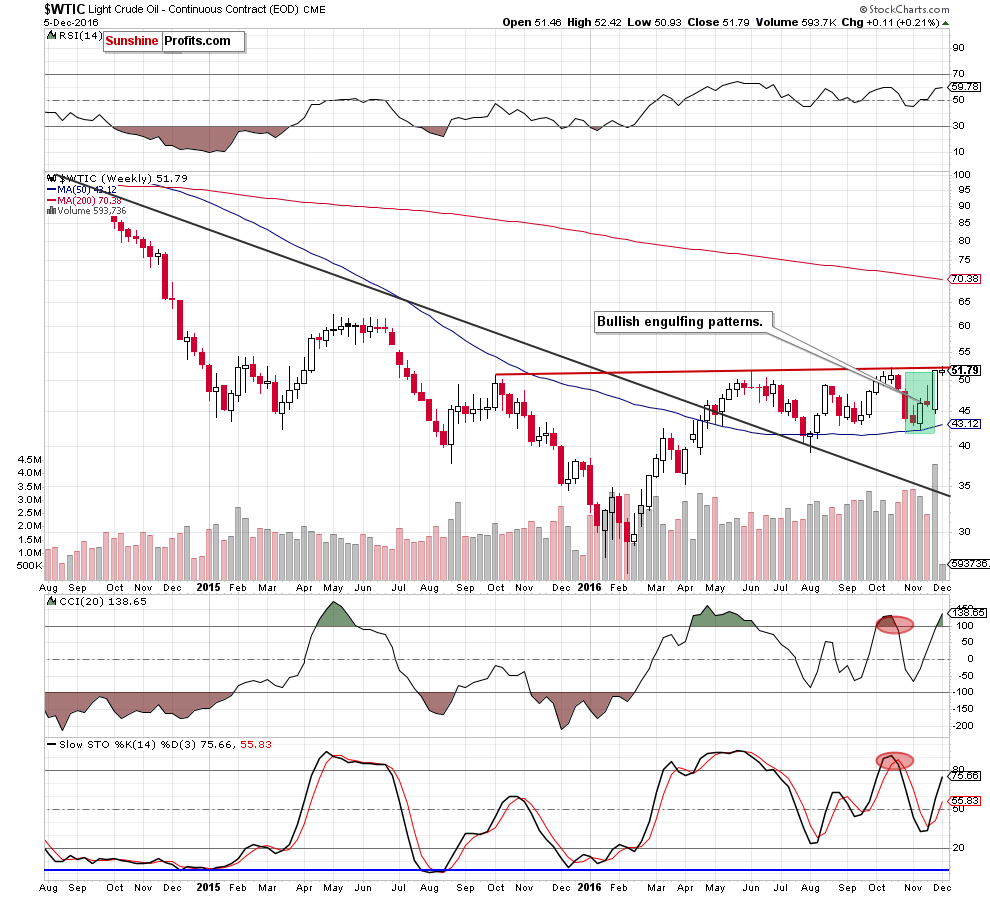
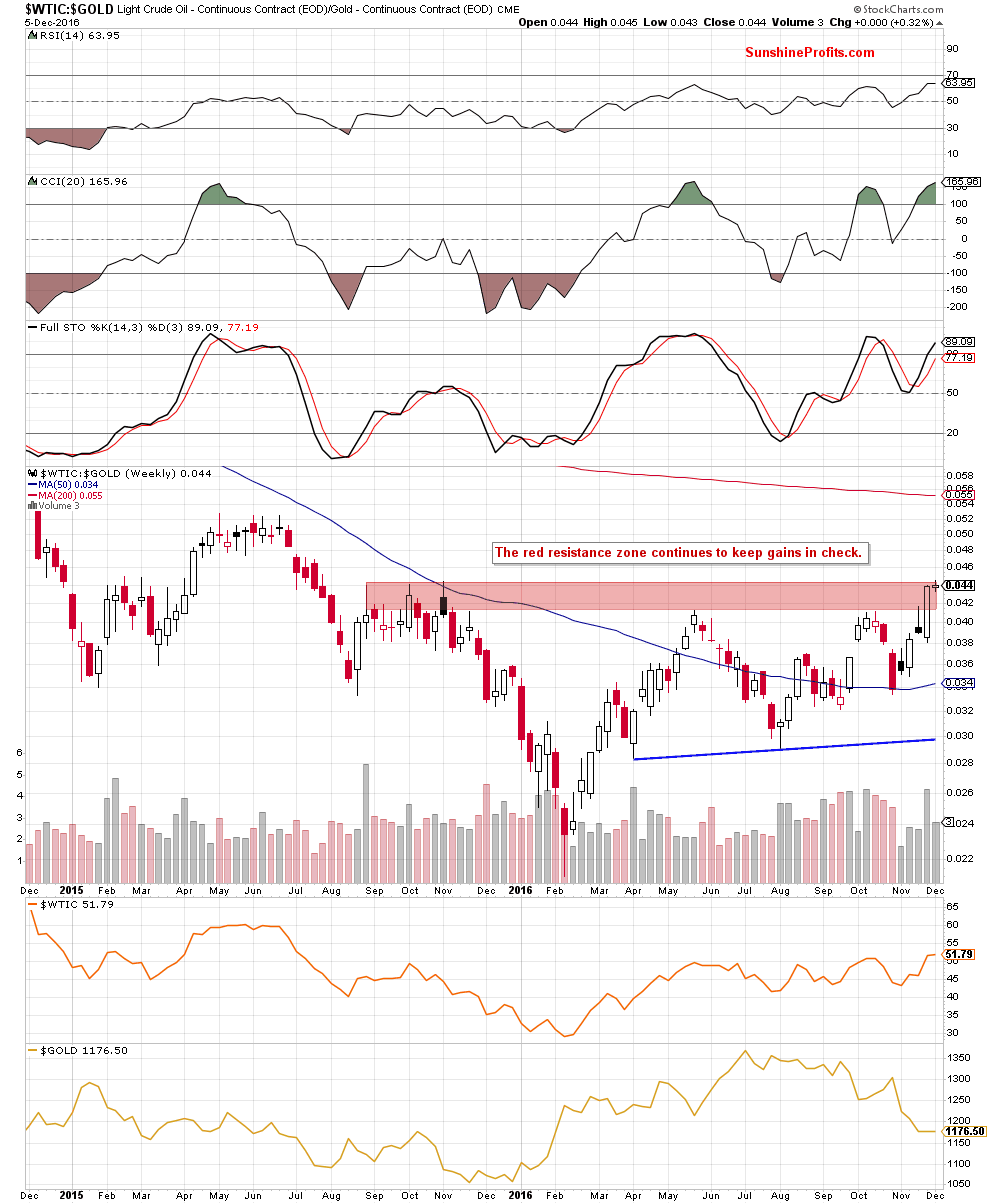
Looking at the long-term chart, we see that crude oil reached the key red resistance zone once again. This area was strong enough to stop oil bulls in Jun and also in Oct, which suggests that another attempt to move lower from here is very likely – especially when we factor in the proximity to the long-term red resistance line based on the previous peaks (marked on the weekly chart below).
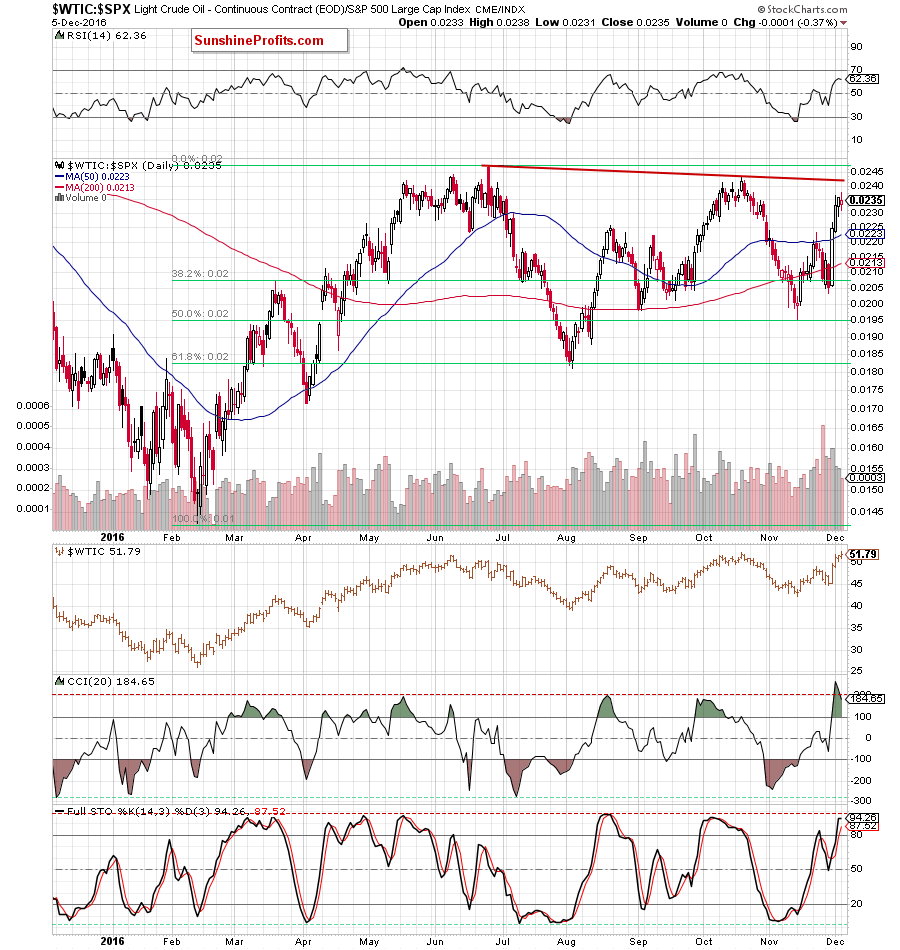
On top of that, the picture that emerges from the very short-term chart also favors oil bears and lower prices of the black gold. Let’s take a closer look at the daily chart.
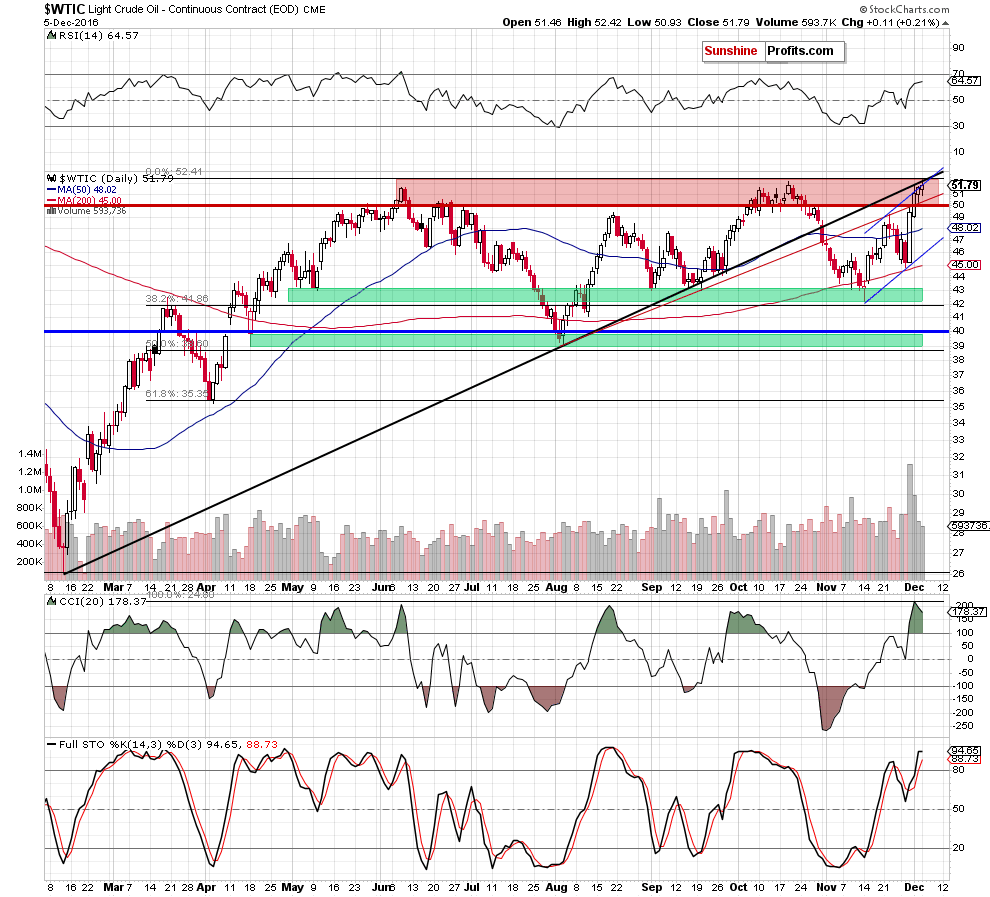
From this perspective, we see that although crude oil extended gains and hit a fresh 2016 high of $52.42 yesterday, the combination of the long-term red resistance line based on the previous peaks (marked on the weekly chart) and the medium-term black resistance line based on the Feb and Aug lows (seen on the daily chart) stopped oil bulls. As a result, the commodity pulled back, which took the price not only under the previously-broken Oct peak, but also below the upper border of the blue rising trend channel, which means an invalidation of earlier breakouts.
Such price action doesn’t bode well for the commodity – especially when we factor in the fact that yesterday’s increase materialized on a smaller volume once again (as a reminder, the size of volume that accompanied recent increases (since Wednesday) has steadily decreased, which suggests that the rally can go without steam). Additionally, the CCI and Stochastic Oscillator climbed to the highest levels since Oct, which increases the probability of reversal in the coming days.
If this is the case and we see a correction of the recent rally, the initial downside target would be the previously-broken red line based on the Aug and Sep lows, the Nov 22 high of $49.20 or even the 50-day moving average.
Summing up, although crude oil hit a fresh 2016 high, the medium-term black resistance line based on the Feb and Aug lows and the long-term red resistance line based on the previous peaks continue to keep gains in check, which means that as long as there won’t be a breakout above them further rally is not likely to be seen.
Having discussed the situation in crude oil, let’s examine the NYSE Arca Oil Index (XOI) to find out what the current outlook for oil stocks is.
Oil Stocks
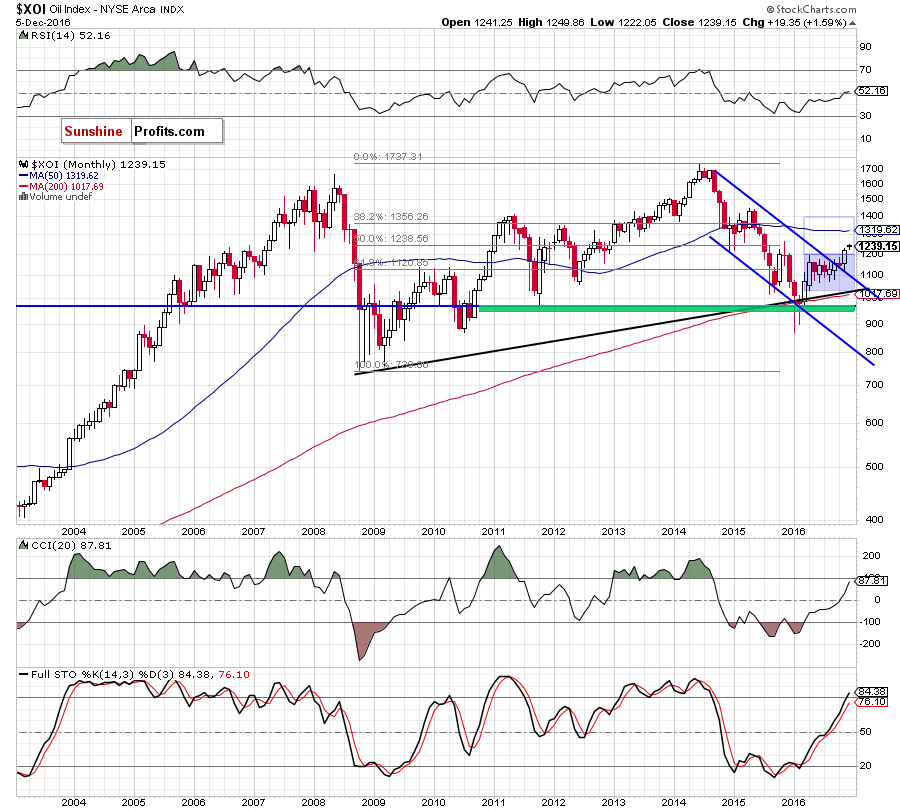
On the long-term chart, we see that after several months in a blue consolidation, the XOI finally broke above the upper border of the formation, which is a bullish signal that suggests further improvement and (at least) a climb to the previously-broken 50-month moving average around 1,319.
What’s interesting, in this area is also a strong resistance zone seen more clearly on the weekly chart below.
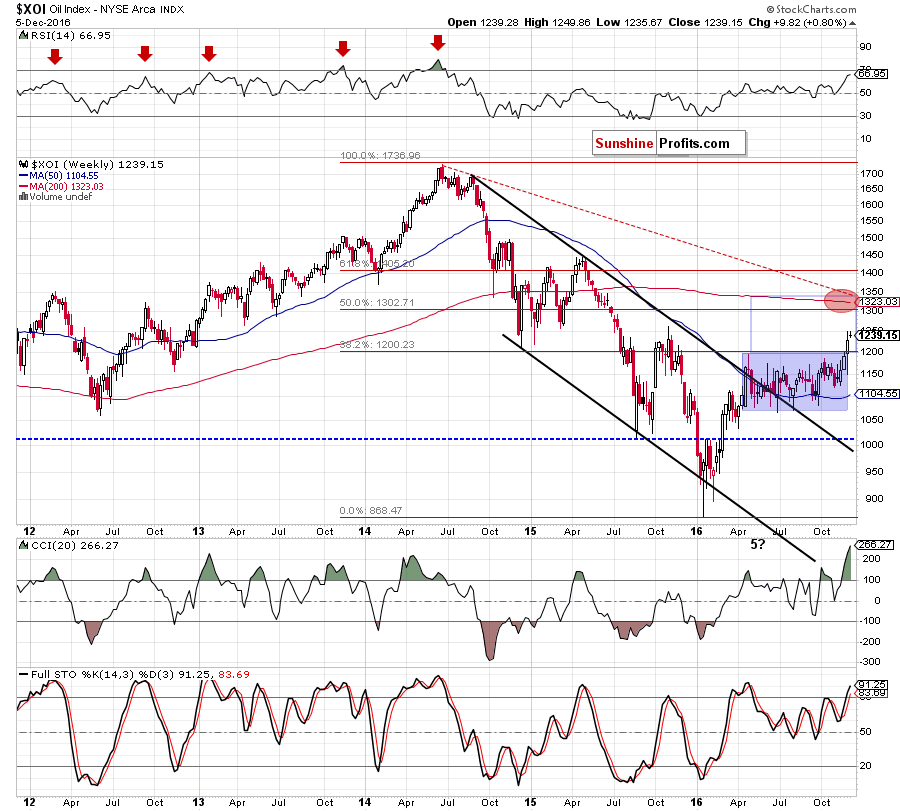
From this perspective, we see that the above-mentioned zone (around 1,300-1,345) is created by the long-term red dashed declining line (based on the Jun and Sep 2014 highs), the 200-week moving average and the 50% Fibonacci retracement (based on the 2014-2016 downward move). Additionally, in this area the size of an upward move will correspond to the height of the blue consolidation marked on the medium-term chart. Taking this strong resistance into account, we think that as long as there won’t be breakout above it, further improvement is not likely to be seen.
Summing up, after several months in the consolidation, oil stocks broke above the upper line of the formation, which suggests further improvement and a climb to the Nov 2015 high of 1,262 or even to the red resistance zone (marked on the weekly chart around 1,300-1,345) in the coming weeks.
Ratio Analysis
Once we know the current situation in crude oil and oil stocks, let’s focus on the relationship between them. What can we infer from the charts below?
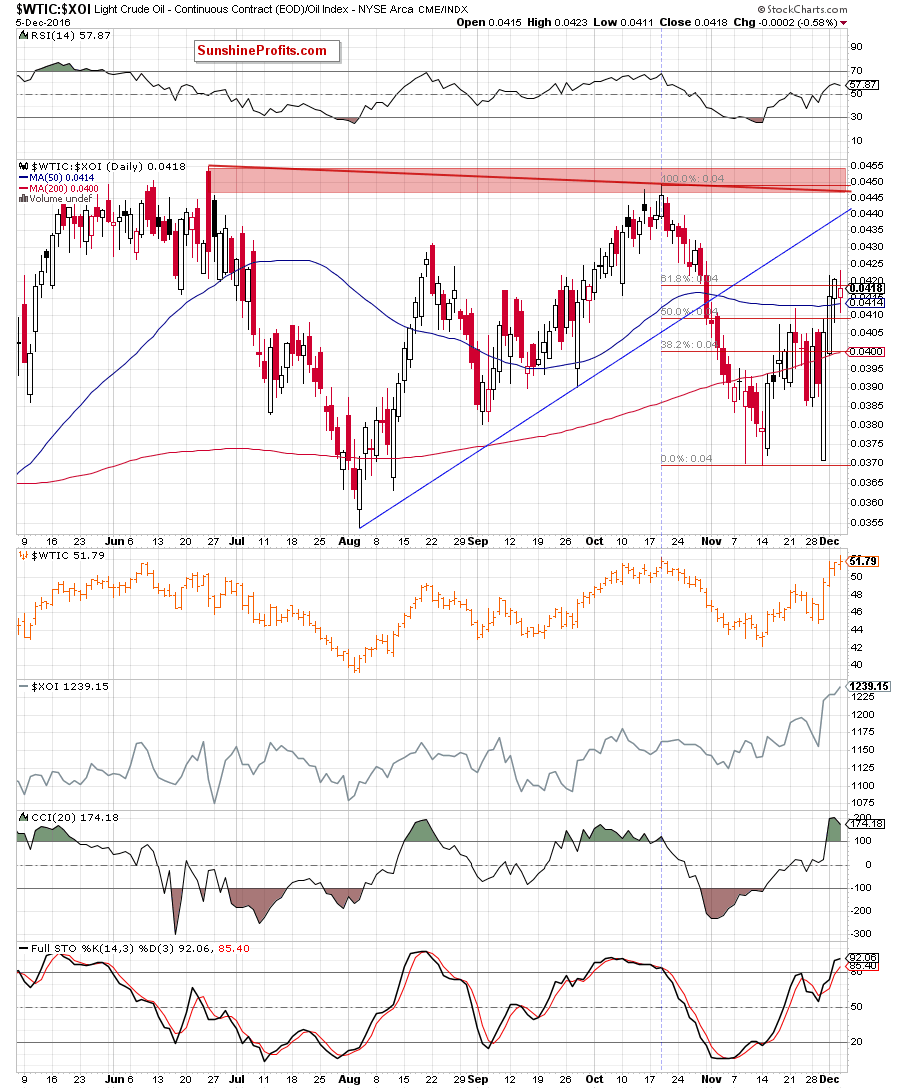
On the daily chart, we see that the ratio bounced off the Nov lows and climbed above the previously-broken 50-day moving average, invalidating earlier breakdown. Although this is a positive signal, which suggests further improvement, we should keep in mind that the ratio reached the 61.8% Fibonacci retracement, which continues to keep gains in check. Additionally, the CCI and Stochastic Oscillator increased to the highest levels since Oct, which increases the probability of reversal in the coming days.
Nevertheless, even if we see another attempt to move higher, the space for gains seems limited as the key red resistance zone is not far from current levels.
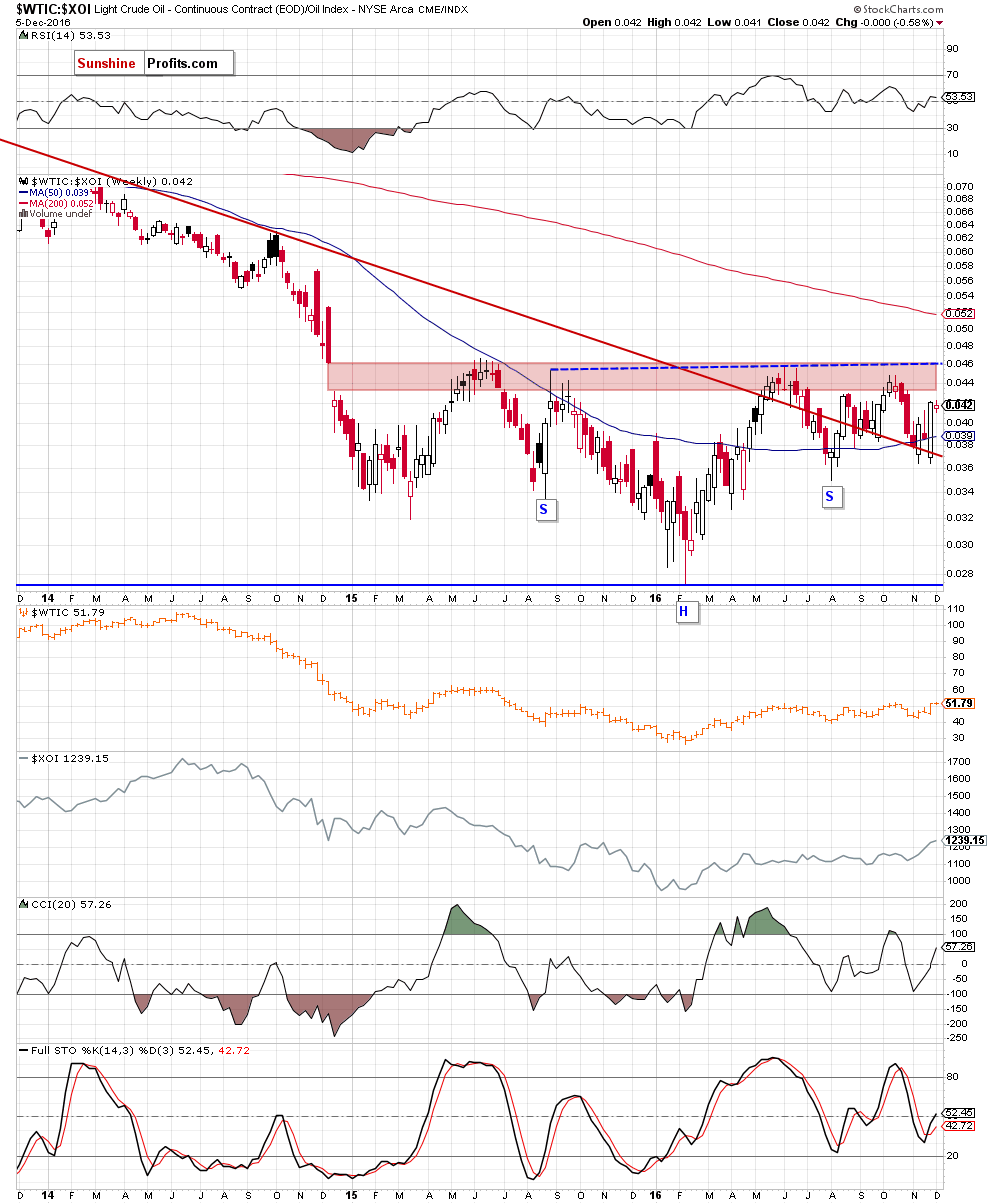
As you see on the weekly chart, this area (based on the Dec 2014 gap) continues to keep gains in check. Therefore, we think that even if the ratio increases slightly from here, as long as there won’t be a breakout and a weekly closure above the upper border of the zone (which is currently reinforced by the neck line of a potential reverse head and shoulders formation) further rally is not likely to be seen and another reversal is very likely (not only in the case of ratio, but also in the case of crude oil as strong positive relationship remains in play).
Will the relationship between crude oil and precious metals confirm this pro bearish scenario? Let’s check the chart below and find out.
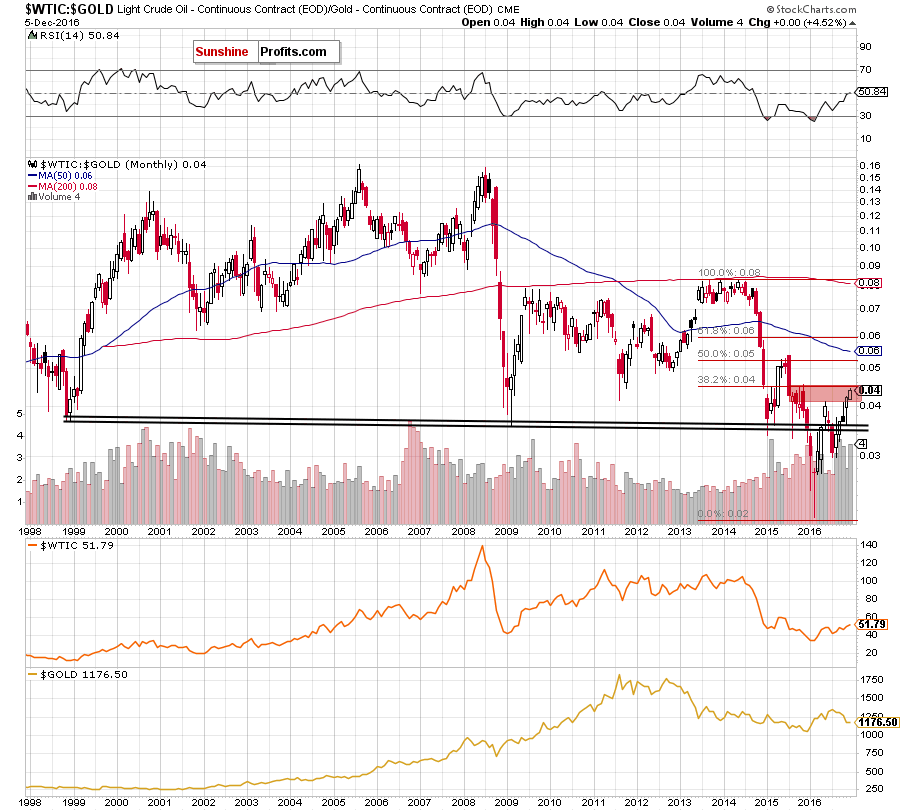
On the long- and medium-term charts, we see that the ratio reached the upper border of the red zone, which is the key resistance at the moment. Therefore, even if we see another attempt to move higher, in our opinion, the space for gains seems limited as the late 2015 highs and the 38.2% Fibonacci retracement (based on the 2013-2016 downward moves) are very close to the current position of the ratio. As you see, this area was strong enough to stop increases in May and also in Oct, which suggests that we may see similar price action in very near future.
Additionally, this scenario is also supported by the very short-term picture.
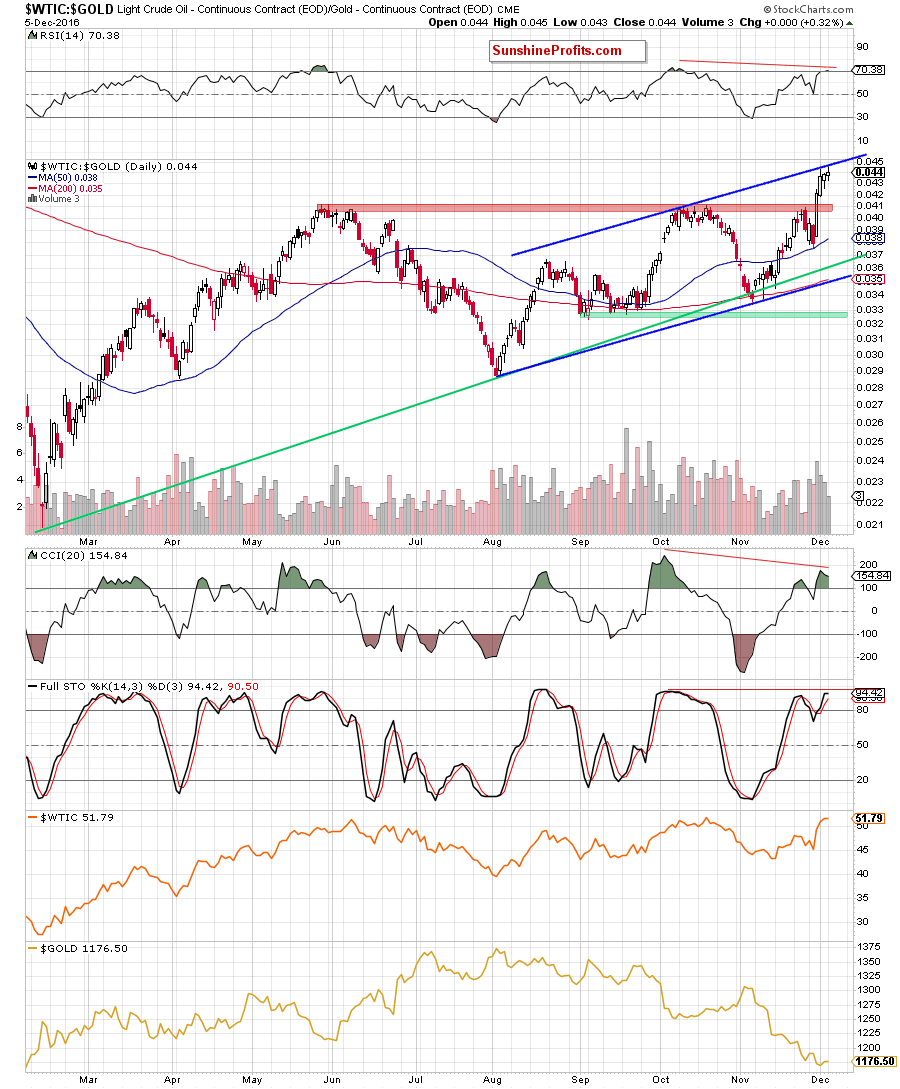
From this perspective, we see that the oil-to-gold ratio climbed to the upper line of the blue rising trend channel, which in combination with the current position of the indicators (the RSI moved above the level of 70 and there are negative divergences between all indicators and the ratio) and decreasing volume during recent increases suggests that reversal and lower values of the ratio are just around the corner.
What does it mean for crude oil? Taking into account a strong positive correlation between the ratio and the commodity, we believe that lower prices of black gold are very likely in the coming week(s).
Having said that, let’s take a closer look at the oil-to-silver ratio.
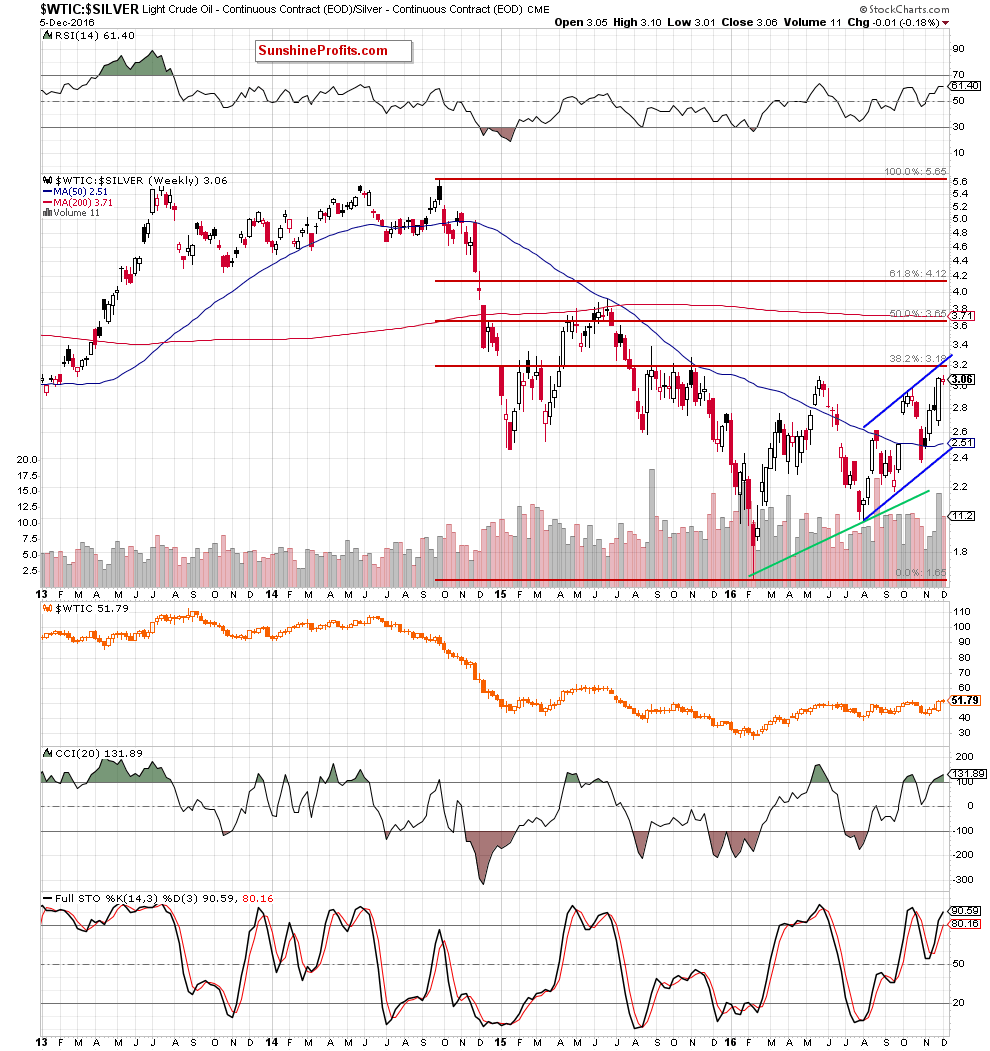
From the weekly perspective, we see that the last week’s sharp increase approached the ratio not only to the upper line of the blue rising trend channel, but also to the 38.2% Fibonacci retracement which suggests that the space for further rally may be limited and reversal in the coming week(s) should not surprise us – especially when we take into account the very short-term picture.
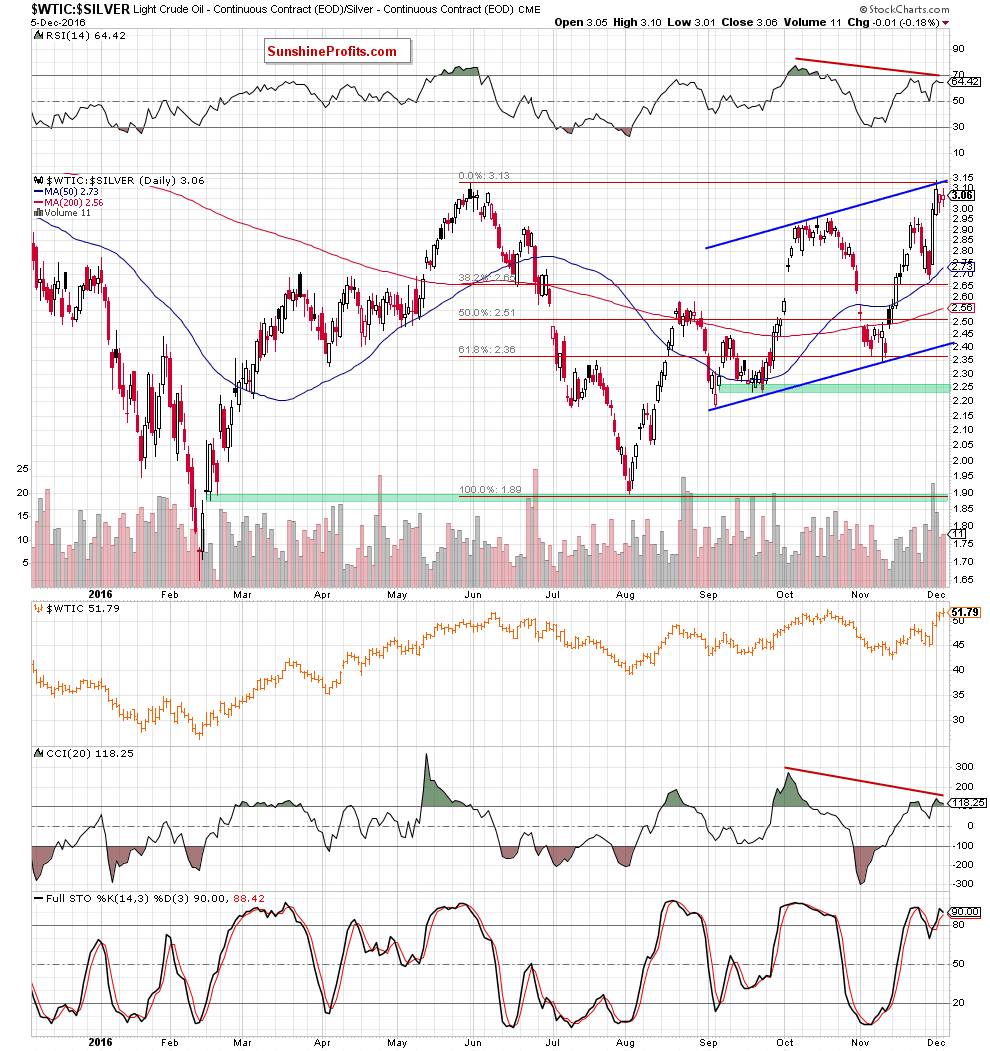
As you see from this perspective, although the ratio increased slightly above the May peak and the upper line of the blue rising trend channel, this improvement was very temporary and we noticed a pullback, which invalidated earlier tiny breakouts (the first negative development). Additionally, the size of volume increased during recent sessions, which suggests that bulls may lose strength in near future. Another disturbing factor is negative divergence between all indicators and the ratio, which increases the likehood of reversal. If we see such price action, the price of crude oil should also move lower as (similarly to what we wrote in the case of oil-to-gold ratio) a positive correlation between the ratio and light crude is still in cards.
Will the relation between oil and the general stock market give us more bearish signals?
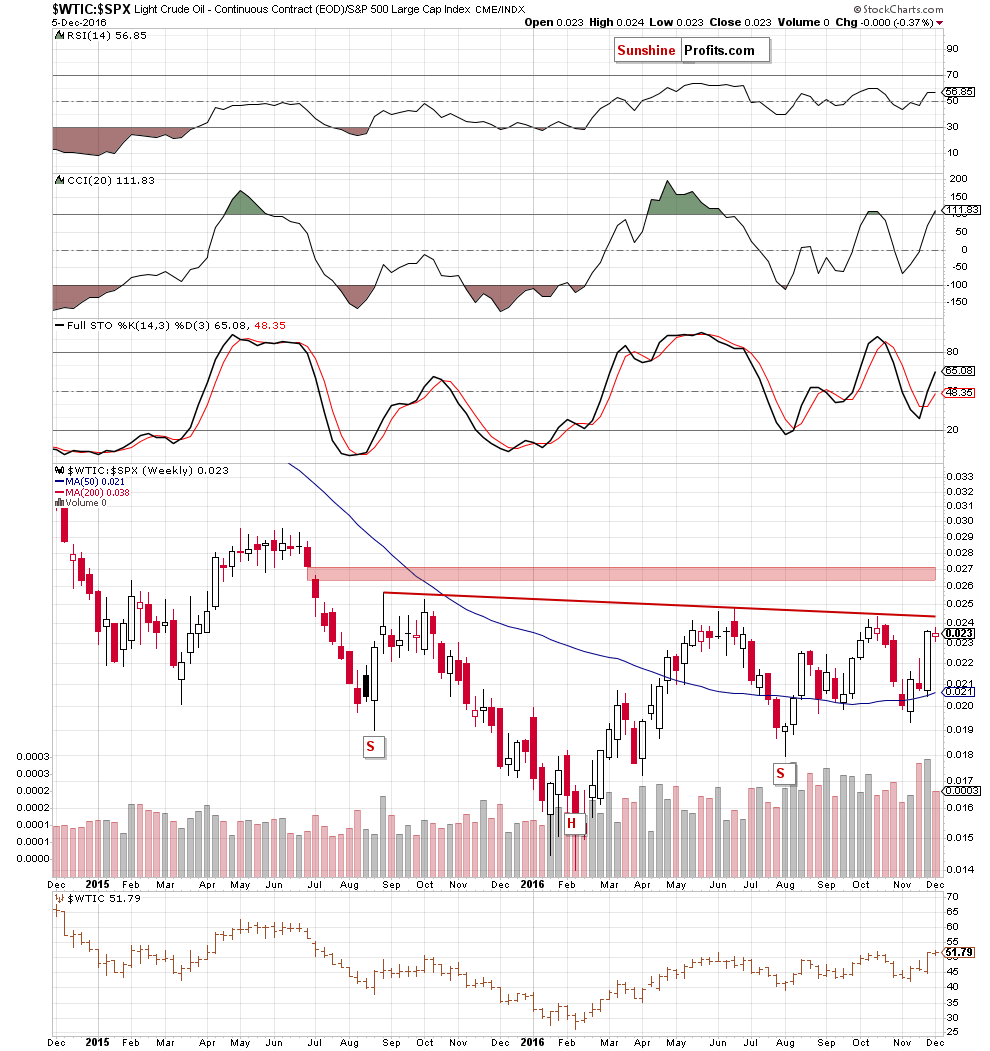
Yes. Why? On the weekly chart, we see that although the ratio invalidated earlier breakdown under the 50-week moving average, the recent sharp increase didn’t take it to a fresh 2016 high (similarly to what we saw in the case of the oil-to-oil stocks ratio). Instead, the ratio is still trading under the key red resistance line (based on the Aug 2015 and Jun 2016 highs). As you see, it successfully stopped increases in mid-Oct, which in combination with the current position of the daily indicators (the CCI and Stochastic Oscillator are overbought and close to generating sell signals) suggests that another attempt to move lower (not only in the ratio but also in light crude) may be just around the corner.
Non-USD Crude Oil Price
Finishing our today’s ratios’ analysis, let’s take a closer look at the non-USD (WTIC:UDN ratio) chart of crude oil. As a reminder, UDN is the symbol for the PowerShares DB US Dollar Index Bearish Fund, which moves in the exact opposite direction to the USD Index. Since the USD Index is a weighted average of the dollar's exchange rates with world's most important currencies, the WTIC:UDN ratio displays the value of crude oil priced in "other currencies".
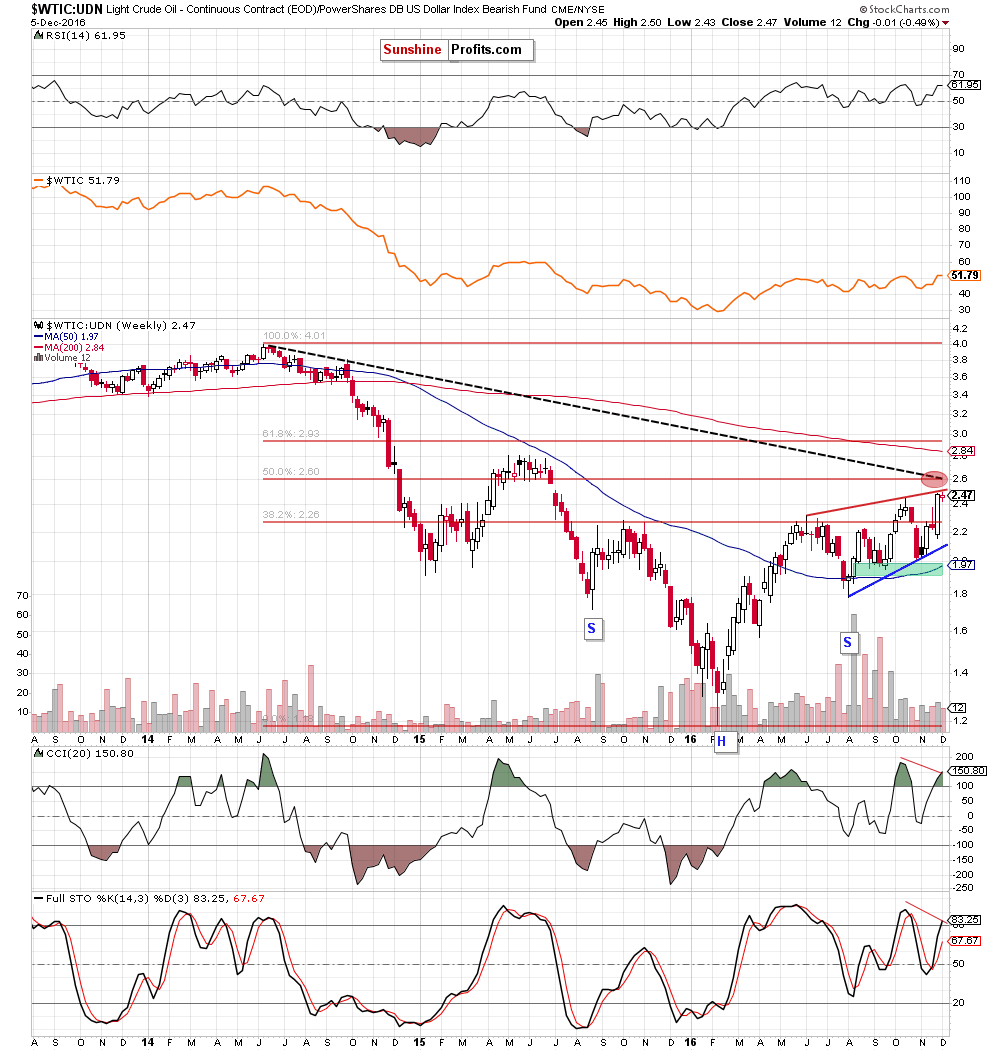
From this perspective, we see that the ratio moved sharply higher and approached the red rising resistance line based on the previous highs (similarly to what we wrote in the case of crude oil priced in U.S. dollars), which suggests that the space for gains may be limited and reversal is just around the corner – especially when we factor in the proximity to the black dashed declining resistance line and the 50% Fibonacci retracement. On top of that, there are also negative divergences between all indicators and the ratio, which doesn’t bode well for further rally.
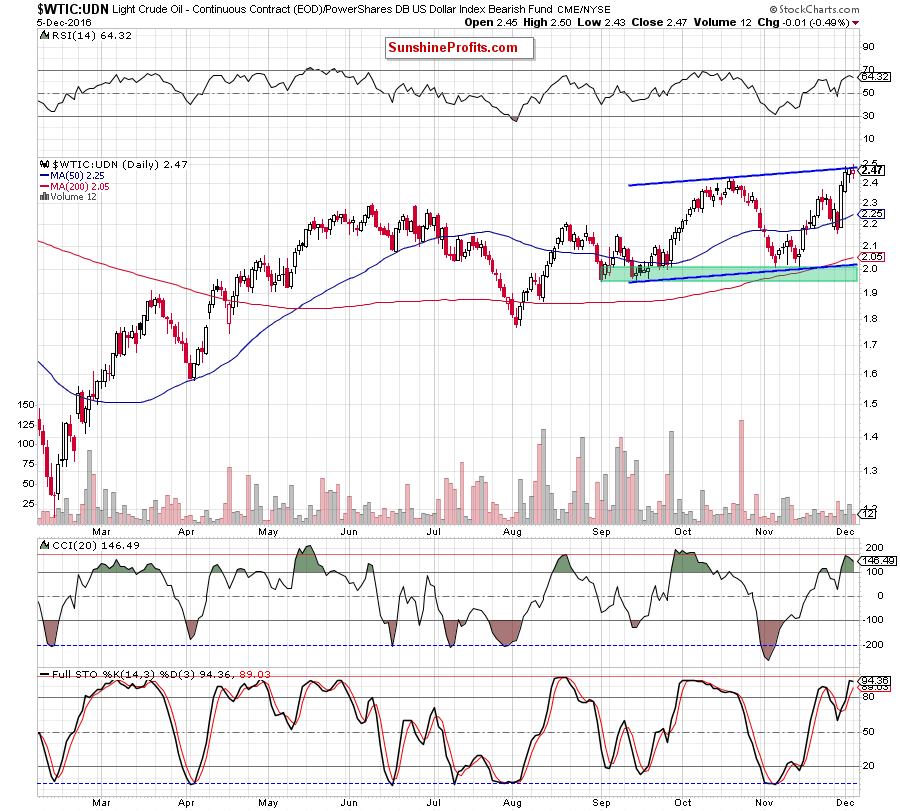
A pro bearish scenario is also reinforced by the current position of the daily indicators seen on the chart below (negative divergences, the CCI and Stochastic Oscillator overbought and close to generating sell signals).
Scenarios
Just like a month ago, today’s Oil Investment Update includes scenarios of what could happen in the coming weeks. Naturally, we will continue to monitor the market in the coming days and if anything invalidates our long-term outlook we will send you an additional message.
- Bullish scenario
If crude oil comes back above the upper border of the blue rising trend channel (seen on the daily chart) and oil bulls manage to push the black gold above the medium-term black resistance line and the long-term red resistance line marked on the weekly chart, we may see a rally to around $60-$62.58, where the 38.2% Fibonacci retracement (based on the entire 2011-2016 downward move), May and Jun 2015 highs are. - Bearish scenario
If the commodity closes another day under the upper border of the blue rising trend channel and the above-mentioned long- and medium-term resistance lines, we’ll likely see a test of the barrier of $50. If it is broken, the next targets for oil bears would be: the blue rising support line based on the Nov lows (currently around $46.07), the 200-day moving average (at the moment of writing these words at $45), the green support zone created by the May, Sep and early Nov lows (around $42.20-$43) and the barrier of $40.
Summary
Although the OPEC cut deal mobilized oil bulls to act and pushed crude oil to the fresh 2016 high, the key resistance lines (the long-term red one marked on the weekly chart, the medium-term black line seen on the daily chart and all upper borders of rising trend channels seen in the case of the oil-to-gold, oil-to-silver and WTIC:UDN ratios) and the key resistance zones (marked on the monthly chart of crude oil, oil-to-gold ratio and the weekly chart of the oil-to-oil stocks ratio) continue to keep gains in check. Additionally, the current position of the daily indicators (not only in the case of crude oil, but also in the case of all our above-mentioned ratios) suggests that the space for gains may be limited as they increased to the levels seen in Oct. On top of that, in most cases there are also negative divergences, which increase the probability of reversal in near future. If this is the case, we’ll see lower prices of the black gold and a drop to one of our downside targets in the coming week(s).
Very short-term outlook: bearish
Short-term outlook: mixed with bearish bias
MT outlook: mixed
LT outlook: mixed
This completes this month’s Oil Investment Update. Our next Oil Investment Update is scheduled for Monday, Jan 9, 2017. Oil Trading Alerts subscribers will additionally receive similar but shorter alerts on a daily basis (or more than once a day when the situation requires it). You – Oil Investment Updates subscribers – will receive short Investment Alert messages should the outlook for the medium or long term change before the next Update is posted.
Thank you.
Nadia Simmons
Forex & Oil Trading Strategist
Oil Investment Updates
Oil Trading Alerts

