

Although the world's largest oil exporters failed to reach an agreement to freeze output once again, the price of crude oil extended gains and broke above the barrier of $50. This improvement was mostly supported by a weakening U.S. dollar, which dropped to its lowest levels since early May and supply disruptions around the world - Canadian wildfires, sabotage in Nigeria, and production declines in the United States. Thanks to the latter factor, the U.S. Energy Information Administration reported another decline in crude oil inventories, which affected positively investors’ sentiment and pushed the commodity to a fresh 2016 high of $51.62 on Wednesday. Nevertheless, the report also showed that U.S. crude oil output increased by 10,000 barrels per day to 8.745 million bpd last week, which ended a four-month streak of weekly declines. At this point it is also worth noting that the last week’s Baker Hughes report showed that the number of rigs drilling for oil in the U.S. increased by 9, which also ended a three-month streak of weekly declines. This news raised some speculation that domestic production could rebound in the coming weeks as U.S. shale producers could be ready to return as prices continue to remain around $50. If this is the case, oil bulls would lose a very important factor that supported the recent growths, which will likely translate into lower prices of the commodity. But will we see such price action in the coming weeks? Let’s jump right into charts (charts courtesy of http://stockcharts.com) and find out what can we infer from them about next oil market’s moves.
Crude Oil
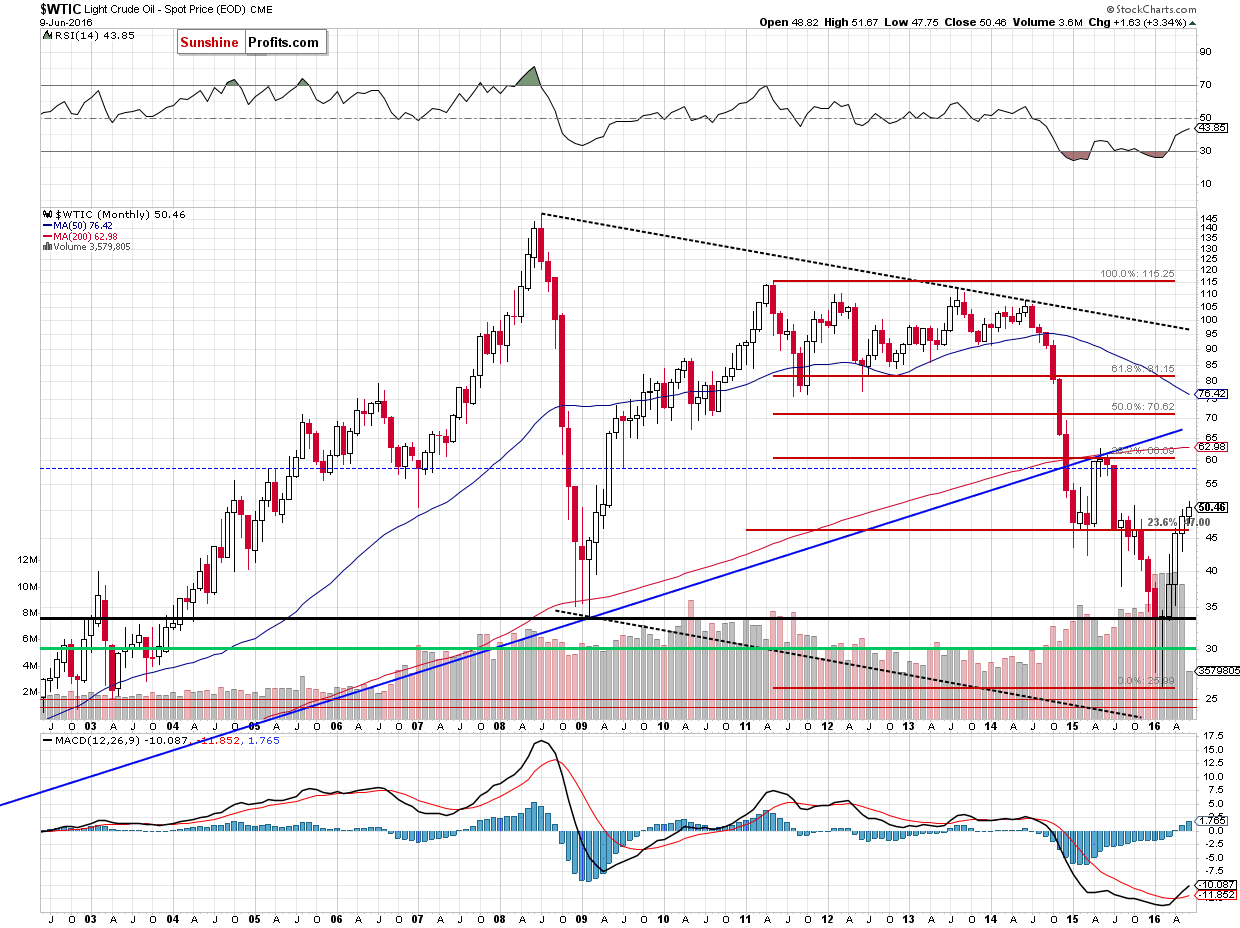
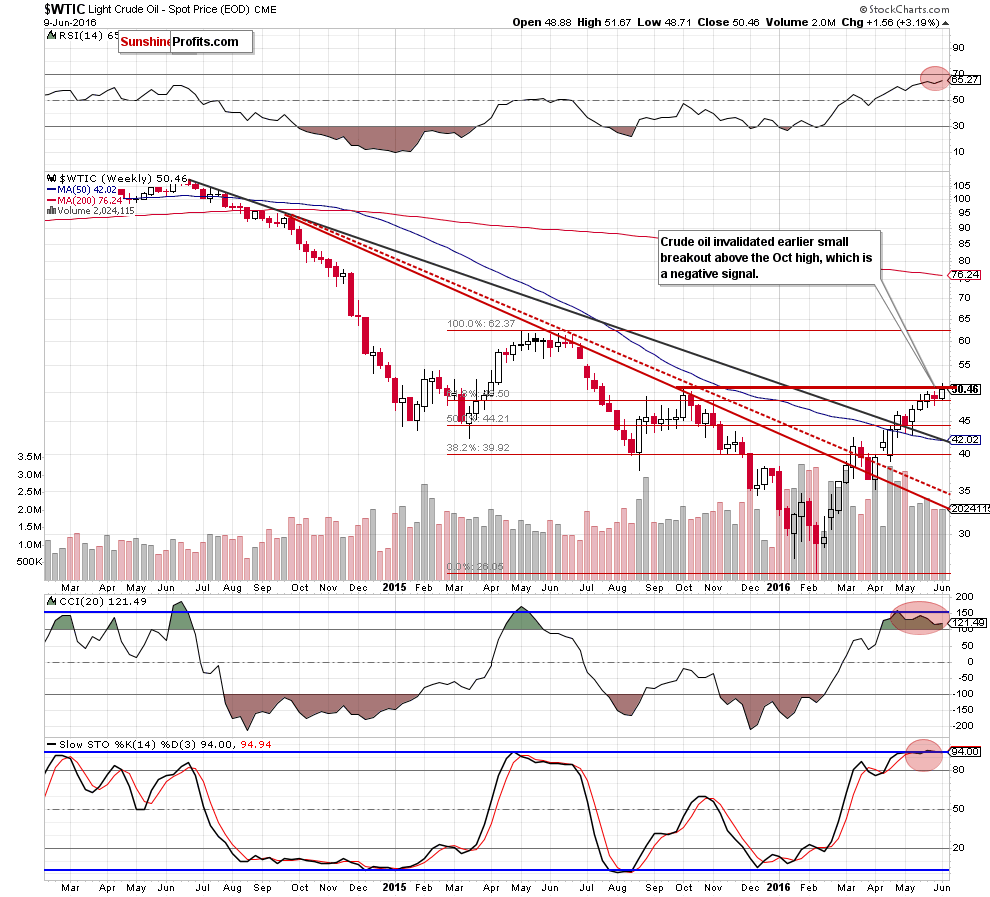
From the long- and medium-term perspective, we see that the commodity increased slightly above the Oct high, but then moved lower, invalidating earlier breakout, which is a negative signal that suggests further deterioration in the coming week. Nevertheless, it would be more reliable and bearish if crude oil closes this week below this resistance level.
How did this price action affect the very short-term picture? Let’s examine the daily chart and find out.
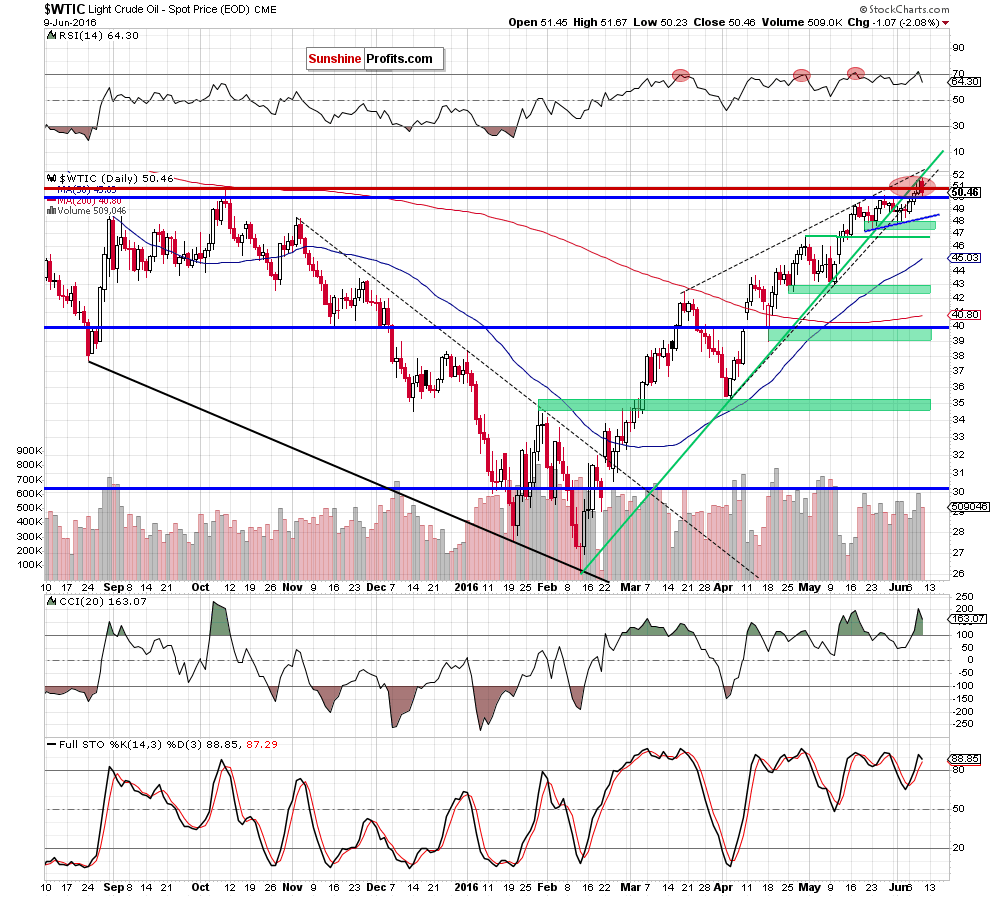
Looking at the daily chart, we see that crude oil broke above the barrier of $50 and increased to the previously-broken medium-term green line on Tuesday. As it turned out, this upswing was a verification of earlier breakdown below this line, which encouraged oil bears to act and resulted in a drop to slightly above the May 26 high of $50.21.
What’s next? In our opinion if this area withstands the selling pressure, light crude will likely rebound and test the 2016 high. However, if it is broken, we may see a drop to the blue support line based on the late May and Jun lows. At this point it is also worth keeping in mind that the RSI generated a sell signal, while the CCI and Stochastic Oscillator are overbought and close to doing the same (particularly the latter), which suggests that further deterioration in the coming days is very likely – especially if the commodity drops under the barrier of $50 and invalidates earlier breakout above it.
Summing up, crude oil reversed and declined, slipping to the May peak and verifying earlier breakdown under the previously-broken medium-term green line, which is a negative signal that suggests further deterioration (especially when we factor in a sell signal generated by the RSI) and a test of the support line based on the late May and Jun lows (currently around $48.50) in the coming days.
Having discussed the situation in crude oil, let’s examine the NYSE Arca Oil Index (XOI) to find out what the current outlook for oil stocks is.
Oil Stocks
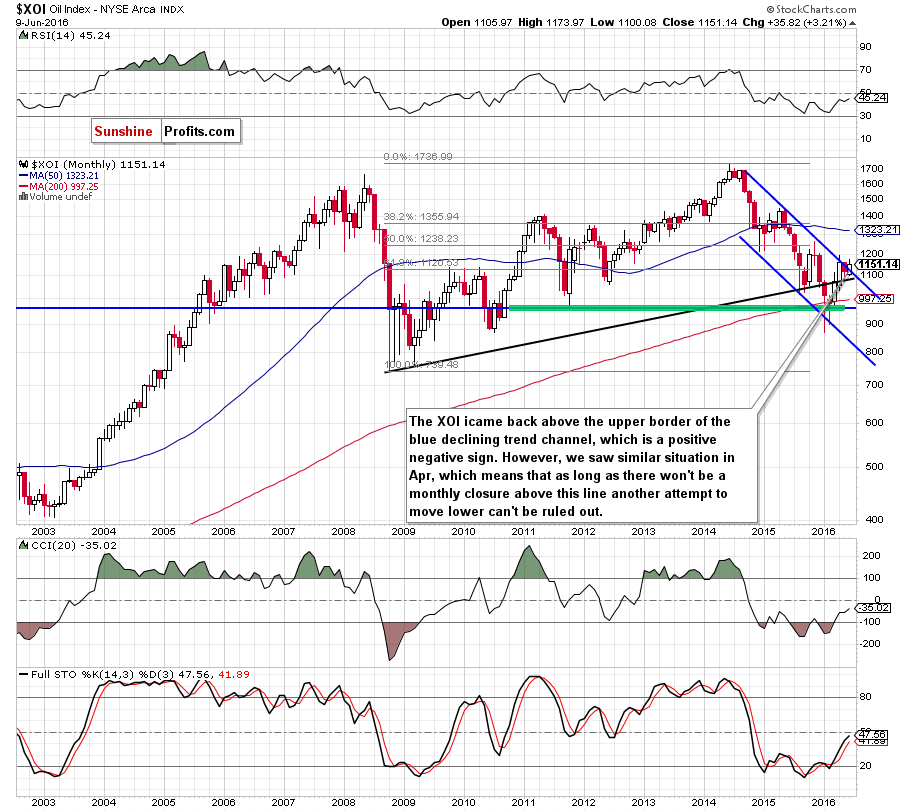
Looking at the monthly chart, we see that oil bulls push the XOI higher earlier this month, which resulted in an increase slightly above the upper border of the blue declining trend channel. Although this is a positive signal that suggests further improvement, we saw similar situation in Apr. Back then, oil bulls didn’t manage to hold gained levels, which resulted in a decline under this important resistance line. Therefore, in our opinion, as long as there won’t be monthly closure above it, another attempt to move lower can’t be ruled out.
Will the medium-term chart give us more clues about future moves? Let’s examine the weekly chart and find out what can we infer from it.
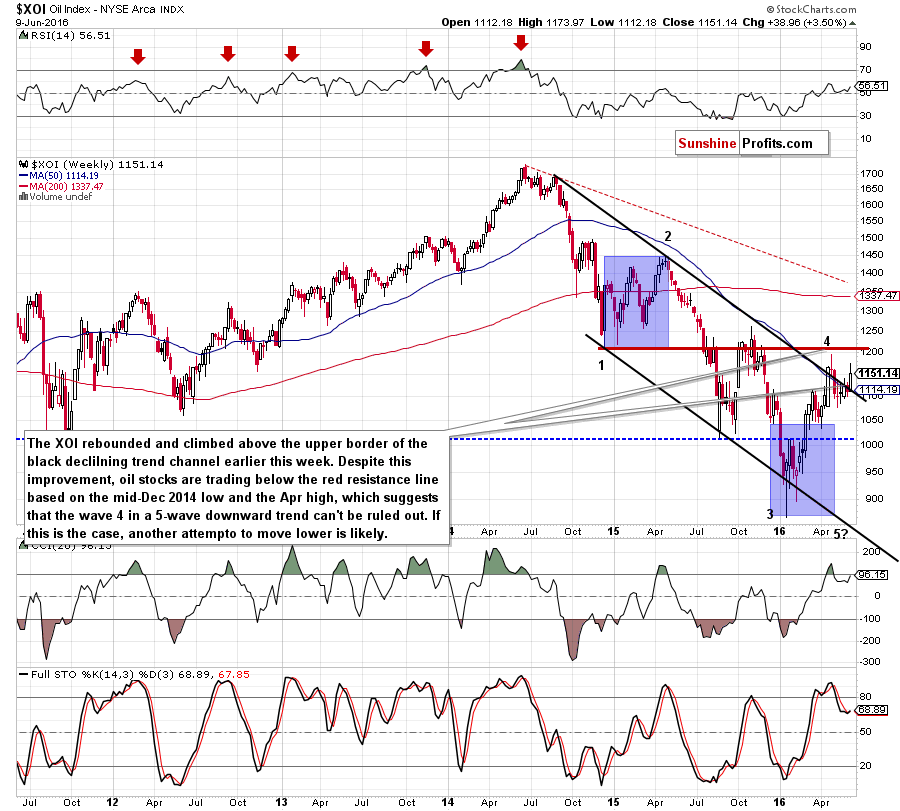
From this perspective, we see that the XOI rebounded and climbed above the upper border of the black declining trend channel earlier this week. Although this is a positive signal that suggests further improvement, oil stocks are still trading under the recent high of 1,994 and the red resistance line based on the mid-Dec 2014 low (the bottom of the potential first wave), which suggests that the 4 in a 5-waves downward trend (according to Elliot’s waves theory) may be still in play. If this is the case, another decline in the coming weeks should not surprise us – especially if the index comes back t the black trend channel.
Will the very short-term picture confirm a pro-bearish scenario? Let’s check the daily chart.
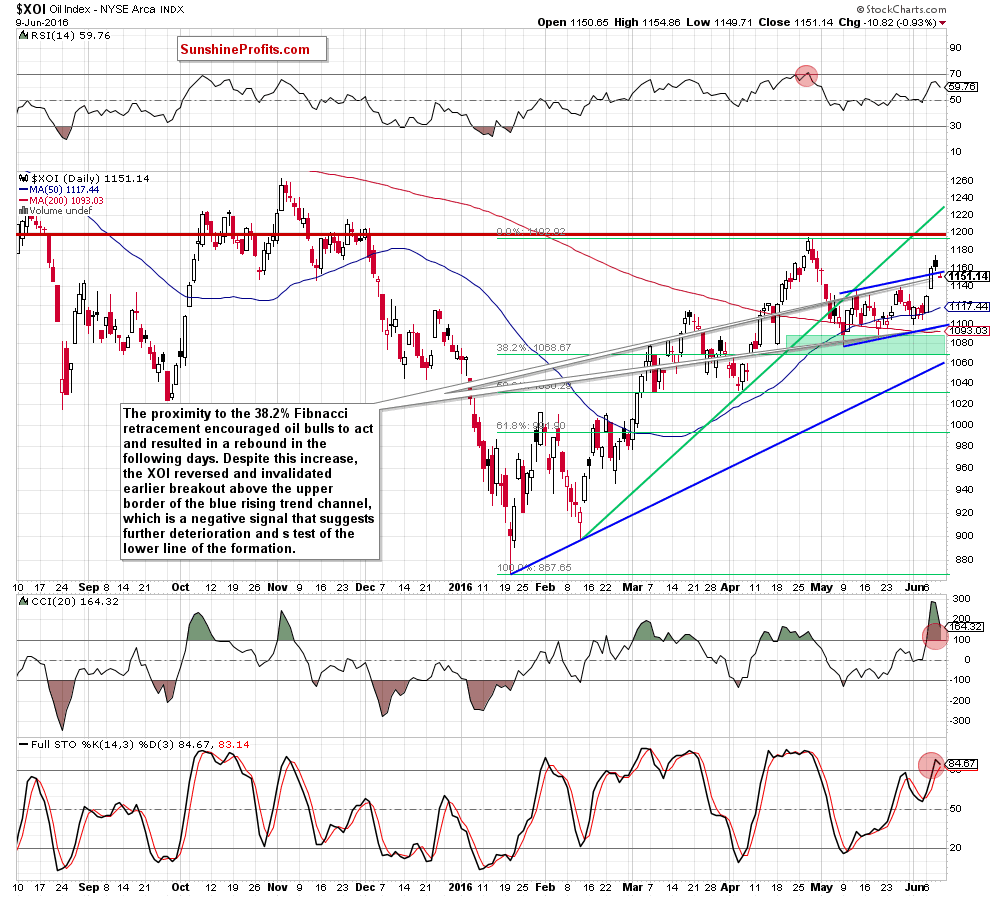
On the very short-term chart, we see that the 38.2% Fibonacci retracement level (based on the Jan-Apr rally) encouraged oil bulls to act, which triggered a rebound in recent month. With this upward move oil stocks erased almost 80% of earlier declines, hitting the Jun high of 1,173. Despite this move, the index reversed and declined, which resulted in invalidation of the breakout above the upper border of the blue rising trend channel. This is a negative signal, which suggests further deterioration and a test of the lower line of the formation (currently around 1,100) in the coming week(s). It’s also worth noting that this scenario is also supported by the current position of the indicators (the CCI and Stochastic Oscillator are overbought and close to generating sell signals).
Summing up, although oil stocks rebounded in recent weeks, that still remain under the Apr high, the previously-broken medium-term resistance green line. Additionally, the XOI invalidated earlier breakout above the upper border of the short-term rising trend channel, which suggests further deterioration and a test of the level of 1,100 in the coming week(s).
Ratio Analysis
Once we know the current situation in crude oil and oil stocks, let’s focus on the relationship between them. What can we infer from the chart below?
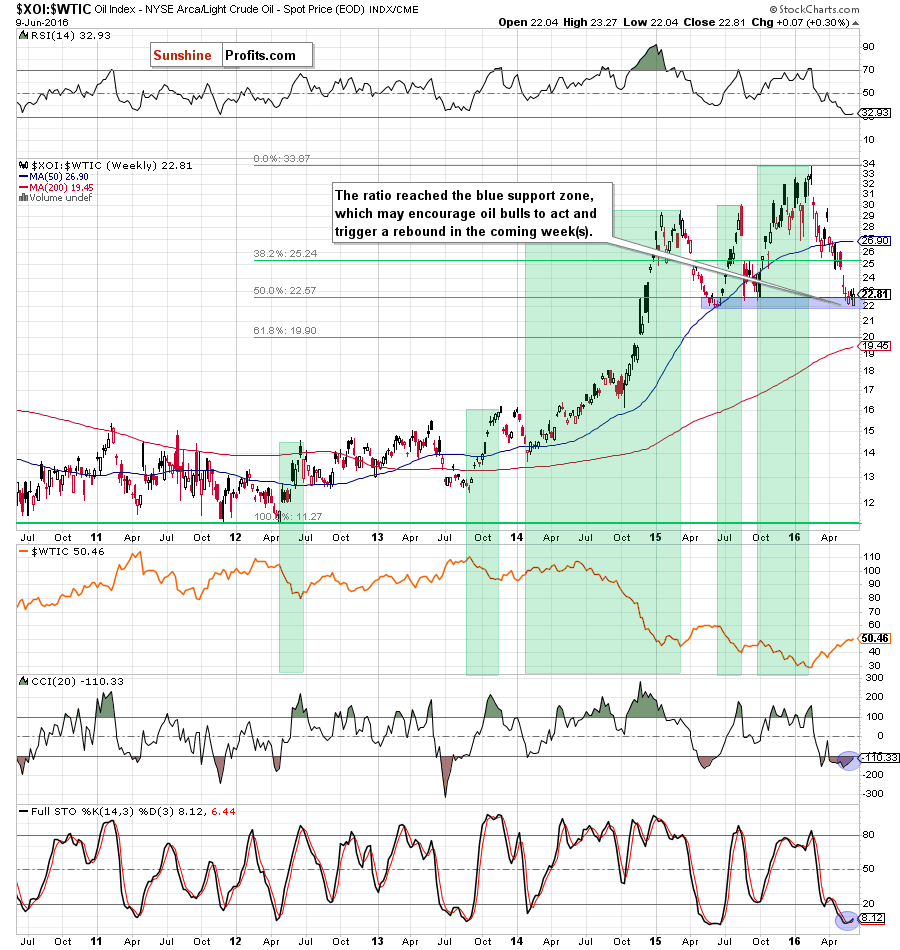
Looking at the above chart, we see that the oil stocks-to-oil ratio declined in recent weeks, reaching the blue support zone (created by the Jun, Aug and Sep 2015 lows and the 50% Fibonacci retracement). As you see on the chart, in Aug and Sep 2015 this area was strong enough to stop further declines, which resulted in a rally, which took the ratio to the 2016 highs. Taking this fact into account and combining it with the current position of the indicators (the RSI approached the barrier of 30, while the Stochastic Oscillator generated a buy signal and the CCI is very close to doing the same), we think that another upward move is just around the corner.
How such price action could affect crude oil? As you see on the above chart, there has been a strong negative correlation between the ratio and the price of the commodity in the previous years. Most of upwards moves in the ratio have corresponded to declines in light crude, which suggests that another rebound in the XOI:WTIC ratio will translate into lower values of the commodity in the coming weeks.
Will the gold-to-oil ratio confirm this scenario? Let’s check the chart below and find out.
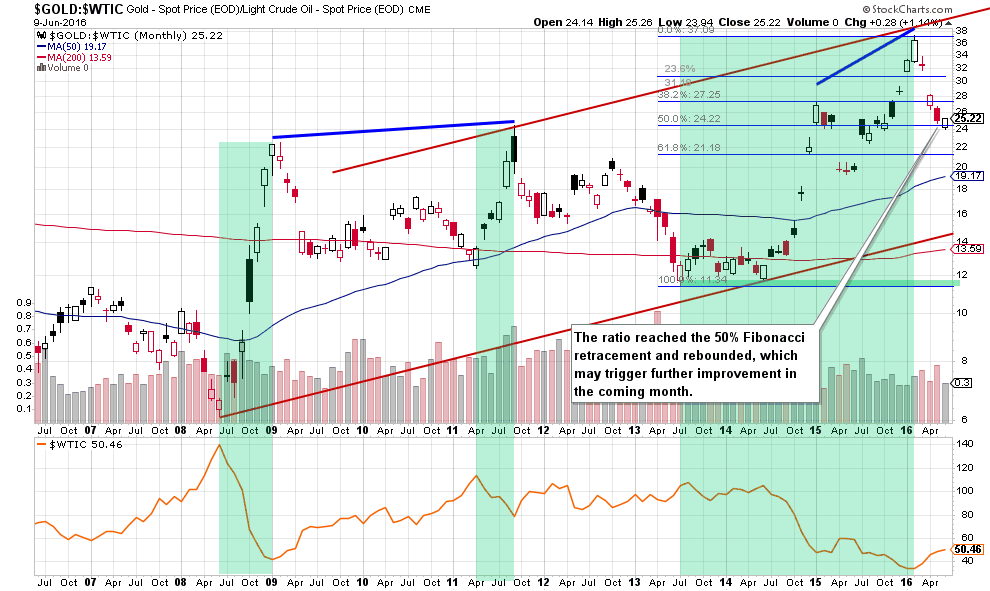
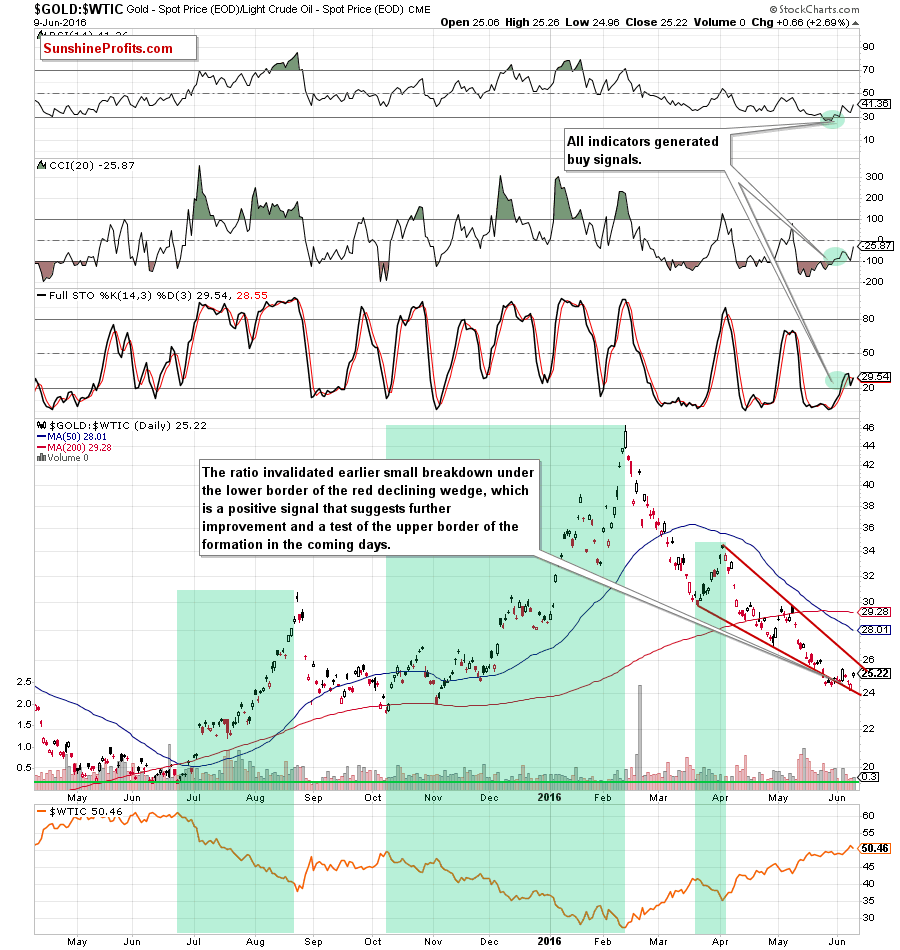
Looking at the relationship between gold and crude oil we see that the gold-to-oil ratio reached the 50% Fibonacci retracement (based on the entire Jul 2013-Feb 2016 upward move), which triggered a rebound (seen on the monthly chart). With this move, the ratio invalidated earlier small breakdown under the lower border of the red declining wedge (seen on the daily chart), which is a positive signal that suggests further improvement – especially when we factor in buy signals generated by all daily indicators.
What does it mean for crude oil? As you see on the above charts, may times in the past higher values of the ratio have corresponded to lower prices of light crude. We have seen this strong negative correlation in the second half of Jun 2008, between Apr and Sep 2011 and also between Jul 2013 and Feb 2016 (we marked all these periods with green), which suggests that another (smaller or bigger) rebound of the ratio will translate into lower values of crude oil in the coming days or even weeks. Therefore, in our opinion, it’s worth to keep an eye on the above charts to receive confirmation of the reversal.
Non-USD Crude Oil Price
Before we move to our last chart, let’s move on to the non-USD (WTIC:UDN ratio) chart of crude oil. As a reminder, UDN is the symbol for the PowerShares DB US Dollar Index Bearish Fund, which moves in the exact opposite direction to the USD Index. Since the USD Index is a weighted average of the dollar's exchange rates with world's most important currencies, the WTIC:UDN ratio displays the value of crude oil priced in "other currencies".
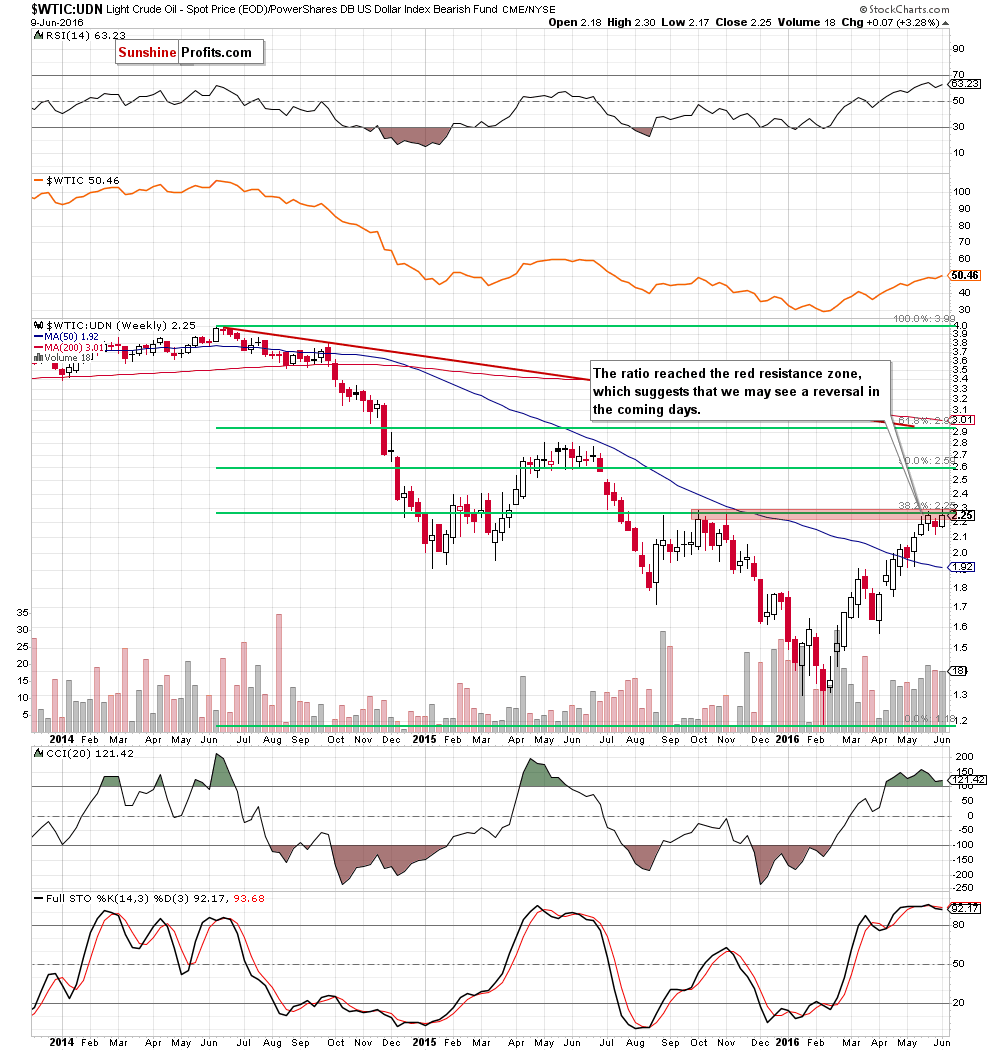
Looking at the weekly chart, we see that the ratio reached the red resistance zone (created by the Oct and Nov highs and the 38.2% Fibonacci retracement based on the entire Jun 2014-Feb 2016 downward move), which may stop oil bulls and trigger a pullback in the coming week(s). Taking this fact into account and the current position of the indicators (the Stochastic Oscillator generated a sell signal, while the CCI is close to doing the same), we think that reversal and further deterioration is just around the corner. If this is the case, and the ratio extends declines from here, well also see lower prices of crude oil in the following week(s).
Finishing today’s Oil Investment Update, we would like to draw your attention to the current picture of the USD Index as the greenback is one of major factors that affect the price of the commodity.
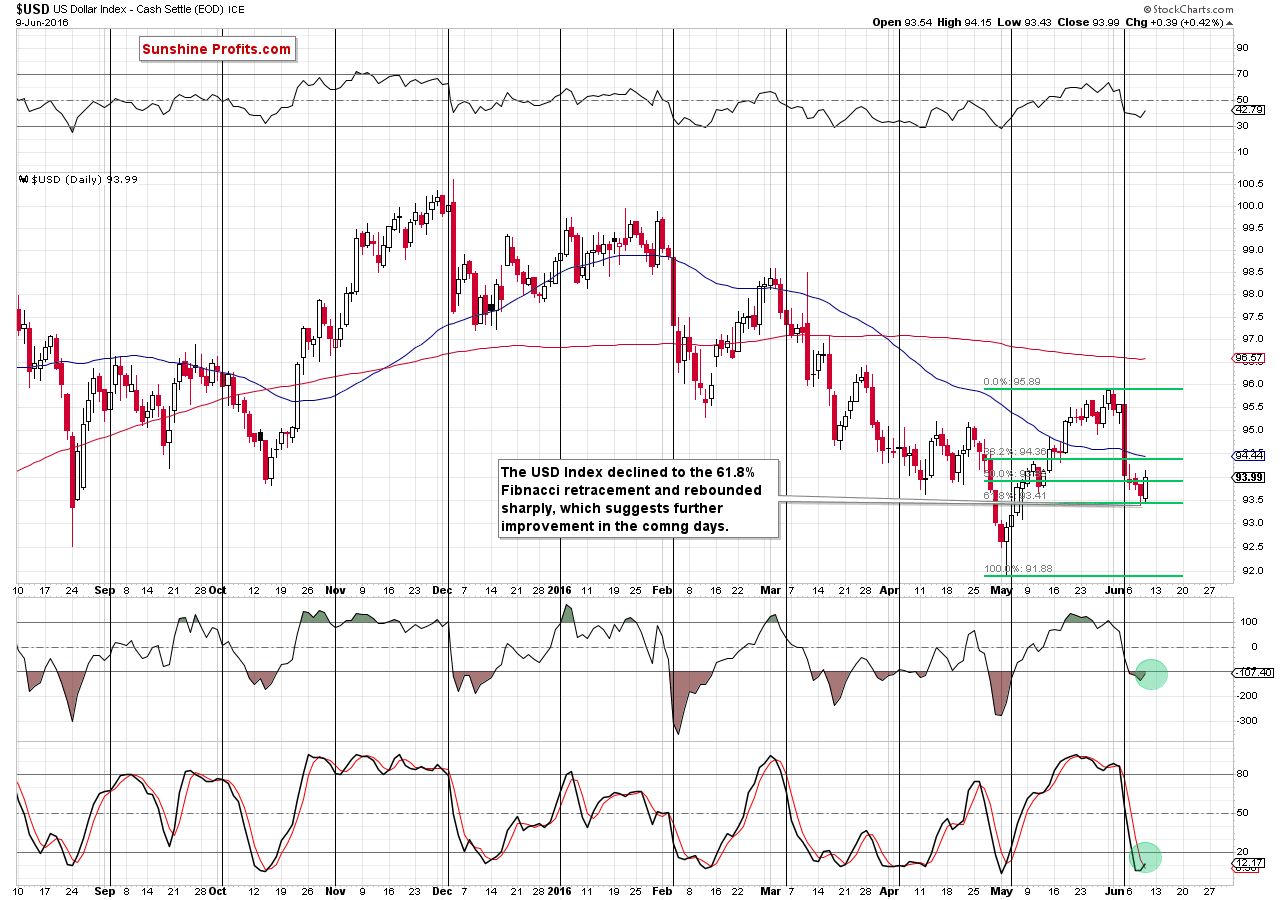
From the short-term perspective, we see that the USD Index extended losses and slipped to the 61.8% Fibonacci retracement (based on the May upward move), which triggered a sharp rebound yesterday. This is a bullish signal, which in combination with the current position of the daily indicators (the Stochastic Oscillator generated a buy signal, and the CCI is very close to doing the same) suggests further improvement. If this is the case and the greenback extends gains in the coming weeks, the price of crude oil will likely move lower as a stronger U.S. dollar usually makes the commodity less attractive for buyers holding other currencies.
Scenarios
Just like a month ago, today’s Oil Investment Update includes scenarios of what could happen in the coming weeks. Naturally, we will continue to monitor the market in the coming days and if anything invalidates our long-term outlook we will send you an additional message.
- Bullish scenario
If crude oil breaks above the Wednesday’s high of $51.62 and the medium-term green resistance line (based on the Feb and Apr lows), we’ll see further improvement and increase to around $53.95-$54.76, where the next resistance zone (created by the 76.4% and 78.6% Fibonacci retracement levels based on the May 2015 – Feb 2016 downward move) is. If this area is broken, oil bulls could push the commodity even to around $60-$62.58, where the 38.2% Fibonacci retracement (based on the entire 2011-2016 downward move), May and Jun 2015 highs are. - Bearish scenario
If the commodity extends declines from current levels, the first downside target would be the blue support line based on the late May and Jun lows (currently around $48.50) and the green support zone created by the late-May and Jun lows (around $47.40-$47.75). If it is broken, the next downside target would be the green support zone (marked on the daily chart) around $42.50-$43 or even the barrier of $40.
Summary
The last few weeks have brought further increases in oil prices, which resulted in a breakout not only above the barrier of $ 50, but also in a climb slightly above the Oct high. Despite this improvement, oil bulls didn’t manage to hold gained levels, which resulted in invalidation of earlier small breakout above this peak, verification of the breakdown below the medium-term green resistance line (marked on the daily chart) and a drop to the previously-broken May high. Additionally, the oil stocks-to-oil and the gold-to-oil ratios declined to important support areas, which suggest reversal and rebound in the coming week(s). Taking into account strong negative correlation between these ratios and the price of the commodity, we think that increases in the ratios will translate into lower values of crude oil. This scenario is also reinforced by the non-USD (WTIC:UDN ratio) chart of crude oil, the current position of the daily and weekly indicators (not only in the case of light crude, but also in the case of all the above-mentioned ratios) and the current situation in the USD Index. Therefore, if crude oil closes this week under the barrier of $50, we’ll see further deterioration and a realization of the bearish scenario in the coming weeks.
Very short-term outlook: mixed with bearish bias
Short-term outlook: mixed with bearish bias
MT outlook: mixed
LT outlook: mixed
Trading position (our opinion): No positions are justified from the risk/reward perspective.
This completes this month’s Oil Investment Update. Our next Oil Investment Update is scheduled for Friday, Jul 8, 2016. Oil Trading Alerts subscribers will additionally receive similar but shorter alerts on a daily basis (or more than once a day when the situation requires it). You – Oil Investment Updates subscribers – will receive short Investment Alert messages should the outlook for the medium or long term change before the next Update is posted.
Thank you.
Nadia Simmons
Forex & Oil Trading Strategist
Oil Investment Updates
Oil Trading Alerts

