

The most important fundamental factor, which supported the price of crude oil in the previous month, was the deal between Saudi Arabia, Russia, Qatar and Venezuela to freeze oil output at Jan (near-record) levels. This first significant cooperation between OPEC and non-OPEC producers in 15 years resulted in an invalidation of the breakdown under the barrier of $30. Another sharp increase came after the International Energy Agency predicted in its report that U.S. crude production will continue to decline as prices remain around record-lows. Yesterday, the U.S. Energy Information Administration reported that production dropped by 25,000 to 9.077 barrels per day (for the first time this year under 9.1 million bpd), which ecouraged some investors to buy the commodity – especially after news that supply from OPEC declined by 280,000 barrels per day last month. Another supportive factor was Friday’s Baker Hughes report, which showed that the number of rigs drilling for oil in the U.S. dropped by 13 in the previous week, which was the tenth straight weekly decline. Despit these declines, yesterday, the EIA reported that crude oil inventories increased by 10.4 million barrels in the week ended February 26, reaching a fresh all-time high. Although the report also showed that gasoline inventories decreased by 1.5 million barrels, distillate stockpiles increased by 2.9 million barrels. On top of that, supplies at Cushing, Oklahoma rose by 1.2 million barrels last week, approaching the nation's largest storage facility full capacity. Taking all the above into account, it seems to us that as long as there are no signnificant output cuts lower prices of crude oil are very likely. Will the technical picture of the oil market comfirm this assumption? Let’s jump right into charts (chart courtesy of http://stockcharts.com) and find out.
Crude Oil
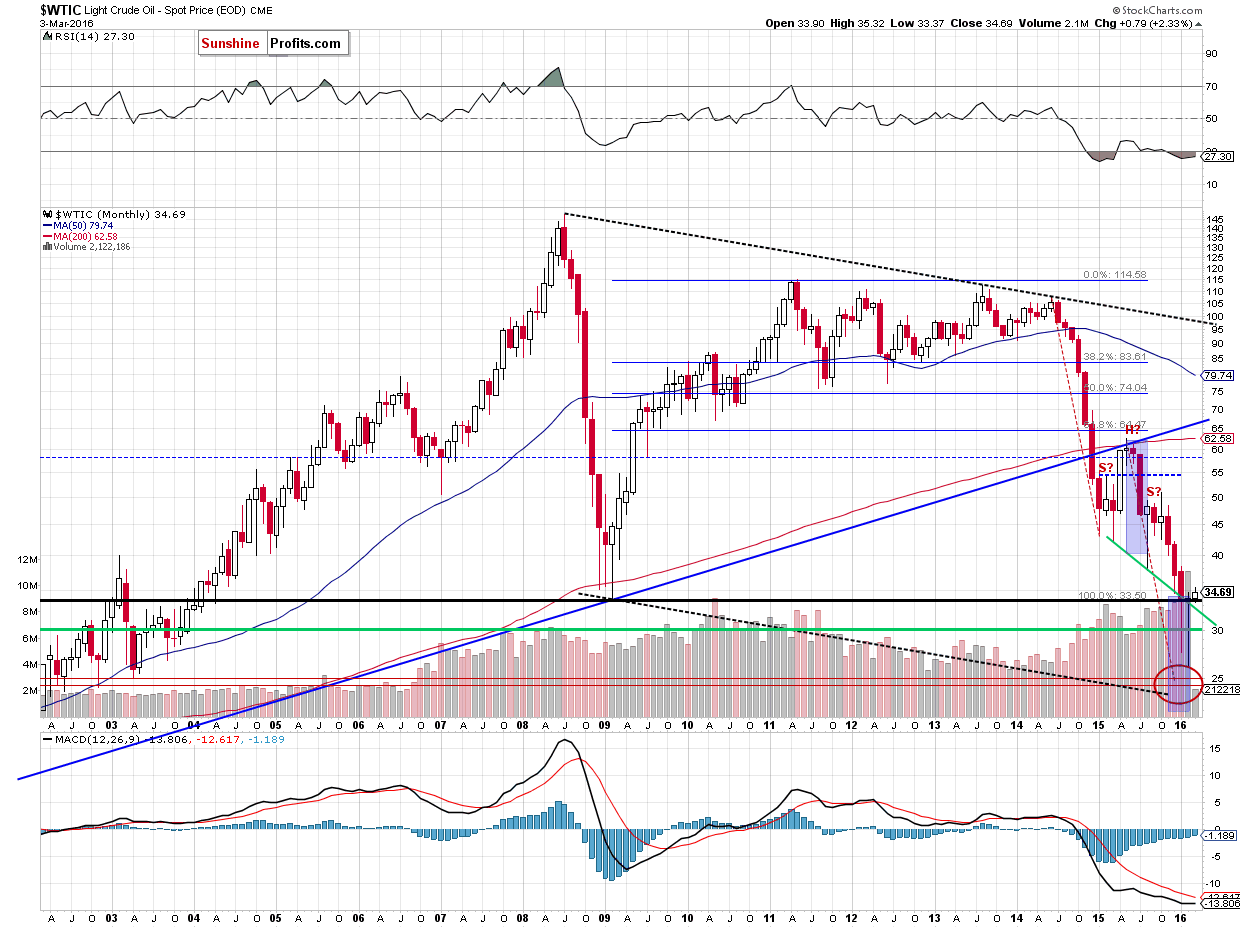
The first thing that catches the eye on the long-term chart is an invalidation of the breakdown under the 2009 low and the neck line of the head and shoulders formation, which is a bullish signal that suggests further improvement later in the month.
But will we see such price action in the coming weeks? Let’s examine the medium-term chart and look for more clues about future moves.
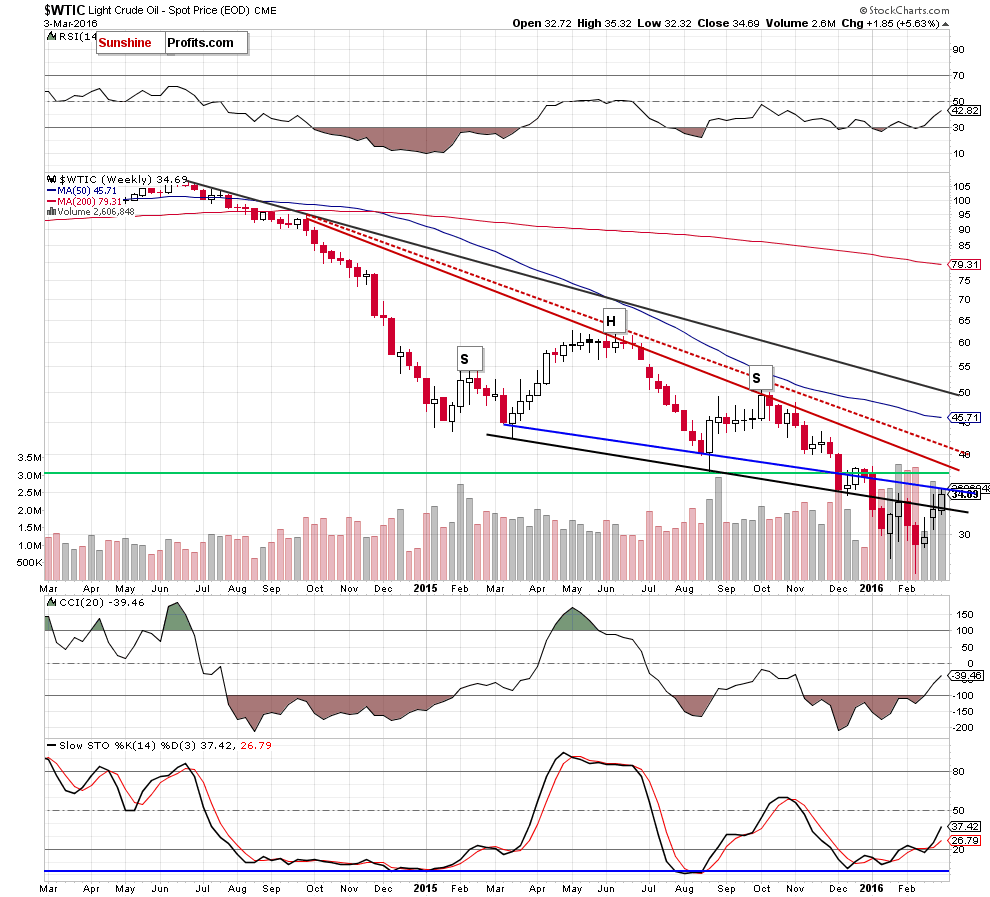
From this perspective, we see that crude oil invalidated earlier breakdown under the neck line of the head and shoulders formation (the black line), which looks like a bullish signal that could trigger further improvement. Nevertheless, we should keep in mind that the week is not over yet and we could see a reversal – similarly to what we saw earlier this year. Additionally, when we take a closer look at the chart, we notice that the commodity is still trading under the blue resistance line based on the Mar 9, 2015 and Aug 17 weekly closing prices, which could encourage oil bears to act.
Are there any other factors that could trigger a pro bearish scenario? Let’s take a look at the daily chart and find out.
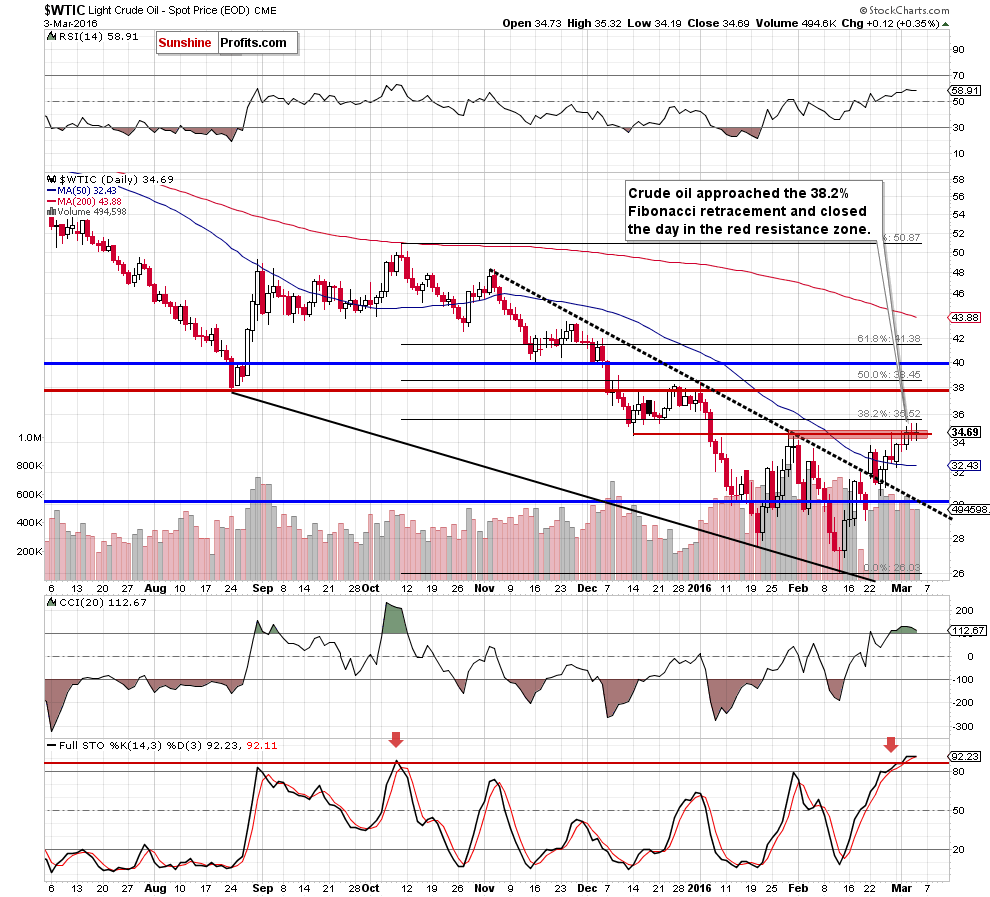
On the daily chart, we see that crude oil extended gains and broke above the red resistance zone (created by the Jan high and the Dec low) yesterday. Despite this increase, Wednesday’s improvement was temporary and light crude gave up some gains, closing the day in the support/resistance zone. What’s next? Although yesterday’s move looks positive, we should keep in mind that not far from current levels is the 38.2% Fibonacci retracement, which in combination with the current position of the CCI and Stochastic Oscillator (they are overbought – similarly to what we saw at the beginning of Oct) could encourage currency bears to act - especially when we factor in negative fundamental numbers released in yesterday’s EIA report.
Summing up, although crude oil climbed above the Jan high, the commodity remains under the 38.2% Fibonacci retracement and the medium- term blue resistance line (based on weekly closing prices). Additionally, the current position of the CCI and Stochastic Oscillator suggests that reversal and lower values of the commodity are just around the corner. Therefore, we believe that short positions are justified from the risk/reward perspective.
Having discussed the situation in crude oil, let’s examine the NYSE Arca Oil Index (XOI) to find out what the current outlook for oil stocks is.
Oil Stocks
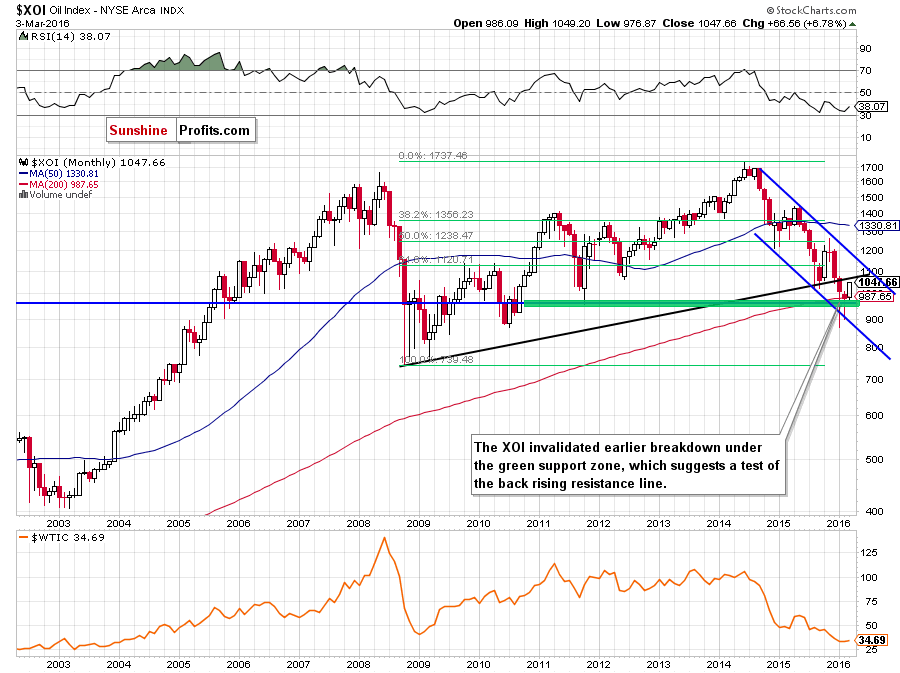
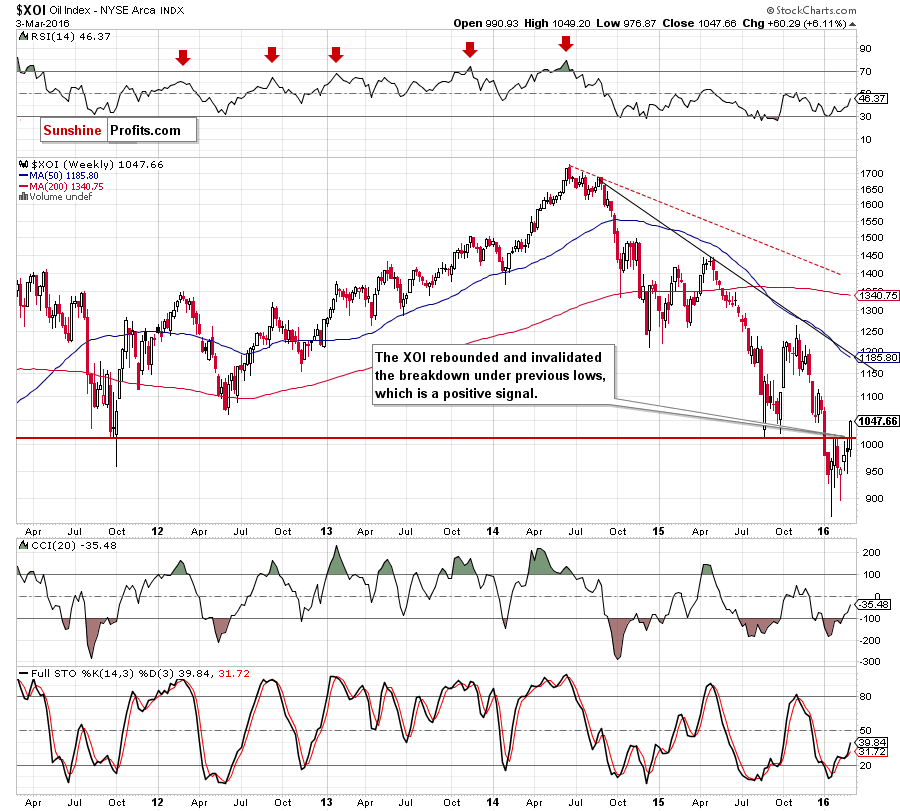
Looking at the charts from the long- and medium-term perspective, we see that the XOI invalidated earlier breakdown under the previous lows and the 200- month moving average, which suggests further improvement and an increase to the previously-broken black resistance line (marked on the monthly chart) around 1,070.
Having said the above, let’s examine the daily chart and find out what can we infer from it.
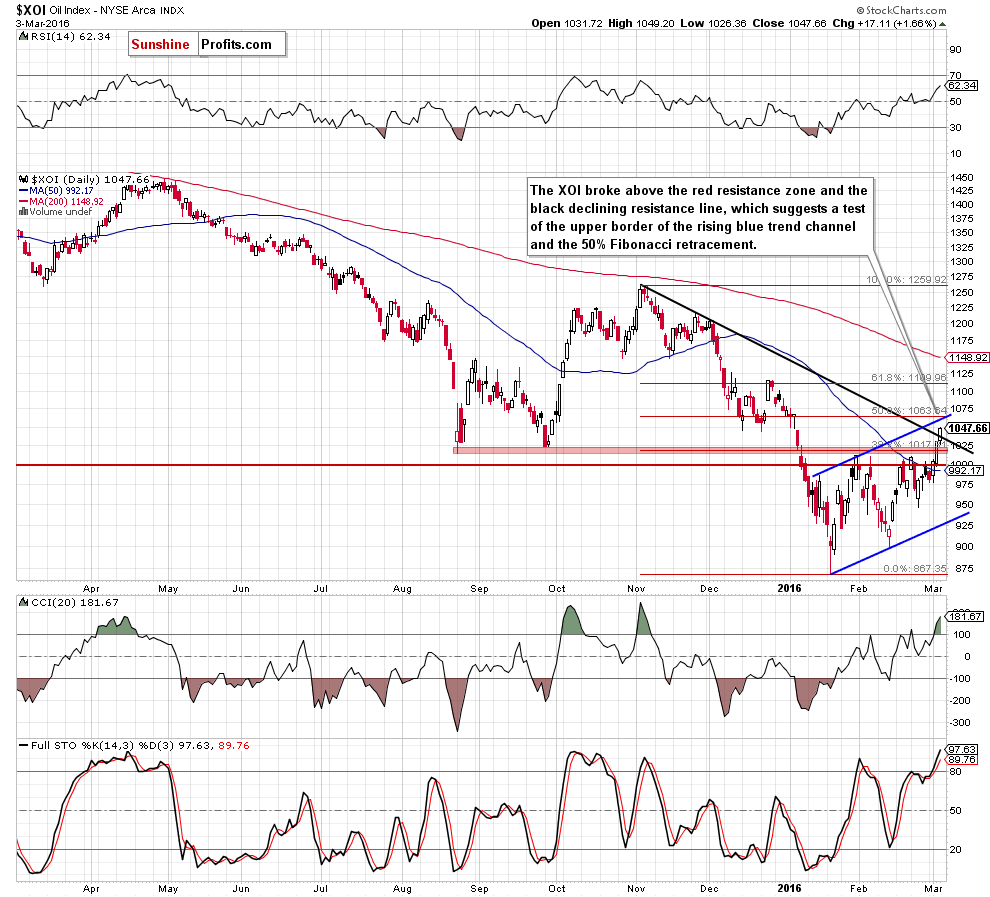
On the very short-term chart, we see that oil stocks rebounded and increased above the red resistance zone created by the previous lows, the 50-day moving average and the barrier of 1,000. As you see, this positive signal encouraged oil bulls to act, which resulted in a climb above the black resistance line based on the Nov and Dec highs. What’s next? Taking all the above into account, we think that the XOI will test the upper border of the blue rising trend channel and the 50% Fibonacci retracement in the coming days. Nevertheless, we should keep in mind that the CCI and Stochastic Oscillator are overbought, which suggests that reversal is just around the corner. If this is the case, and oil stocks move lower, we’ll likely see a test of the barrier of 1,000 in the coming days.
Summing up, oil stocks invalidated breakdown under the previous lows, the 50-day moving average and the barrier of 1,000, which suggests further improvement and a test of the next resistance zone created by the upper border of the blue rising trend channel (marked on the daily chart) and the 50% Fibonacci retracement. Nevertheless, the current position of the daily indicators suggests that reversal and lower values of oil stocks are just around the corner.
Ratio Analysis
Today, we start this section by focusing on the oil-to-oil stocks ratio. What can we infer from the chart below?
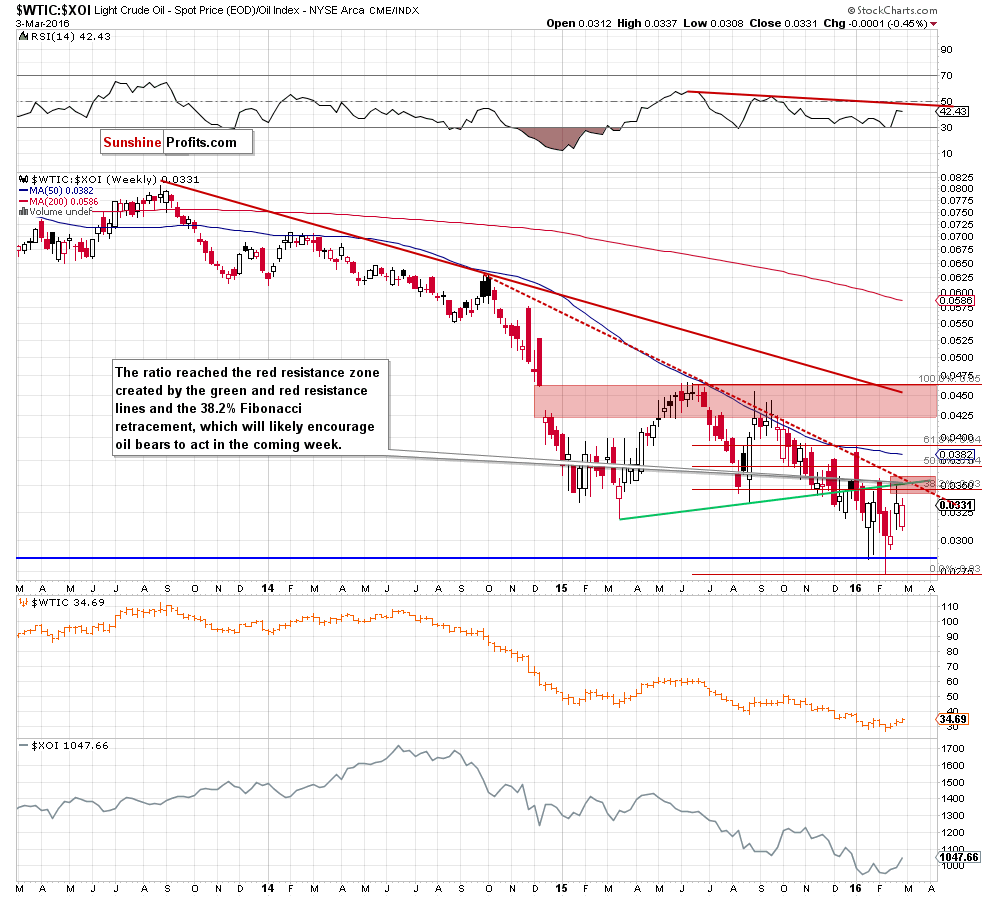
From this perspective, we see that the ratio bounced of the Feb low and increased to the red resistance zone created by the green and red resistance lines and the 38.2% Fibonacci retracement. As you see on the chart, the green resistance line stopped further improvement in Jan and also in Feb. Nevertheless, from today’s point of view, much more important is the red dashed line (based on Oct 6 and Sep 21 opening prices), which successfully stopped oil bulls many times in the previous months. At this point it is also worth noting there was no weekly closure above this line, which suggests that the space for further gains is limited. If this is the case and the ratio declines from here, we’ll see another downward move in crude oil – similarly to the price action that we saw in previous months.
Having said the above, let’s analyze the oil-to-gold ratio.
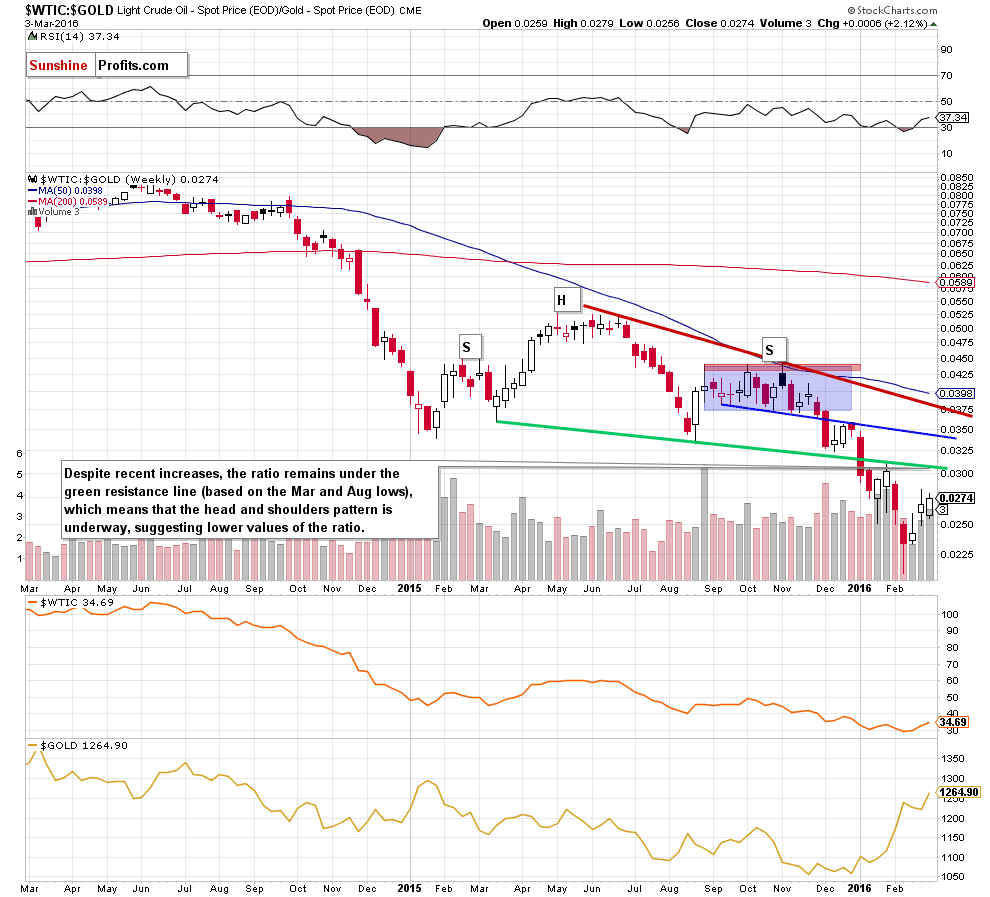
On the weekly chart, we see that although the ratio rebounded in recent weeks, the neck line of the head and shoulders formation continues to keep gains in check. Therefore, in our opinion, as long as there is no invalidation of the breakout above this line, all upswings would be nothing more than verifications of earlier breakdown.
Are there any other factors that could encourage oil bears to act? Let’s examine the daily chart and find out.
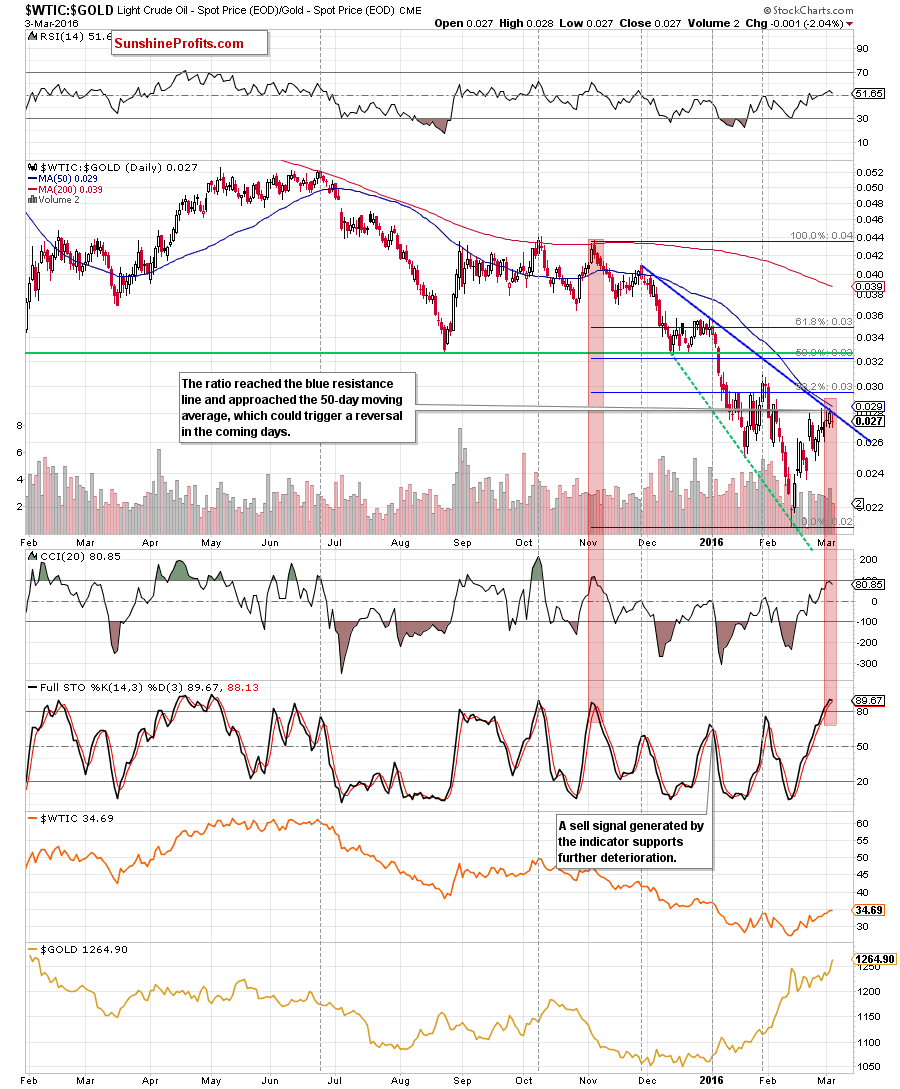
Looking at the daily chart, we see that the ratio reached the blue resistance line based on the Nov and Jan highs and approached the 50-day moving average, which could trigger a reversal in the coming days. Additionally, when we take a closer look at the chart, we notice that the CCI and Stochastic Oscillator are overbought, which increases the probability of the reversal in near future. At this point it is worth noting that both indicators increased to the levels not seen since Nov. Back then, such high readings encouraged oil bears to act, which translated into lower values of the ratio and crude oil. Therefore, if we see a reversal from here, another downward move will be more likely – similarly to what we saw in previous months.
Finishing this section, we would like to take a closer look at the relationship between crude oil and the general stock market.
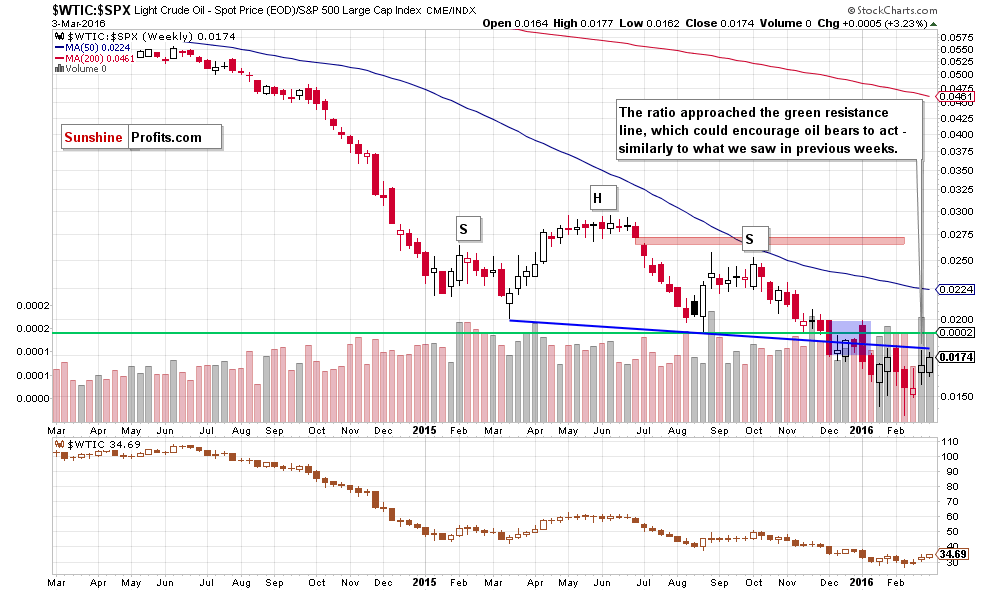
On the weekly chart, we see that although the ratio increased once again earlier this week, the head and shoulders pattern remains in place, suggesting lower values of the ratio in near future. Therefore, the bearish implications also remain in place – it seems that we will see lower values of crude oil before the decline is completely over.
Know the situation for the above ratios let’s move on to the inverse crude oil ETN – DWTI.
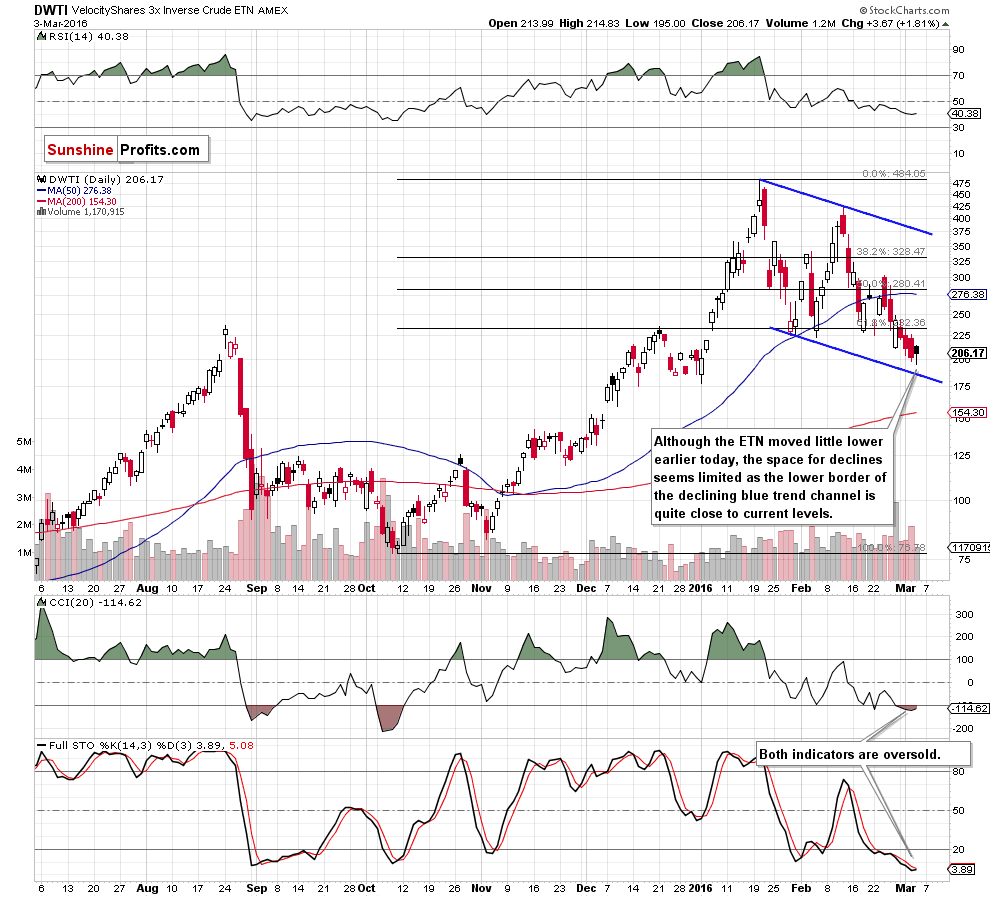
From this perspective, we see that the ETN moved lower once again earlier today. Despite this drop, the space for declines seems limited as the lower border of the blue declining trend channel is quite close to current levels.
Nevertheless, to have a more picture, let’s take a look at the weekly chart below.
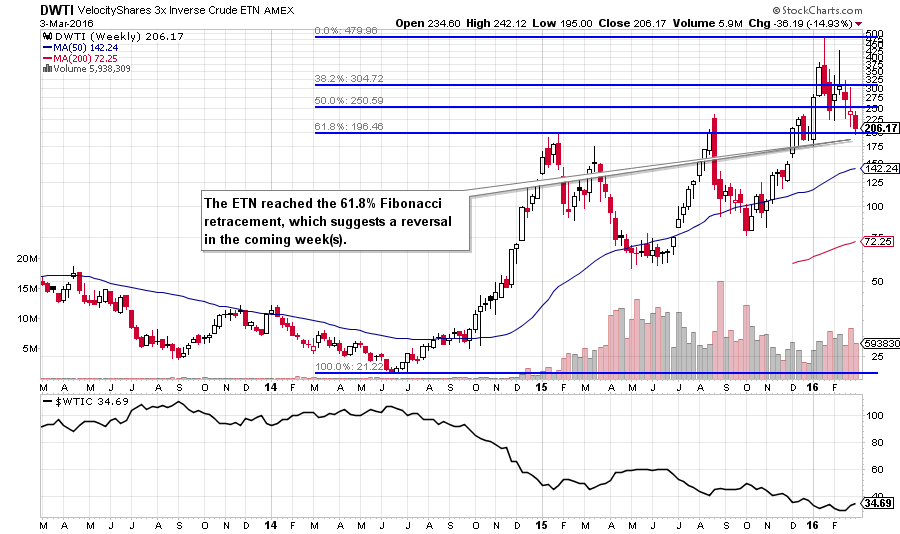
As you see on the medium-term chart, the ETN declined to the 61.8% Fibonacci retracement, which suggests that a reversal from here in the coming week(s) is very likely. If this is the case, such price action will translate into another downswing in light crude.
Finishing today’s Oil Trading Alert, we decided to analyze the current picture of the United States Oil Fund, LP (USO).
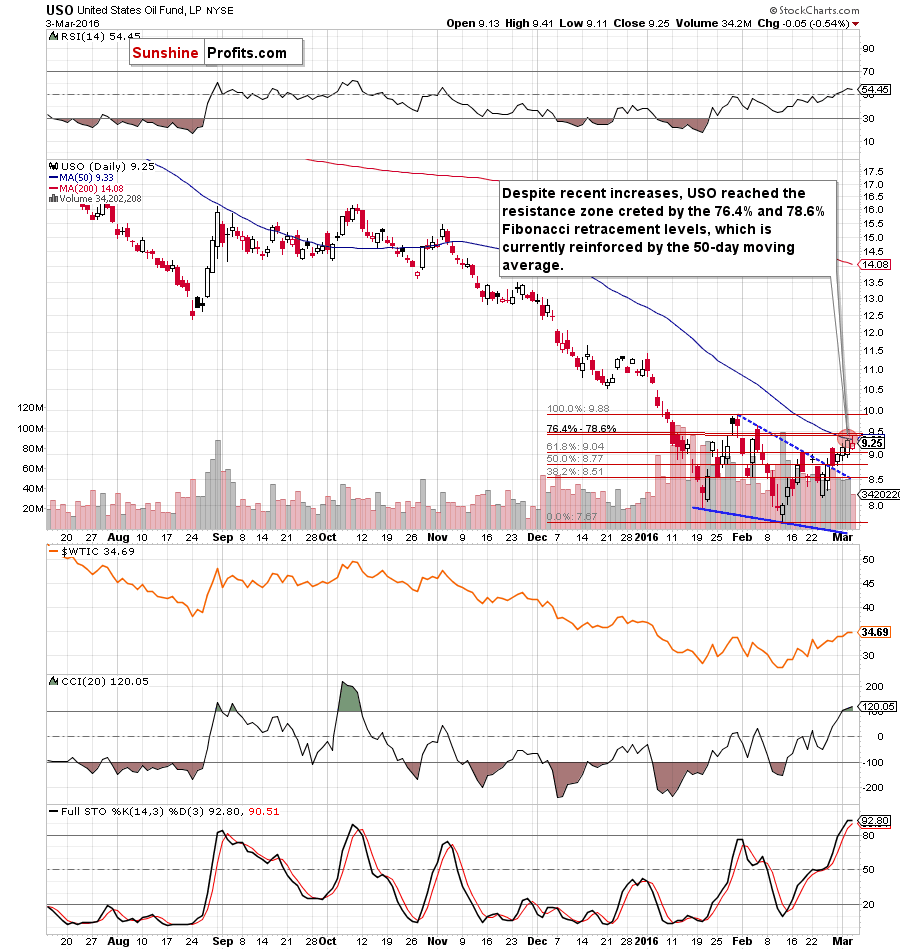
On the daily chart, we see that recent declines took USO to the resistance zone created by the 76.4% and 78.6% Fibonacci retracemen levels , which is currently reinforced by the 50-day moving average. Additionally, the CCI and Stochastic Oscillator are overbought, whch increases the probability of reversal from here in the coming days.
Scenarios
Just like a month ago, today’s Oil Investment Update includes scenarios of what could happen in the coming weeks. Naturally, we will continue to monitor the market in the coming days and if anything invalidates our long-term outlook we will send you an additional message.
- Bullish scenario
If crude oil increases from the current levels, breaking above the blue resistance line (marked on the weekly chart) and the 38.2% Fibonacci retracement (seen on the daily chart), we’ll see an upward move to the first resistance zone created by the Aug low and the Jan high ($37.75-38.39). If it is broken, the next target for oil bulls would be the barrier of $40 or even the late Nov highs of $43.30-$43.36. - Bearish scenario
If the commodity reverses and declines from here, the initial downside target would be the barrier of $30. If it is broken, the next downside target would be the Feb 19 low of $29.05, the support area created by the 76.4% and 78.6% Fibonacci retracement levels based on the Feb-Mar rally (around $28.03-$28.24) or even the Feb low of $26.05.
Summary
In recent weeks crude oil bounced off the multi-year low of $26.05 and approached the resistance zone created by the 38.2% Fibonacci retracement (based on the Oct-Feb declines) and the black resistance line based on the Mar 9, 2015 and Aug 17 weekly closing prices. At the same time, the oil-to-gold and oil-to-stocks ratios approached the neck lines of the head and shoulders formations, while the oil-to-oil stocks ratio climbed to the solid resistance zone. What’s interesting, there are negative divergences between the ratios and the commodity, which increases the probability that reversal is just around the corner – especially when we factor in the current position of the daily indicators, which increased to the highest levels since Oct. All the above doesn’t bode well for crude oil, suggesting (at least) a test of the barrier of $30. Nevertheless, consequently, the $25 level is our next target level for crude oil.
Very short-term outlook: bearish
Short-term outlook: bearish
MT outlook: bearish
LT outlook: mixed with bearish bias
Trading position (short-term; our opinion): Short positions (with a stop-loss order at $35.63 and the price target at $25.63) are justified from the risk/reward perspective. The analogous levels for USO ETF and DWTI ETN are:
- USO initial target price: $6.67; USO stop-loss: $10.25
- DWTI initial target price: $513.31; DWTI stop-loss: $165.84
We will keep you – our subscribers – informed should anything change.
As a reminder – “initial target price” means exactly that – an “initial” one, it’s not a price level at which we suggest closing positions. If this becomes the case (like it did in the previous trade) we will refer to these levels as levels of exit orders (exactly as we’ve done previously). Stop-loss levels, however, are naturally not “initial”, but something that, in our opinion, might be entered as an order.
Since it is impossible to synchronize target prices and stop-loss levels for all the ETFs and ETNs with the main market that we provide this level for (crude oil), the stop-loss level and target price for popular ETN and ETF (among other: USO, DWTI, UWTI) are provided as supplementary, and not as “final”. This means that if a stop-loss or a target level is reached for any of the “additional instruments” (DWTI for instance), but not for the “main instrument” (crude oil in this case), we will view positions in both crude oil and DWTI as still open and the stop-loss for DWTI would have to be moved lower. On the other hand, if crude oil moves to a stop-loss level but DWTI doesn’t, then we will view both positions (in crude oil and DWTI) as closed. In other words, since it’s not possible to be 100% certain that each related instrument moves to a given level when the underlying instrument does, we can’t provide levels that would be binding. The levels that we do provide are our best estimate of the levels that will correspond to the levels in the underlying assets, but it will be the underlying assets that one will need to focus on regarding the sings pointing to closing a given position or keeping it open. We might adjust the levels in the “additional instruments” without adjusting the levels in the “main instruments”, which will simply mean that we have improved our estimation of these levels, not that we changed our outlook on the markets.
This completes this month’s Oil Investment Update. Our next Oil Investment Update is scheduled for Thursday, Apr 7, 2016. Oil Trading Alerts subscribers will additionally receive similar but shorter alerts on a daily basis (or more than once a day when the situation requires it). You – Oil Investment Updates subscribers – will receive short Investment Alert messages should the outlook for the medium or long term change before the next Update is posted.
Thank you.
Nadia Simmons
Forex & Oil Trading Strategist
Oil Investment Updates
Oil Trading Alerts

