

In our last month’s bearish scenario for the following weeks, we wrote the following:
If the commodity extends losses, and broke below the 2009 low of $33.55, we’ll see a drop to around $32, where the lower border of the red declining trend channel (marked on the daily chart) is. If it is broken, the commodity will test the psychological barrier of $30.
From today’s point of view, we see that the situation developed in line with the above scenario and crude oil slipped below our downside target, reaching levels not seen since Sep 2003. Although rumors about OPEC’s meeting with members outside the cartel to cut production and reduce the supply glut on the oil market triggered a sharp rally in the third decade of the last month, the commodity reversed and move lower once again as Saudi Arabia didn’t confirm the emergency meeting. Additionally, we should keep in mind that oversupply problem will be exacerbated further after Iranian exports will return to the global oil market. Earlier this week, the country said that it planned to increase crude exports to 2.3 million barrels per day as early as Mar 21. On top of that, Wednesday’s EIA report showed that U.S. crude oil inventories for the week ending on January 29, increased by 7.8 million barrels from the previous week, surpassing analysts’ forecasts. The report also showed that gasoline inventories increased by 5.9 million barrels, extending sharp gains from the previous three weeks. In our opinion, it doesn’t bode well for crude oil, suggesting further deterioration and lower prices in the coming weeks. Will the technical picture of the commodity confirm this bearish scenario? Let’s jump right into charts (chart courtesy of http://stockcharts.com) and try to find the answer.
Crude Oil
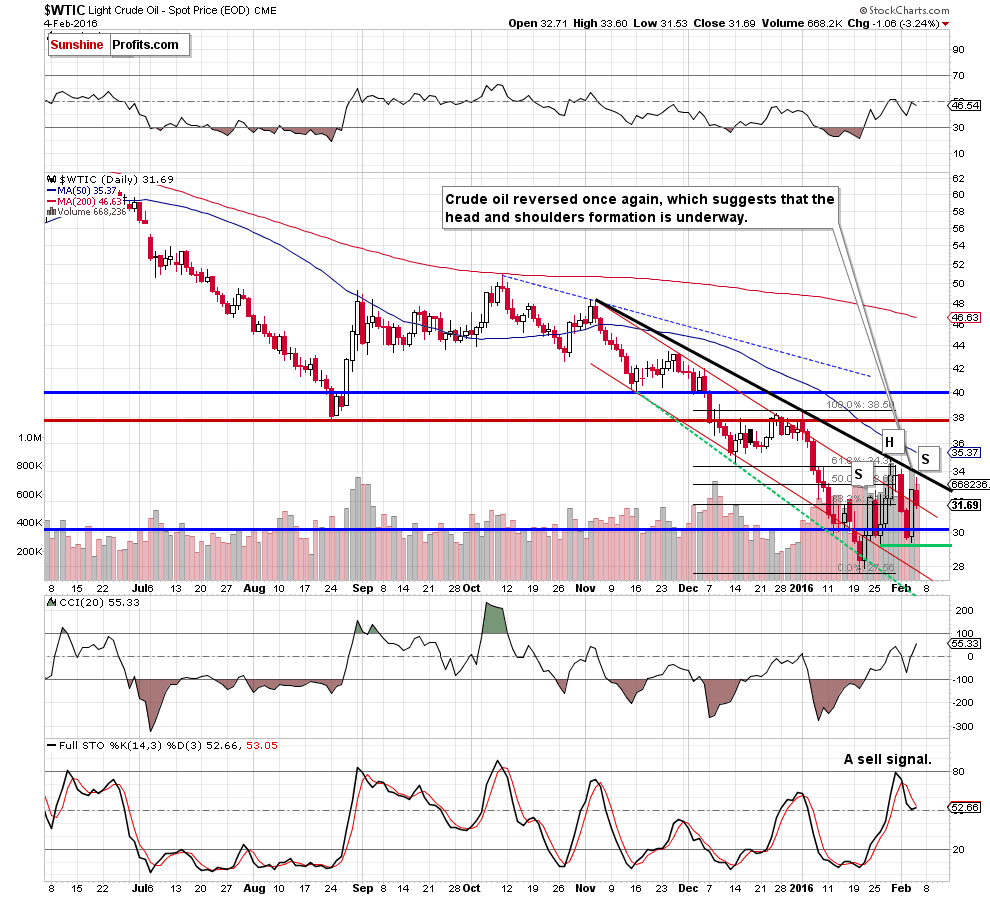
Looking at the daily chart we see that the proximity to the black resistance line (the key short-term resistance at the moment) encouraged oil bears to act, which resulted in a pullback. Taking this fact into account, we believe that lower values of the commodity are just around the corner. Why? Firstly, crude oil came back below the previously-broken upper border of the red declining trend channel, invalidating yesterday’s breakout. Secondly, sell signals generated by the indicators remain in place, supporting oil bears. Thirdly, when we take a closer look at the chart, we can notice a potential head and shoulders formation (the right shoulder of the pattern is underway). Therefore, if this is the case, light crude will extend losses and come back to (at least) the green support line in the coming days.
Are there any other technical factors that could support oil bears in near future? Let’s examine the weekly chat and find out.
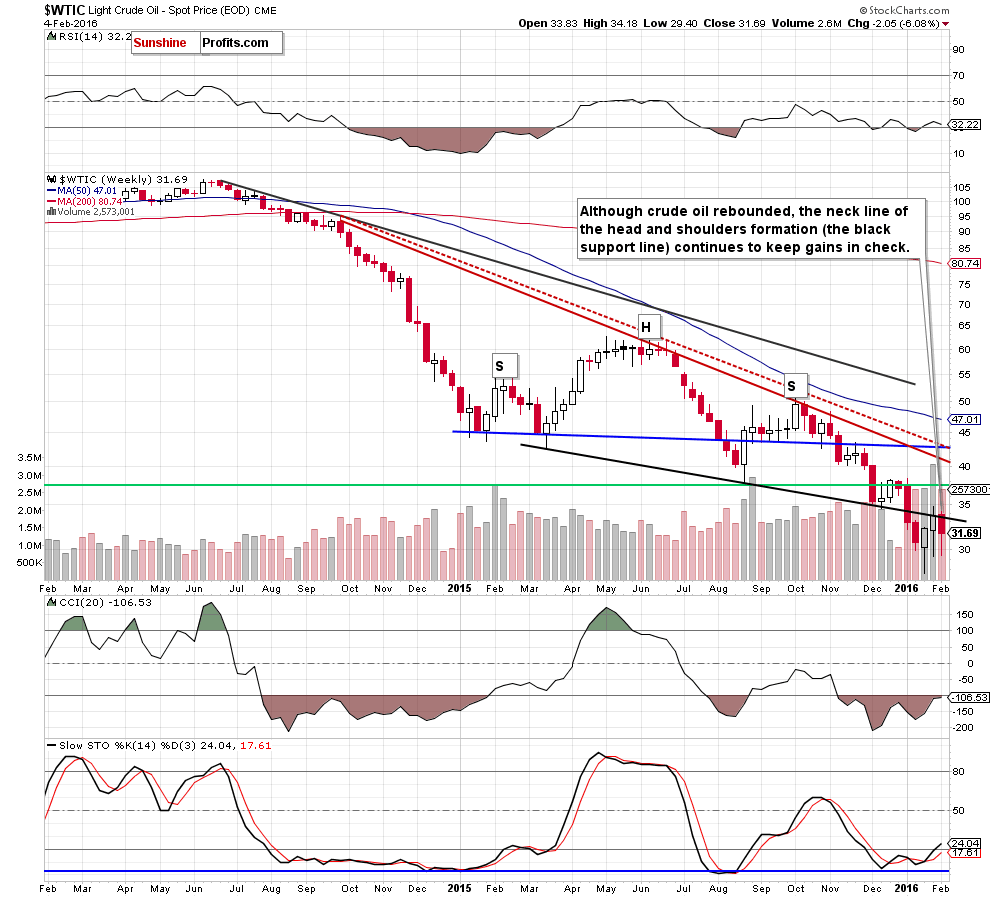
From this perspective, we see that although crude oil rallied earlier this week, the overall situation in the medium term hasn’t changed much as the commodity remains under the previously-broken neck line of the head and shoulders formation. Therefore, if light crude declines from here, we’ll receive another verification of earlier breakdown under this important line.
Having said that, let’s find out how the recent price action affected the long-term picture.
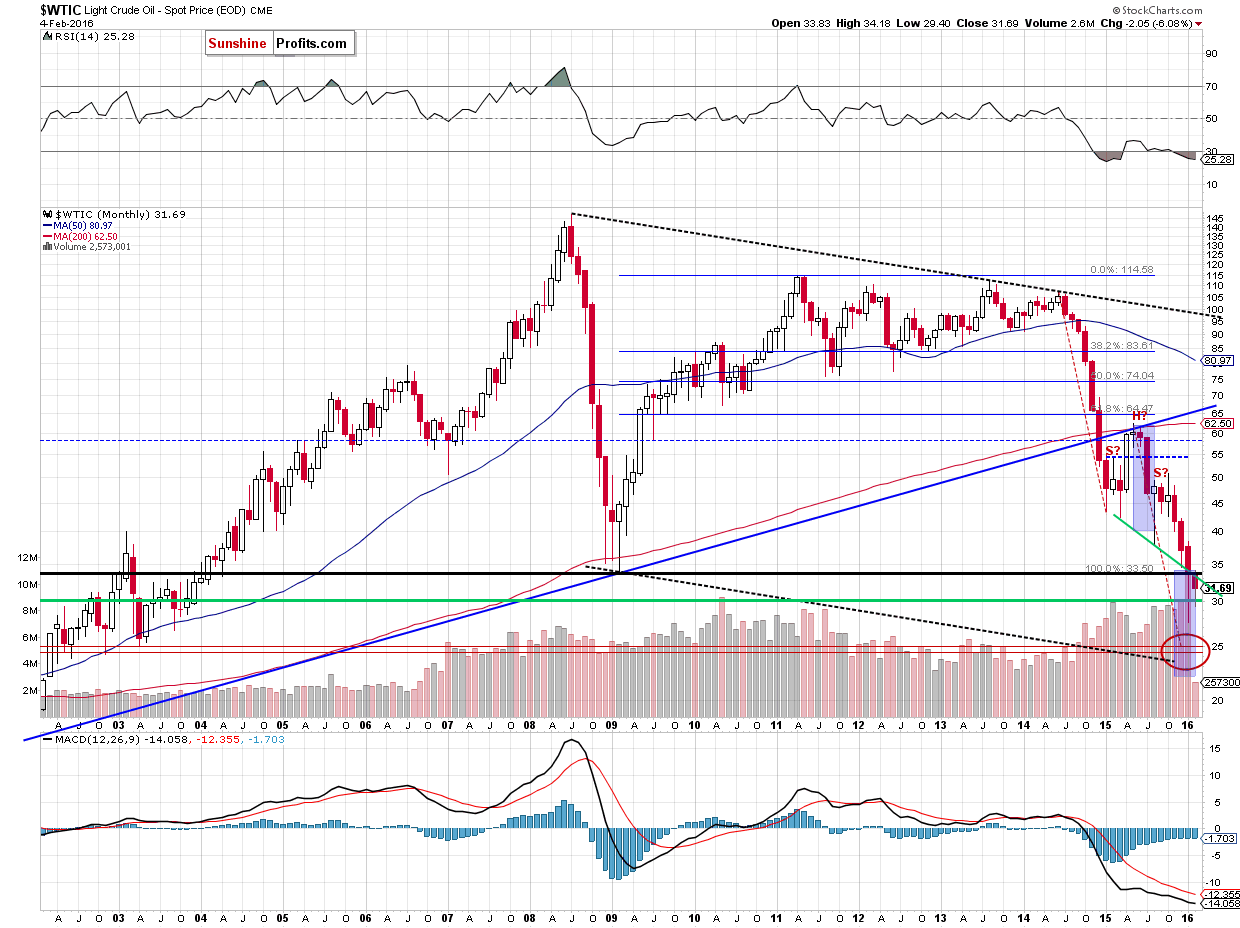
As you see on the monthly chart, although crude oil closed the previous month above the 2009 lows (an invalidation of the breakdown), this improvement was only temporarily and the commodity came back under this important support/resistance level earlier this month. Such price action looks like a verification of earlier breakdown, which suggests further deterioration in the coming weeks. How low could light crude go? In our opinion, the way to $25 is open (why here? We explained this downside target in our Oil Trading Alert posted on Sep 9).
Summing up, crude oil reversed and declined under the upper border of the short-term declining trend channel, which suggests further deterioration - especially when we factor in a potential head and shoulders formation marked on the daily chart and a verification of the breakdowns under the 2009 low and the neck line of the head and shoulders pattern (seen on the weekly chart). Therefore, we believe that short positions (with a stop-loss order at $35.63 and a price target at $25.63) are justified from the risk/reward perspective.
Having discussed the situation in crude oil, let’s examine the NYSE Arca Oil Index (XOI) to find out what the current outlook for oil stocks is.
Oil Stocks
A month ago, we wrote the following:
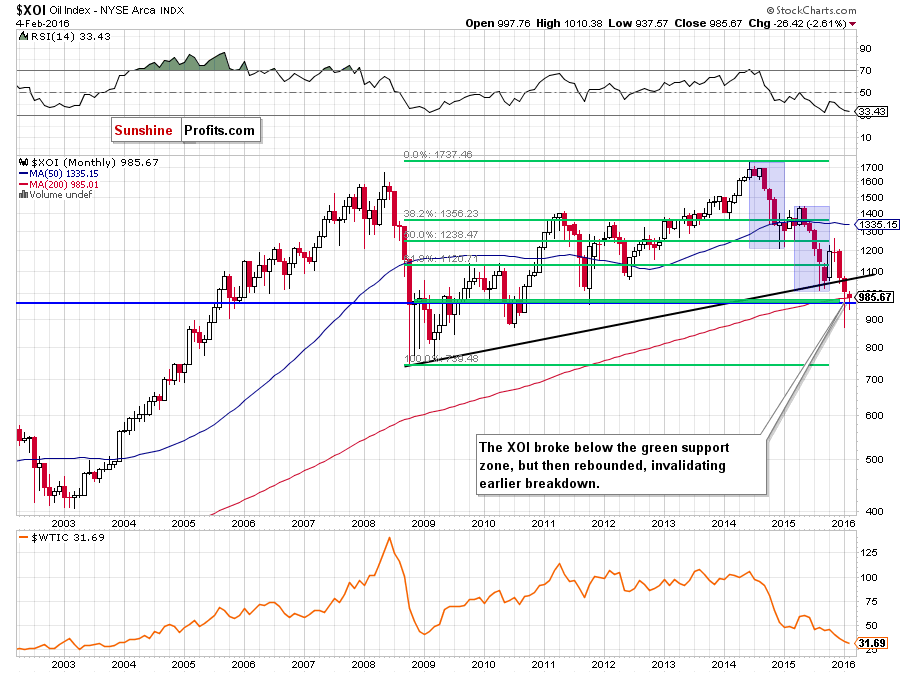
The first thing that catches the eye on the monthly chart is a breakdown under the black key support line. This is a bearish signal, which suggests a test of the 200-month moving average (currently around 982) and the green support zone (created by the 76.4% and 78.6% Fibonacci retracement levels), which is also reinforced by the Oct 2011 low (around 955-976).
Looking at the long-term chart, we see that the situation developed in line with the above scenario and oil stocks reached our downside target. As you see, the XOI rebounded sharply in the previous month, but the beginning of this month brought another downswing. Therefore, if oil stocks decline under the 200-month moving average and the green support zone, the initial downside target would be Jan low of 868.47.
Will we see further deterioration? Let’s take a closer look at the weekly chart and find out what can we infer from it.
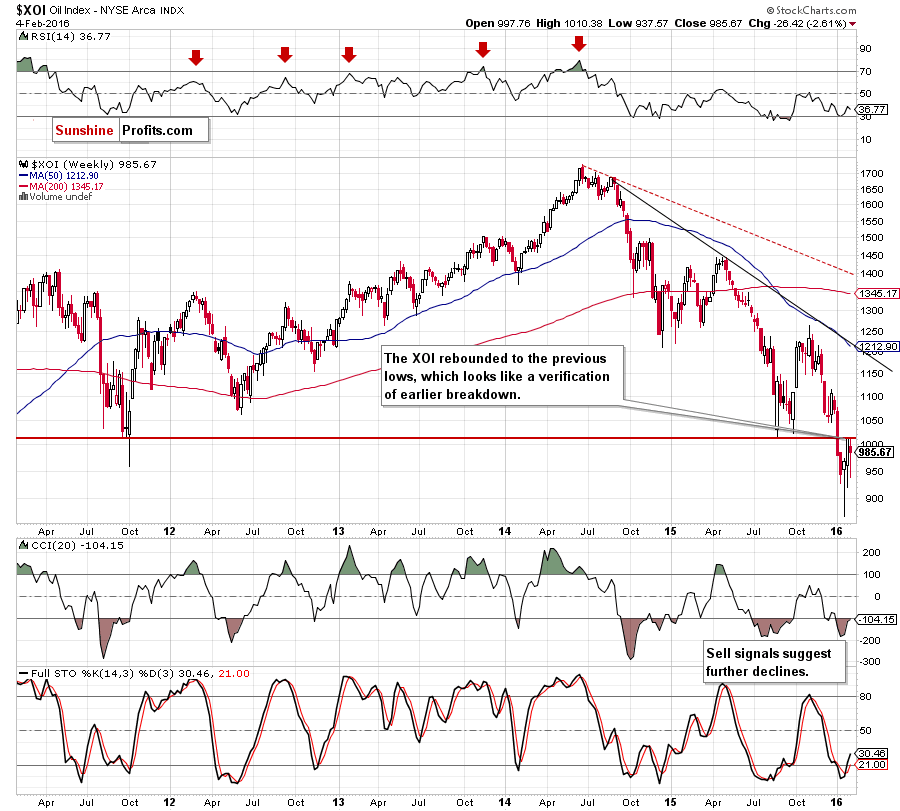
From this perspective, we see that the recent upward move took oil stocks to the red horizontal line based on the Aug low, which looks like a verification of earlier breakdown. If this is the case and the XOI declined from here, it would be a bearish signal, which will likely trigger a drop to (at least) 920.58 in the coming weeks.
Are there any other factors that could encourage oil bears to act? Let’s examine the daily chart and find out.
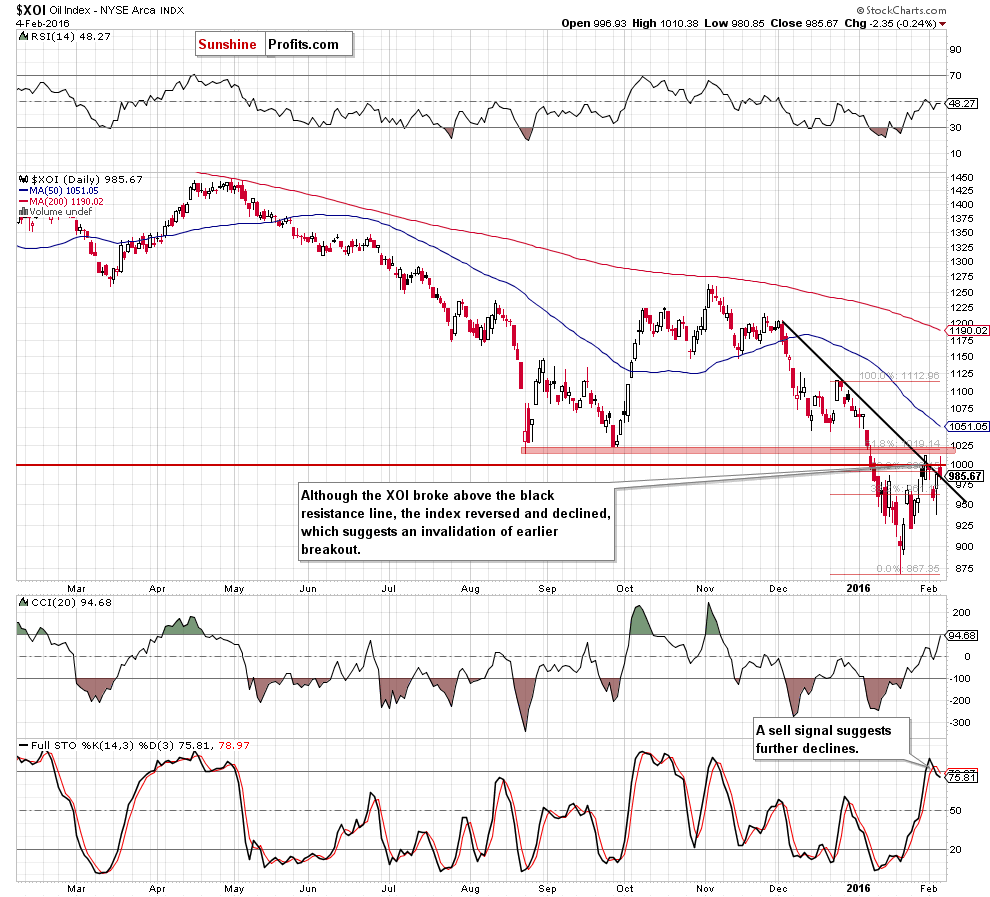
From today’s point of view, we see that although the recent upward move took the XOI above the black declining resistance line, the red resistance area (created by the Aug low and the 61.5% Fibonacci retracement) in combination with the barrier of 1,000 stopped oil bulls. As you see, this area triggered a pullback, which took the index to the previously-broken black line. Although oil stocks could rebound from here, the current position of the indicators suggests that further declines are just around the corner. Therefore, if we see an invalidation of the breakout, the XOI will drop to at least 937.57, where the Feb low is. If it is broken, we may see a test of the Jan lows.
Summing up, oil stocks reached the resistance area, which triggered a pullback yesterday. Taking this fact into account and combining it with the current position of daily indicators, we think that lower values of the index are just a matter of time and a test of the Jan low should not surprise us.
Ratio Analysis
Once we know the current situation in crude oil and oil stocks, let’s focus on the relationship between them. What can we infer from the chart below?
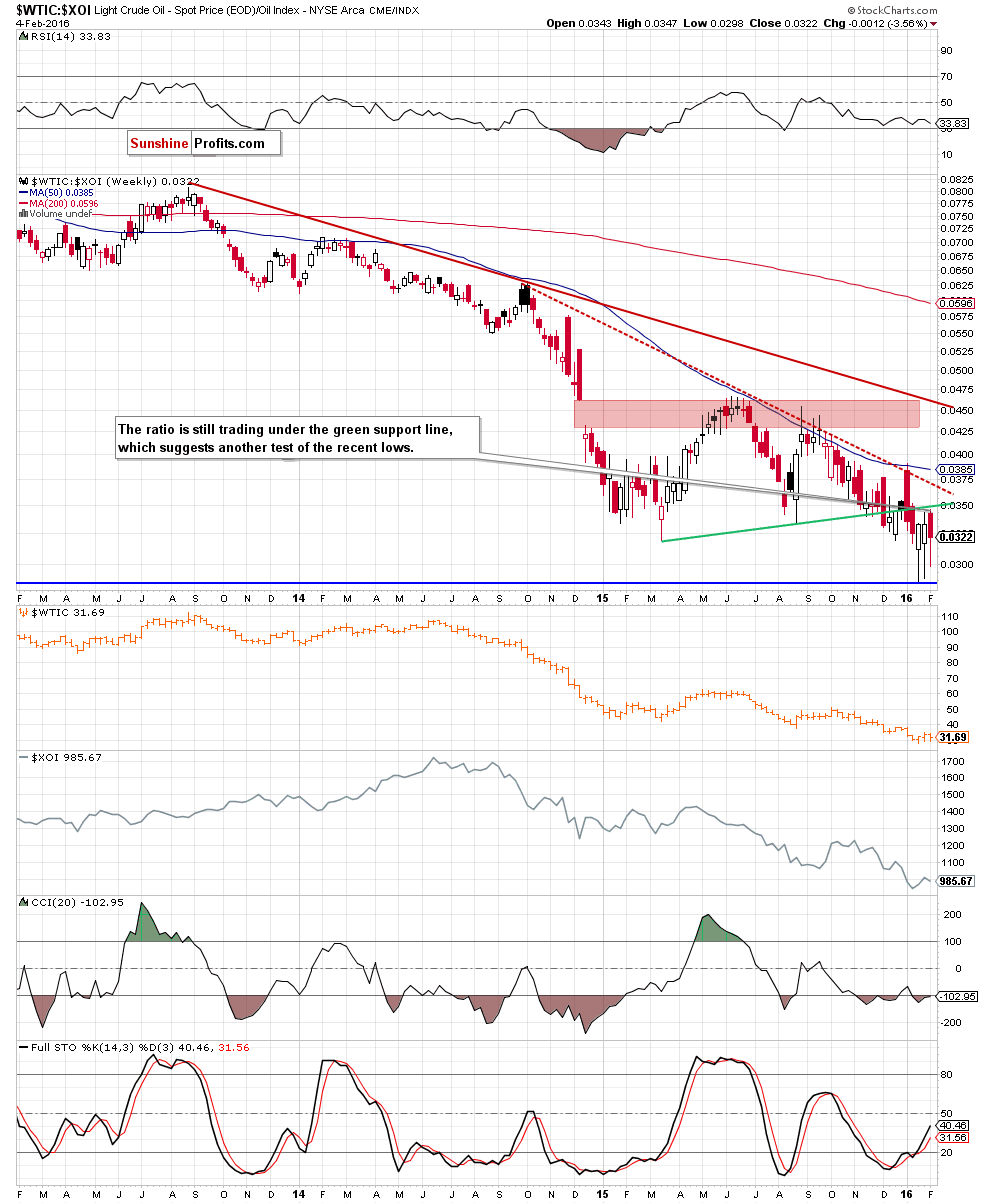
Looking at the weekly chart, we see that although the ratio rebounded in the previous weeks, the green resistance line continues to keep gains in check. In our opinion, the recent upward move looks like a verification of earlier breakdown, which increases the probability of further deterioration. If we see such price action, crude oil and oil stocks will extend declines in the coming weeks.
Having said the above, let’s analyze the oil-to-gold ratio.
A month ago, we wrote:
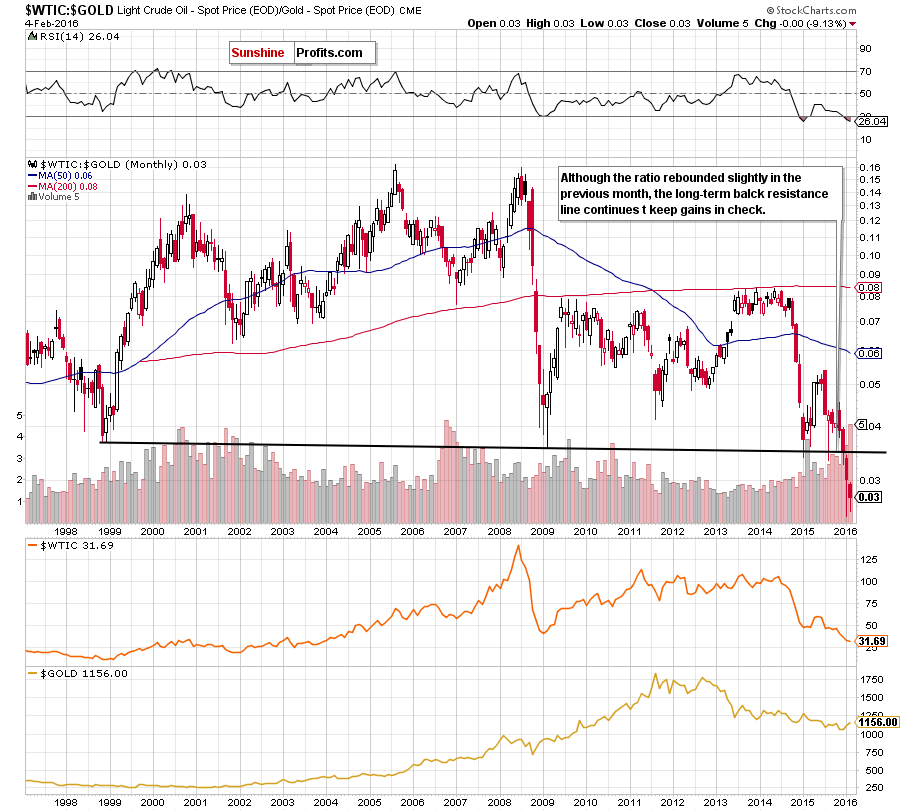
The first thing that catches the eye on the monthly chart is a breakdown under the black support line based on the 1999 and 2009 lows. This is a bearish signal which increases the probability of further declines in the coming month.
From today’s point of view, we see that the ratio declined sharply as we had expected. Although we saw a rebound, please note that the ratio erased some i=of this move earlier this month, which suggests further declines.
Will we see such price action? Let’s take a look at the chart below.
Quoting our previous Oil Investment Update:
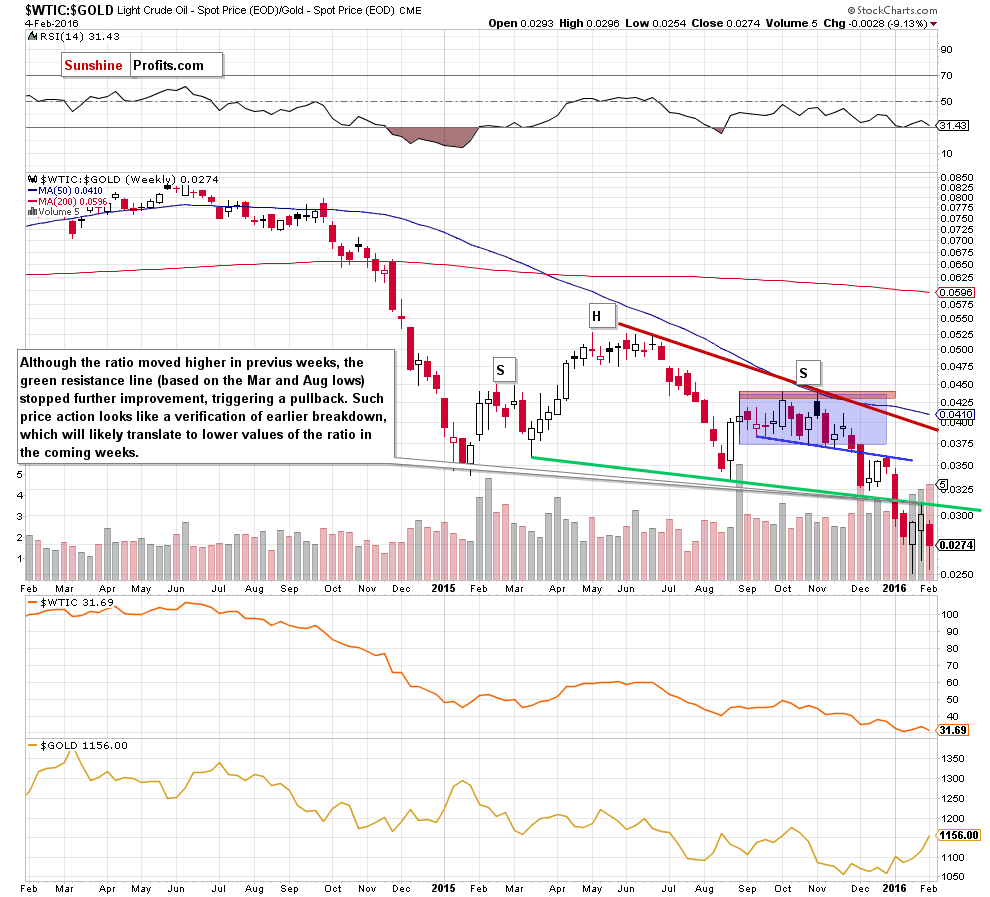
(…) the ratio reached the neck line of the head and shoulders formation, which is the major support at the moment. What’s next? (…) we could see a decline even to 0.0275
On the above chart, we see that the situation developed in line with our scenario and the ratio declined sharply not only to the downside target, but even lower. Recent weeks brought a rebound, but the neck line of the head and shoulders formation continues to keep gains in check. Similarly to what we wrote earlier in the case of the oil-to-oil stocks ratio, this move seems to be a verification of earlier breakdown, which doesn’t bode well for the ratio and crude oil in the coming weeks. In our opinion, lower values of the ratio and the commodity are just around the corner (please note that the initial downside target would be the Jan low of 0.0251).
Finishing this section, we would like to take a closer look at the relationship between crude oil and the general stock market.
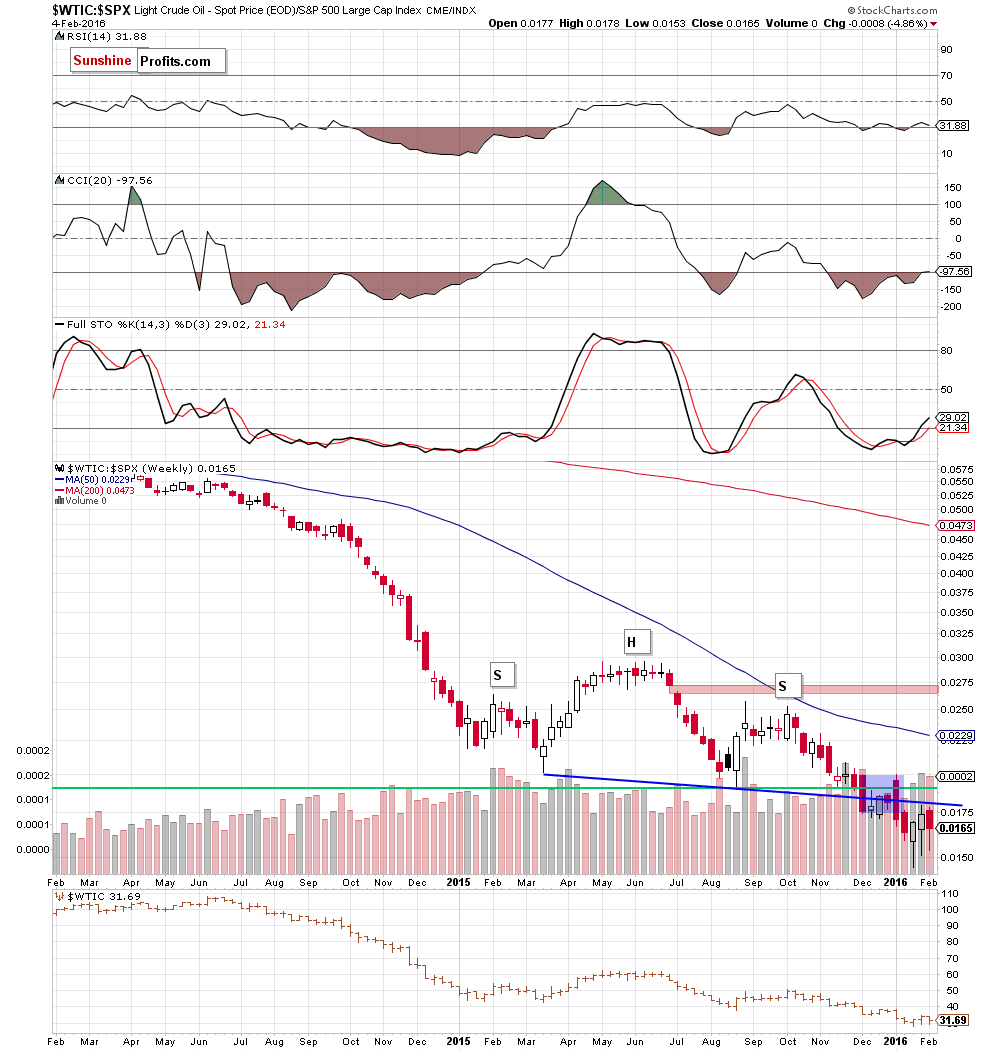
On the weekly chart, we clearly see a breakdown under the neck line of the head and shoulders formation and its verification, which is a bearish signal that suggests lower prices of crude oil in the coming weeks.
Non-USD Crude Oil Price
Know the situation for the above ratios, let’s move on to the non-USD (WTIC:UDN ratio) chart of crude oil. As a reminder, UDN is the symbol for the PowerShares DB US Dollar Index Bearish Fund, which moves in the exact opposite direction to the USD Index. Since the USD Index is a weighted average of the dollar's exchange rates with world's most important currencies, the WTIC:UDN ratio displays the value of crude oil priced in "other currencies".
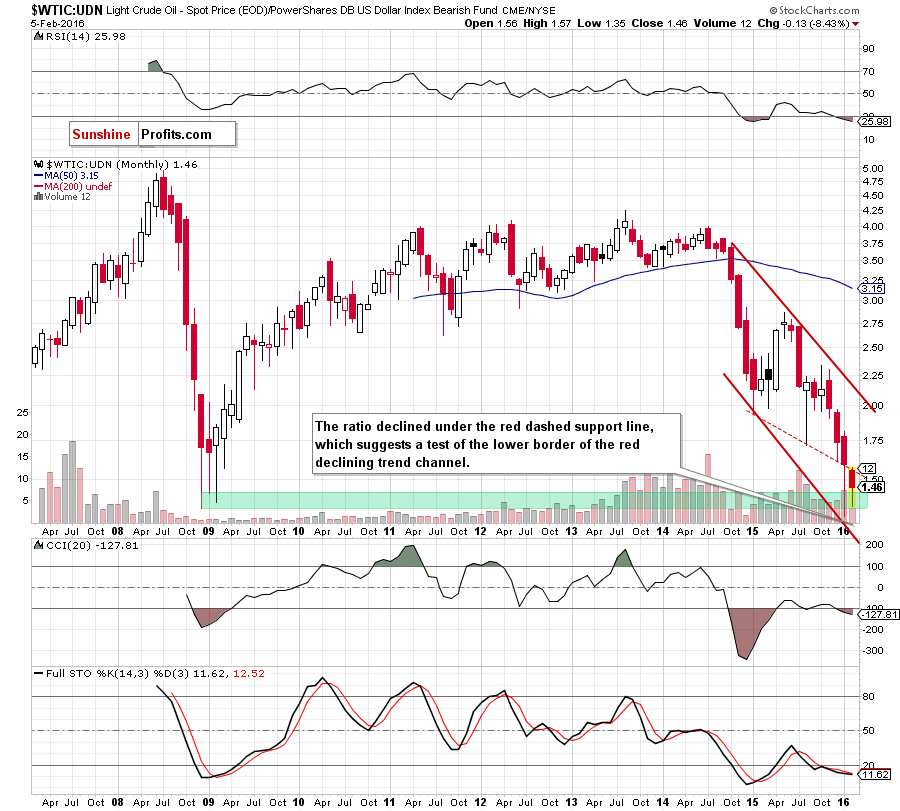
From the long-term perspective, we see that although the proximity to the lower border of the red declining trend channel triggered a sharp rebound in the previous month, the red dashed resistance line (based on the Jan 2015 and Aug lows) stopped further rally. Earlier this month, the ratio extended losses, which suggests a test of the Jan low or even a decline to the lower border of the trend channel in the coming month. Such price action will likely translate into another downward move in light crude.
Scenarios
Just like a month ago, today’s Oil Investment Update includes scenarios of what could happen in the coming weeks. Naturally, we will continue to monitor the market in the coming days and if anything invalidates our long-term outlook we will send you an additional message.
- Bullish scenario
If crude oil increases from the current levels, breaking above the black resistance line (marked on the daily chart) and invalidates the breakdown under the neck line of the head and shoulders formation (seen on the weekly chart), we’ll see a rally to the first resistance zone created by the Aug low and the Jan high ($37.75-38.39). If it is broken, the next target for oil bulls would be the barrier of $40 or even the late Nov highs of $43.30-$43.36. - Bullish scenario
If the commodity extends losses, and broke below the green support line (based on the Jan 26 low of $29.25), we’ll see a test of the Jan low of $27.56 and the lower border of the red declining trend channel. If this area is broken, we may see a drop to around $25 or even to $23.68, where the size of the downward move will correspond to the height of the head and shoulders formation (seen on the daily chart).
Summary
The late-Jan rebound took crude oil, the oil-to-gold and oil-to-stocks ratios to the neck lines of the head and shoulders formations. The recent declines suggest that the last month’s price action was just a verification of earlier breakdown and further deterioration is just around the corner. At the same time, the oil-to-oil stocks ratio verified a breakdown under the barrier of 1,000, while the WTIC:UDN ratio verified the breakdown below the resistance line based on the Jan 2015 and Aug lows. All the above doesn’t bode well for crude oil, suggesting (at least) a test of the Jan lows. Nevertheless, consequently, the $25 level is our next target level for crude oil. Therefore, even though not much time passed since we entered the current trade and it’s already profitable, it seems that the profits will be even bigger before this trade is over.
Very short-term outlook: bearish
Short-term outlook: bearish
MT outlook: bearish
LT outlook: mixed with bearish bias
Trading position (short-term; our opinion): Short positions (with a stop-loss order at $35.63 and the price target at $25.63) are justified from the risk/reward perspective. The analogous levels for USO ETF and DWTI ETN are:
- USO initial target price: $6.67; USO stop-loss: $10.25
- DWTI initial target price: $513.31; DWTI stop-loss: $165.84
As a reminder – “initial target price” means exactly that – an “initial” one, it’s not a price level at which we suggest closing positions. If this becomes the case (like it did in the previous trade) we will refer to these levels as levels of exit orders (exactly as we’ve done previously). Stop-loss levels, however, are naturally not “initial”, but something that, in our opinion, might be entered as an order.
Since it is impossible to synchronize target prices and stop-loss levels for all the ETFs and ETNs with the main market that we provide this level for (crude oil), the stop-loss level and target price for popular ETN and ETF (among other: USO, DWTI, UWTI) are provided as supplementary, and not as “final”. This means that if a stop-loss or a target level is reached for any of the “additional instruments” (DWTI for instance), but not for the “main instrument” (crude oil in this case), we will view positions in both crude oil and DWTI as still open and the stop-loss for DWTI would have to be moved lower. On the other hand, if crude oil moves to a stop-loss level but DWTI doesn’t, then we will view both positions (in crude oil and DWTI) as closed. In other words, since it’s not possible to be 100% certain that each related instrument moves to a given level when the underlying instrument does, we can’t provide levels that would be binding. The levels that we do provide are our best estimate of the levels that will correspond to the levels in the underlying assets, but it will be the underlying assets that one will need to focus on regarding the sings pointing to closing a given position or keeping it open. We might adjust the levels in the “additional instruments” without adjusting the levels in the “main instruments”, which will simply mean that we have improved our estimation of these levels, not that we changed our outlook on the markets.
This completes this month’s Oil Investment Update. Our next Oil Investment Update is scheduled for Thursday, Mar 3, 2016. Oil Trading Alerts subscribers will additionally receive similar but shorter alerts on a daily basis (or more than once a day when the situation requires it). You – Oil Investment Updates subscribers – will receive short Investment Alert messages should the outlook for the medium or long term change before the next Update is posted.
Thank you.
Nadia Simmons
Forex & Oil Trading Strategist
Oil Investment Updates
Oil Trading Alerts

