

Just like a month ago, we begin this Oil Investment Update with the words that we used to summarize the situation in the previous update (on Dec 8, 2015). We summarized the situation in the following way:
The most important event of the recent months was a successful breakdown under the barrier of $40, which resulted in a fresh multi-year low of $37.50. As (…) with this downward move the commodity reached its key support – the neck line of the head and shoulders formation (marked on the monthly chart). Although we could see a pause in this area (or even a small rebound from here), the current position of the indicators (in the case of crude oil and all the above-mentioned ratios) suggests that a test of the 2009 low is just around the corner.
Additionally, we included a bearish scenario for the following weeks:
If the commodity extends losses, we may see a drop to the support zone based on the Dec 2008 and Jan 2009 lows (around $35.13-$35.52). In this case, crude oil (…) will likely accelerate declines and result in a drop to the 2009 low of $33.55.
From today’s point of view, we see that the situation developed in line with the above scenario and crude oil approached our downside targets after yesterday’s EIA report, which showed an unexpected 5.1 million-barrel drop in crude oil inventories (in the week ended January 1), but these positive numbers were overshadowed by a 10.6 million-barrel surge in gasoline supplies. This biggest build since 1993 in combination with a 6.3 million-barrel increase in distillate stockpiles and a 917,000 barrels gain in supplies at Cushing, Oklahoma affected negatively investors’ sentiment and pushed the commodity sharply lower. As a result, light crude broke below the Dec low and closed the day slightly above $34. Will we see further deterioration in the coming weeks? Let’s jump right into charts (chart courtesy of http://stockcharts.com) and try to find the answer.
Crude Oil
Yesterday, in our Oil Trading Alert, we wrote the following:
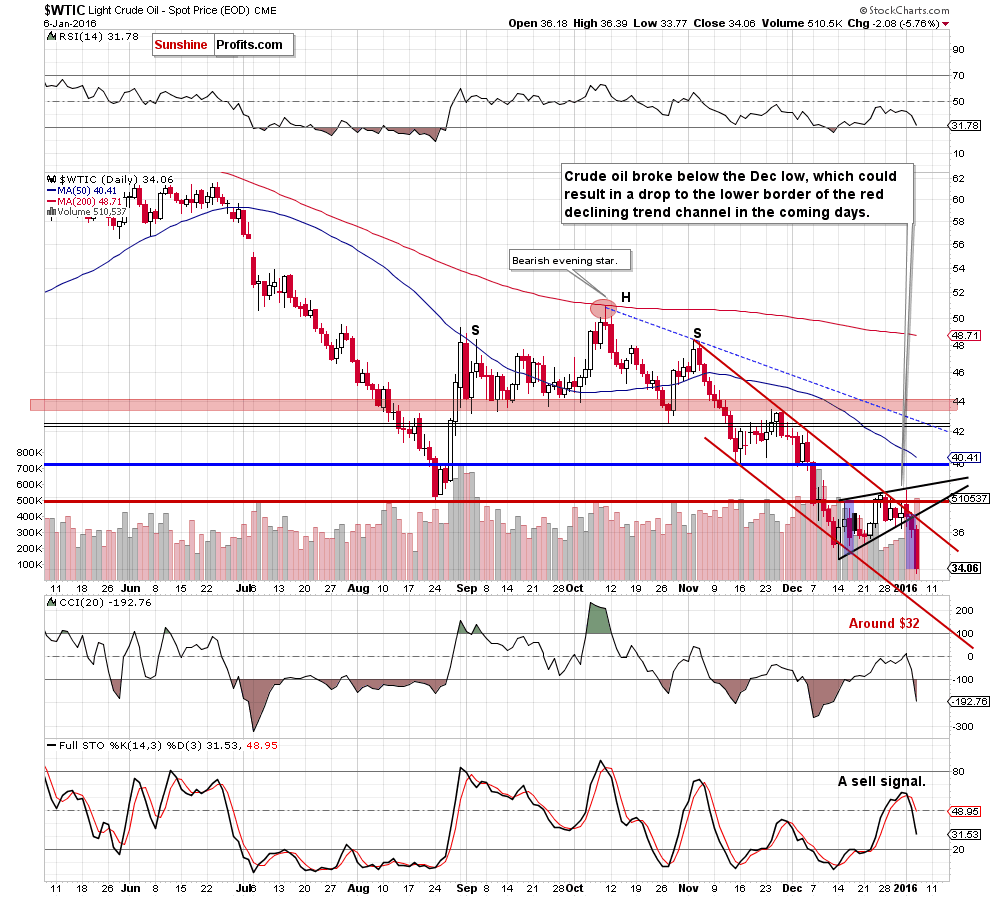
(…) yesterday’s breakdown under the lower line of the formation suggests that we’ll see a decline to around $33.96, where the size of the downward move will correspond to the height of the rising wedge. At this point, it is also worth noting that the Stochastic Oscillator generated a sell signal, which is an additional negative factor. Why? When we take a closer look at the daily chart, we see that all sell signals generated by the indicator since June encouraged oil bears to act and translated to bigger or smaller declines. Therefore, in our opinion, the history will repeat itself once again and we’ll see lower values of the commodity in the coming days.
As you see on the daily chart, oil bears showed their claws once again and pushed crude oil lower as we had expected. With this downward move, light crude broke below the Dec low and slipped below our yesterday’s downside target. In our opinion, this is a bearish signal, which suggests further deterioration and a drop to around $32, where the lower border of the red declining trend channel is.
But will we see such price action? Let’s examine the weekly chart and find out what can we infer from it about future moves.
Yesterday, we wrote:
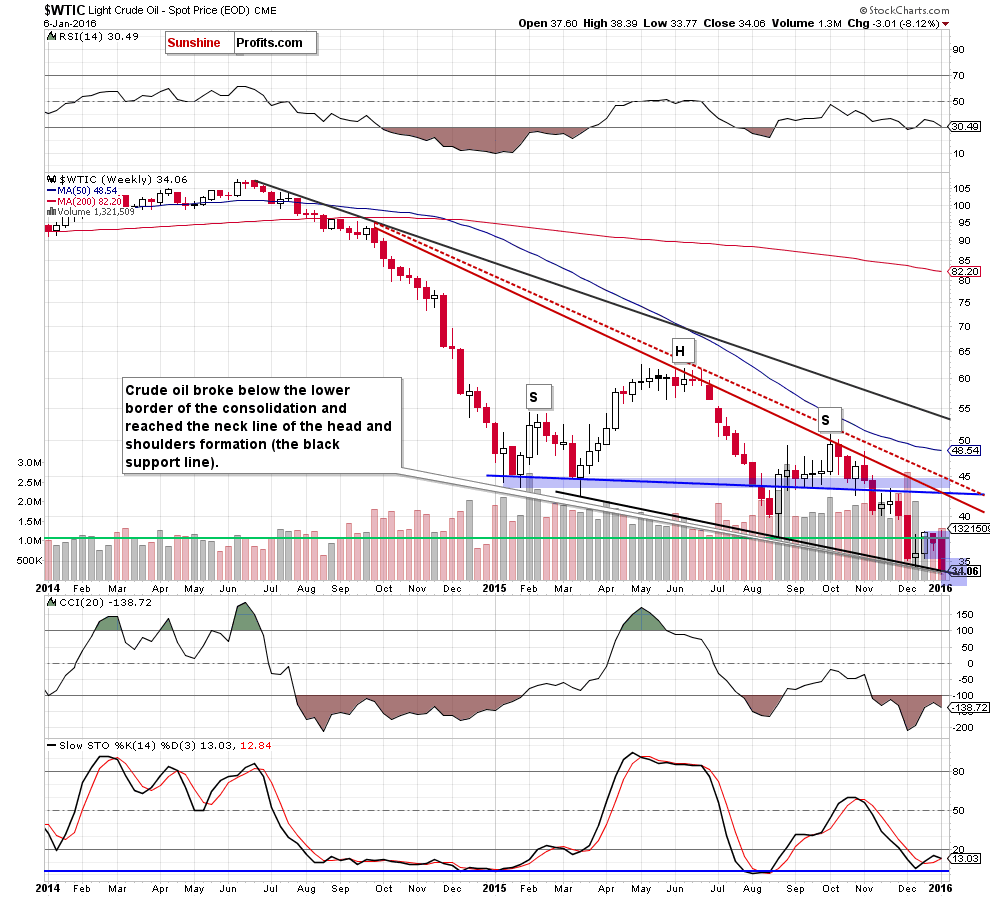
(…) today’s downswing approached light crude to the lower line of the formation, which could encourage oil bears to act in the coming days.
Looking at the weekly chart, we see that the situation developed in line with the above scenario and oil bears pushed the commodity lower. With this downswing, light crude broke below the lower border of the consolidation, which resulted in another drop to the black support line (the neck line of the head and shoulders formation). In Dec, this important support line withstood the selling pressure, which resulted in a rebound. Although we could see similar price action in the coming days, the overall outlook remains bearish. Why? We believe that the best answer to this question will be the chart below.
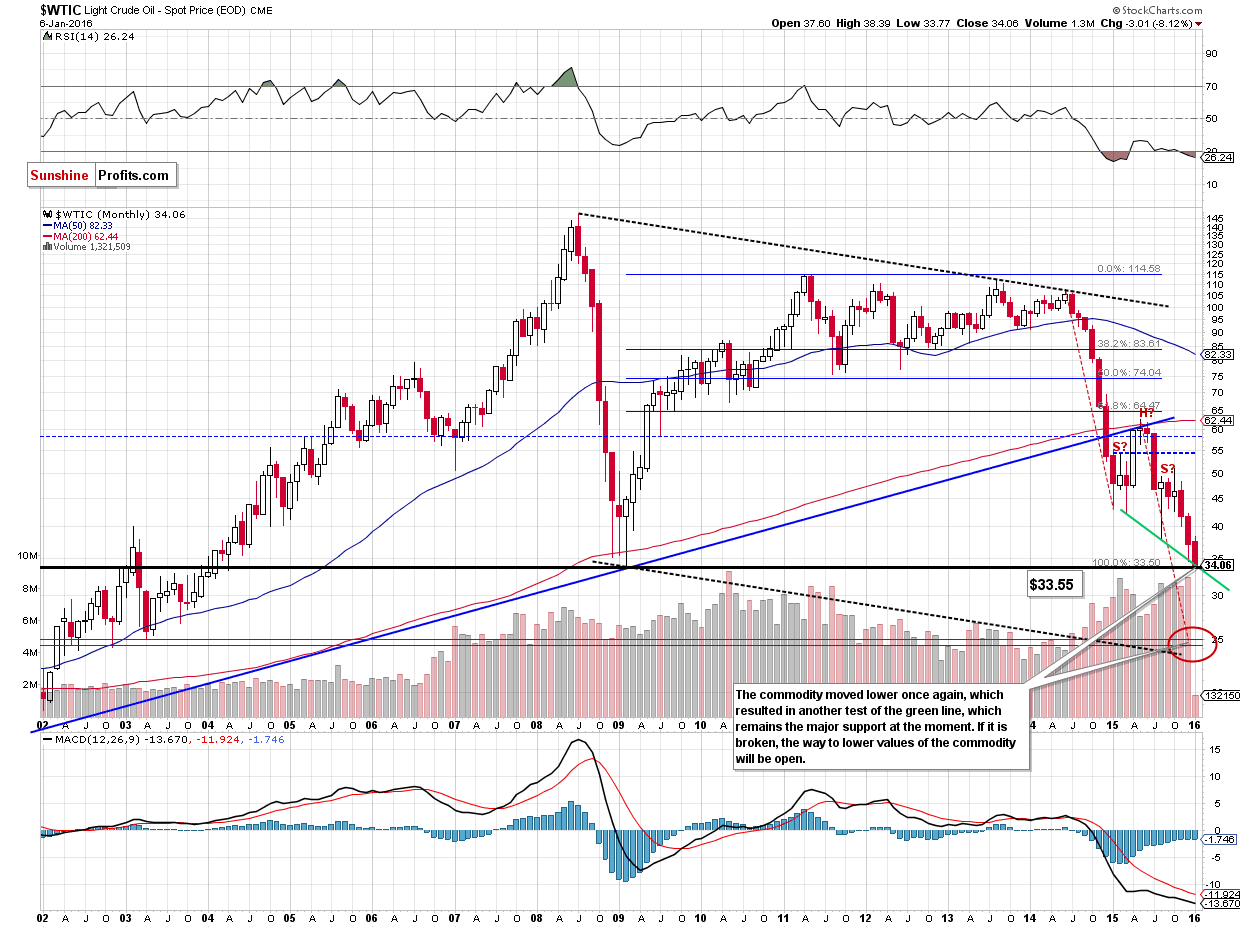
From this perspective, we see that the recent downward move took the commodity not only to the above-mentioned neck line of the head and shoulders formation, but also approached light crude to the 2009 low. If this long-term key support withstands the selling pressure, we’ll see a rebound from here, however, if it is broken, the way to $25 will be open (why here? We explained this downside target in our Oil Trading Alert posted on Sep 9).
Summing up, crude oil extended losses and broke below the Dec low, hitting a fresh multi-year low. This suggests further deterioration and (at least) a test of the 2009 low in the coming days.
Having discussed the situation in crude oil, let’s examine the NYSE Arca Oil Index (XOI) to find out what the current outlook for oil stocks is.
Oil Stocks
Quoting our previous Oil Investment Update:
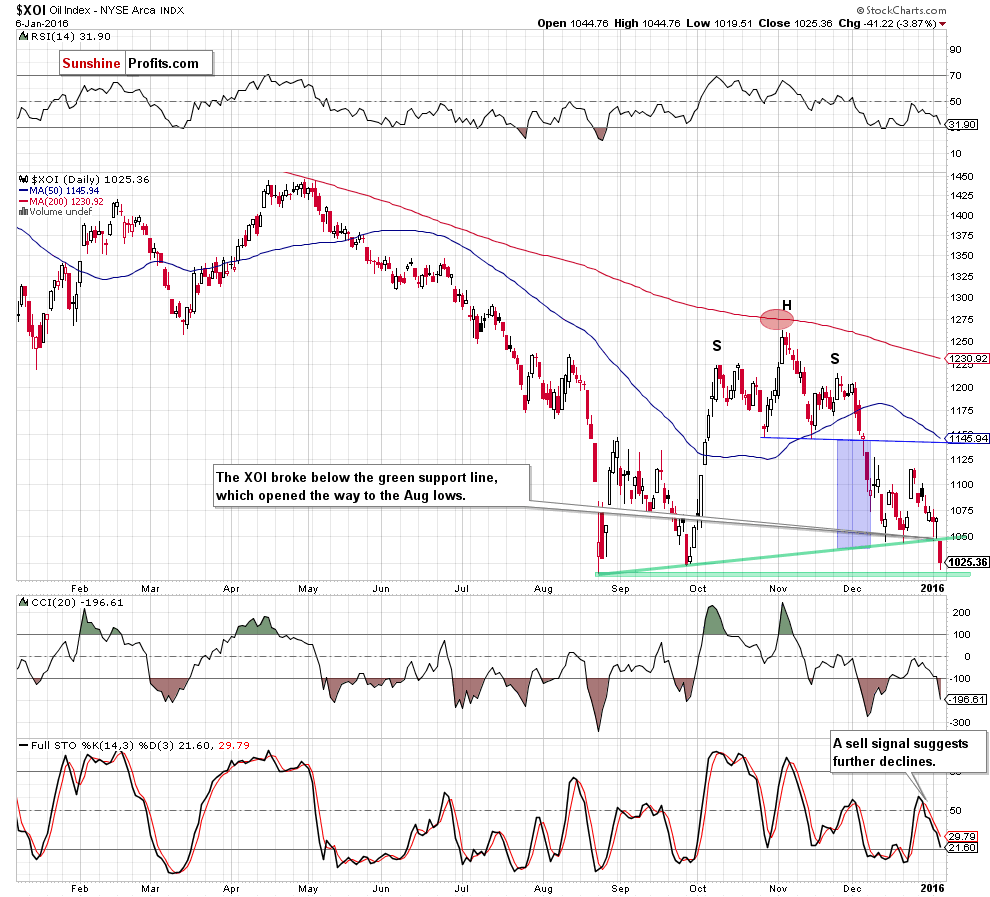
(…) oil stocks reversed, triggering sharp declines. With this downward move, the XOI dropped under the 50-day moving average, which encouraged oil bears to act and resulted in a decline below the blue support line – the neck line of the head and shoulders. This bearish event pushed the index sharply lower yesterday, which suggests that we may see a decline even to around 1,040, where the size of the correction will correspond to the height of the formation.
From today’s point of view, we see that the situation developed in line with the above scenario and the XOI slipped to the green line based o the Aug and Sep lows. Although this important support encouraged oil bulls to act, oil stocks dropped below it yesterday, which is a bearish signal that opened the way to the Aug low. Nevertheless, taking into account the current position of the indicators, it seems that further declines are just around the corner.
How low could the index go? Let’s take a closer look at the weekly chart and find out.
A month ago, we wrote:
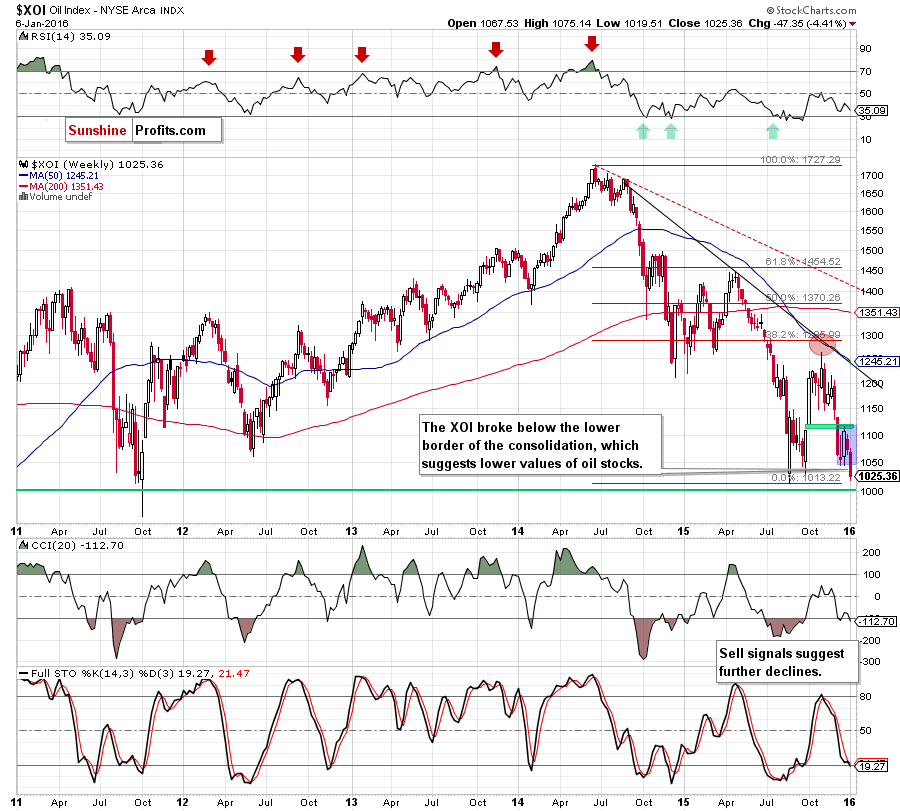
(…) the XOI dropped below 1,100 and closed the green gap which suggests further deterioration. Nevertheless, this signal will be more bearish if the index closes the week below it.
As you see on the above chart, oil stocks closed the green gap (as we had expected), which resulted in a drop under 1,050. Although the index rebounded, recent weeks of consolidation resulted in a breakdown below the lower border of the formation. This is a bearish factor, which suggests a drop to around 973 (!!!), where the size of the downward move will correspond to the height of the formation.
Is it possible that oil stocks will break under the barrier of 1,000? Let’s examine the long-term chart and find out.
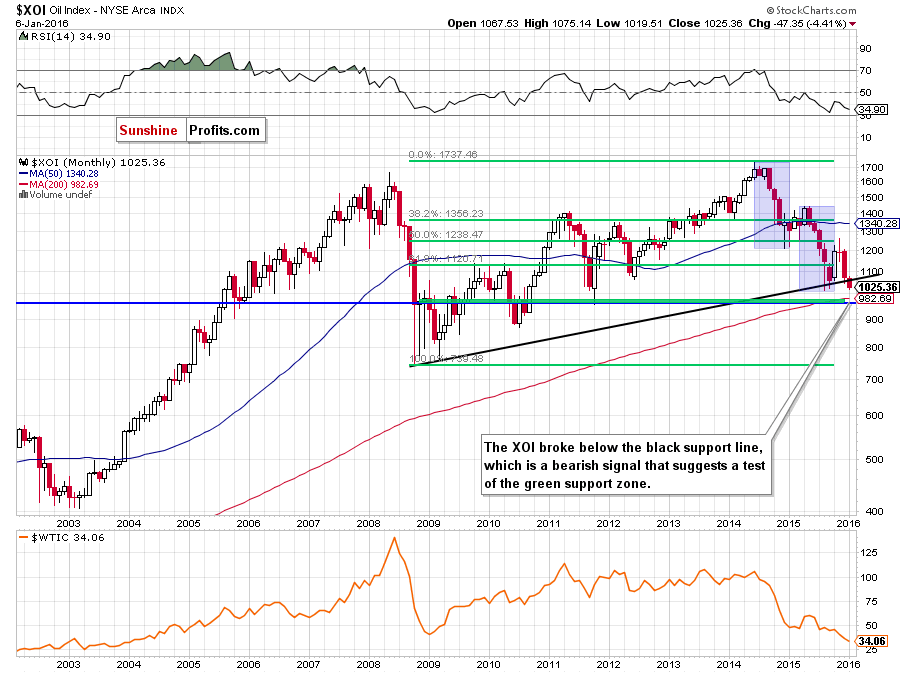
The first thing that catches the eye on the monthly chart is a breakdown under the black key support line. This is a bearish signal, which suggests a test of the 200-month moving average (currently around 982) and the green support zone (created by the 76.4% and 78.6% Fibonacci retracement levels), which is also reinforced by the Oct 2011 low (around 955-976).
Summing up, oil stocks declined sharply and broke below the black key support line, which is a bearish signal that suggests lower values of the XOI in the coming week(s).
Ratio Analysis
Once we know the current situation in crude oil and oil stocks, let’s focus on the relationship between them. What can we infer from the chart below?
A month ago, we wrote the following:
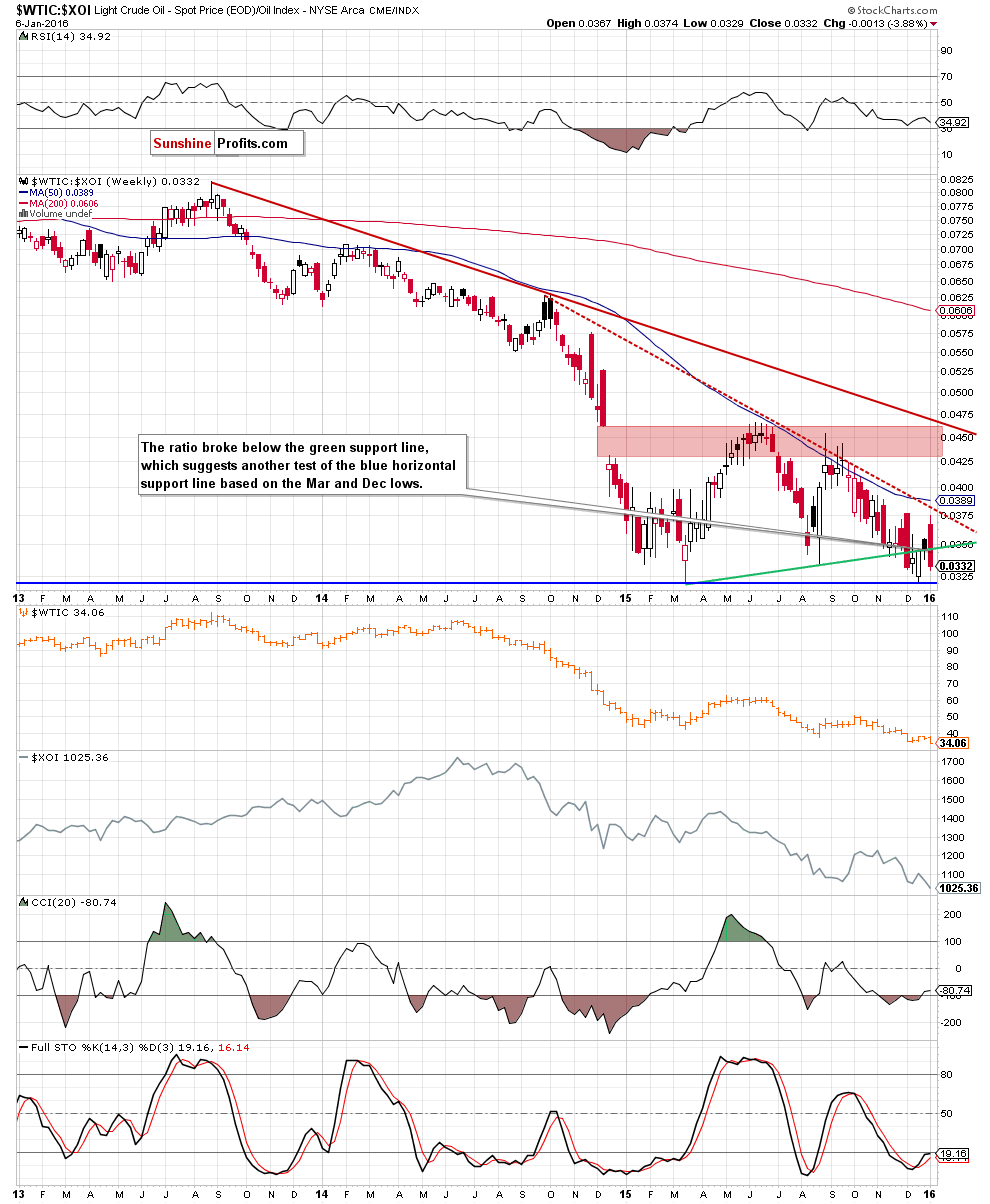
(…) the ratio extended losses, slipping to the green support line based on the Mar and Aug lows. (…) a sell signal generated by the Stochastic Oscillator suggests that lower values of the ratio can’t be ruled out. Therefore, a potential breakdown would be a very negative signal, which could trigger a test of the Aug or even the March low and result in further deterioration in crude oil.
Looking at the weekly chart, we see that the situation developed in line with the above scenario and the ratio reached our downside target. As you see the blue support horizontal line triggered a rebound in previous weeks. Despite this improvement, the proximity to the red declining dashed line encouraged oil bears to act, which resulted in a reversal and another breakdown under the green line. This suggests a test of the strength of the blue line in the coming week(s). If we see such price action, crude oil and oil stocks will extend declines.
Having said the above, let’s analyze the oil-to-gold ratio.
In our Oil Trading Alert posted on Dec 30, we wrote the following:
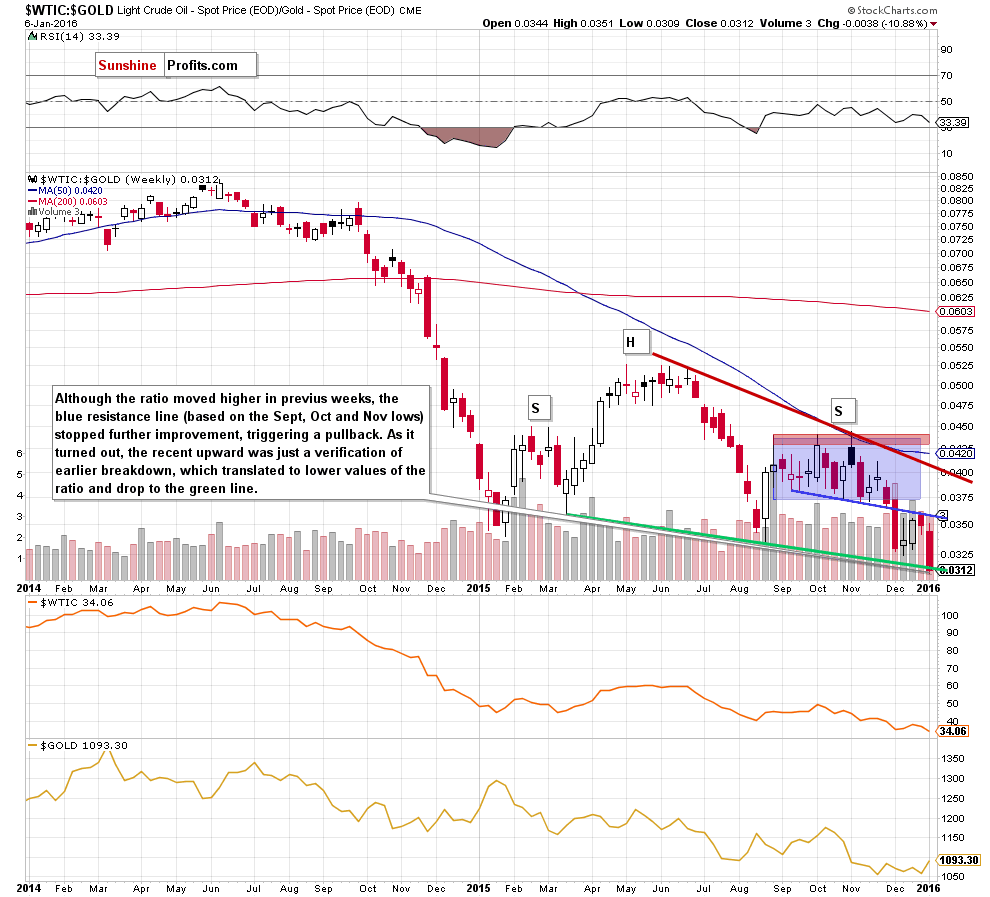
(...) the ratio rebounded in previous weeks, which resulted in an increase to the previously-broken blue line based on the Sept, Oct and Nov lows. As you see, this resistance stopped further improvement, triggering a pullback. In our opinion, such price action suggests that the recent upward move could be a verification of earlier breakdown. If this is the case, the ratio will extend declines from here, which will translate to lower values of light crude in the coming week(s).
From today’s point of view, we see that the situation developed in tune with the above scenario and both, the ratio and crude oil, extended losses earlier this week. As you see, with this downward move, the ratio reached the neck line of the head and shoulders formation, which is the major support at the moment. What’s next? If the ratio rebounds from here, we’ll see a rebound to the blue resistance line, however, if it is broken, we could see a decline even to 0.0275, where the size of the downward move will correspond to the height of the formation.
Which scenario is more likely? Let’s take a closer look at the monthly chart and find out.
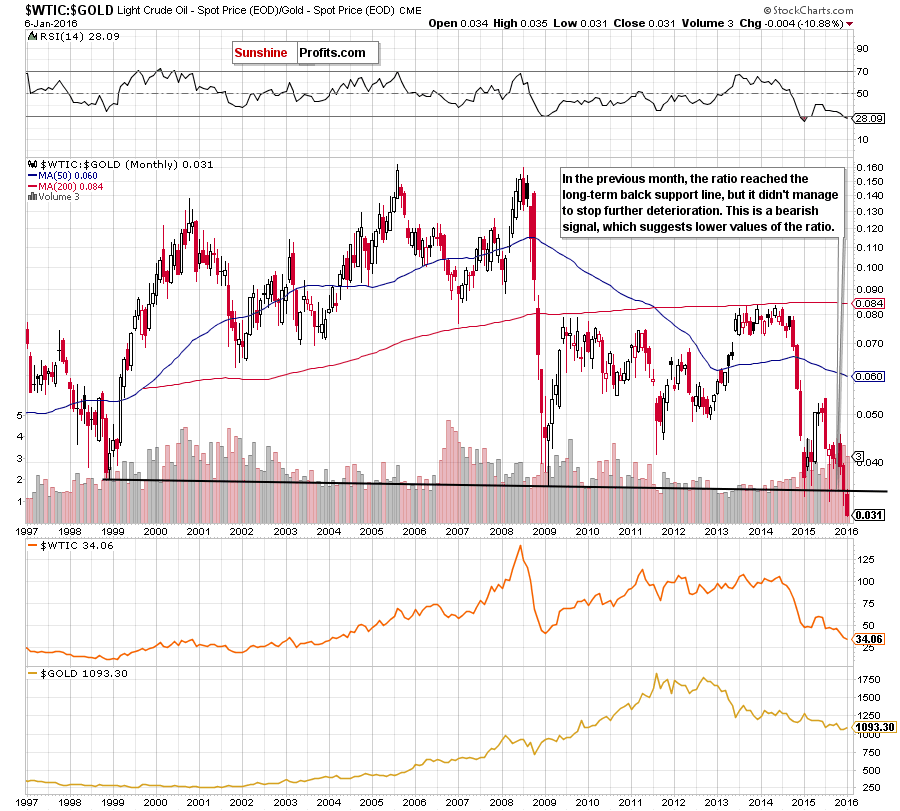
The first thing that catches the eye on the monthly chart is a breakdown under the black support line based on the 1999 and 2009 lows. This is a bearish signal which increases the probability of further declines in the coming month.
Finishing this section, we would like to take a closer look at the relationship between crude oil and the general stock market.
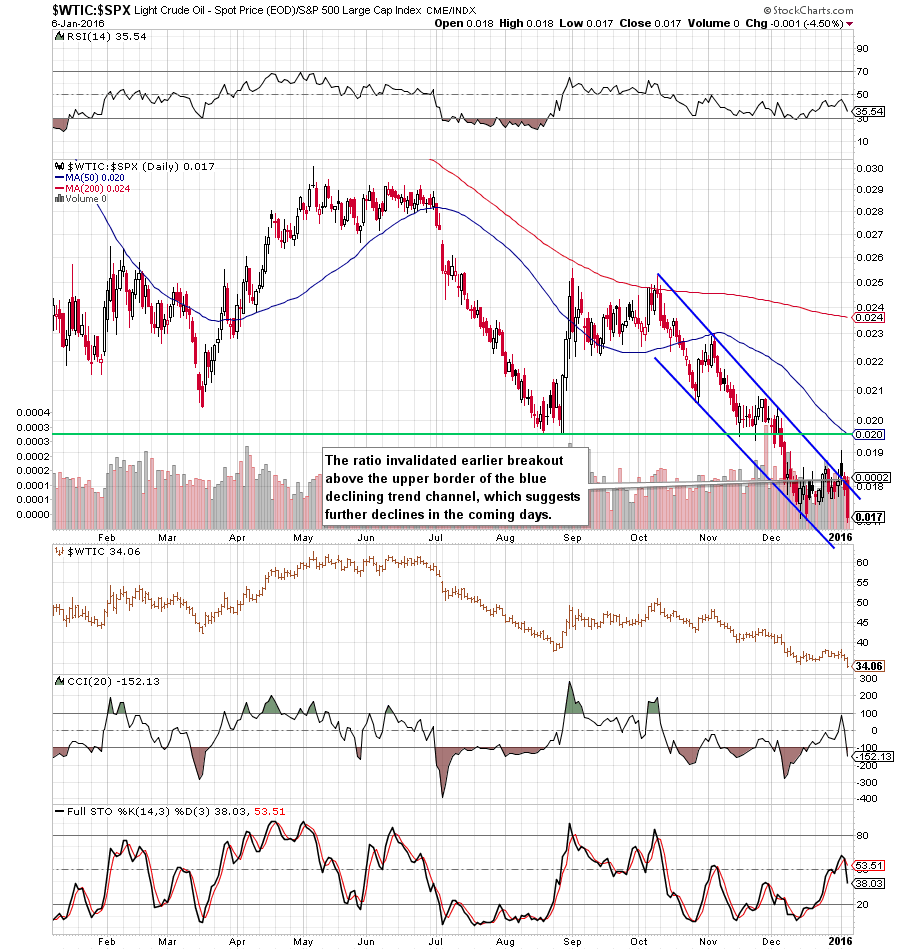
In our yesterday’s Oil Trading alert, we wrote:
Looking at the above chart, we see that the ratio invalidated earlier breakout above the upper border of the blue declining trend channel, which is a negative signal that suggests further deterioration in the coming days. But what does it mean for the commodity? As you see on the chart, lower values of the ratio have corresponded to lower prices of light crude in previous months. Therefore, in our opinion, another downward move in the ratio will trigger further deterioration in crude oil in near future (especially when we factor in a sell signal generated by the Stochastic Oscillator).
On the daily chart, we see that yesterday’s price action pushed the ratio lower, which approached it to the Dec low. Although the ratio could rebound from here, the current position of the indicators suggests that we’ll see further deterioration in the coming days. If we see such price action, the initial downside target would be the lower border of the blue declining trend channel (in this case, we’ll also see lower values of crude oil).
What could happen if the ratio breaks under this important support? Let’s examine the monthly chart and find out.
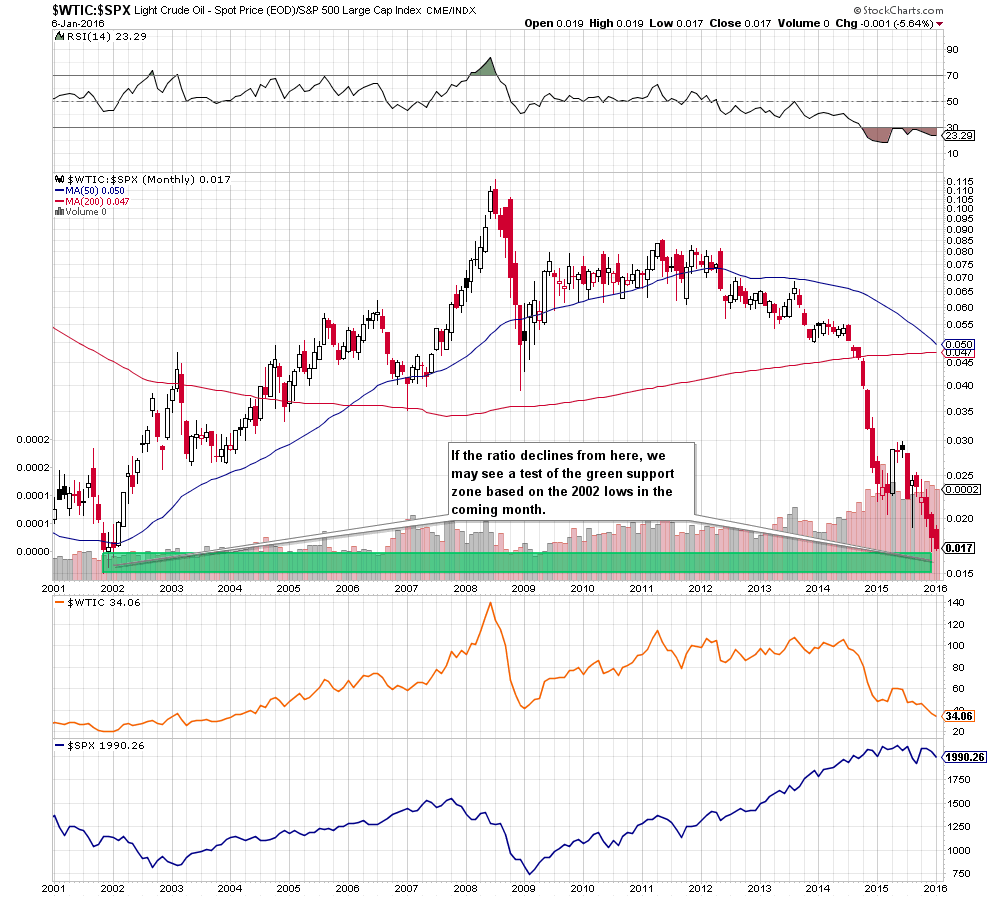
As you see on the long-term chart, if the ratio extends losses, we may see a test of the green support zone based on the 2002 lows in the coming month (and another downswing in black gold).
Non-USD Crude Oil Price
Know the situation for the above ratios, let’s move on to the non-USD (WTIC:UDN ratio) chart of crude oil. As a reminder, UDN is the symbol for the PowerShares DB US Dollar Index Bearish Fund, which moves in the exact opposite direction to the USD Index. Since the USD Index is a weighted average of the dollar's exchange rates with world's most important currencies, the WTIC:UDN ratio displays the value of crude oil priced in "other currencies".
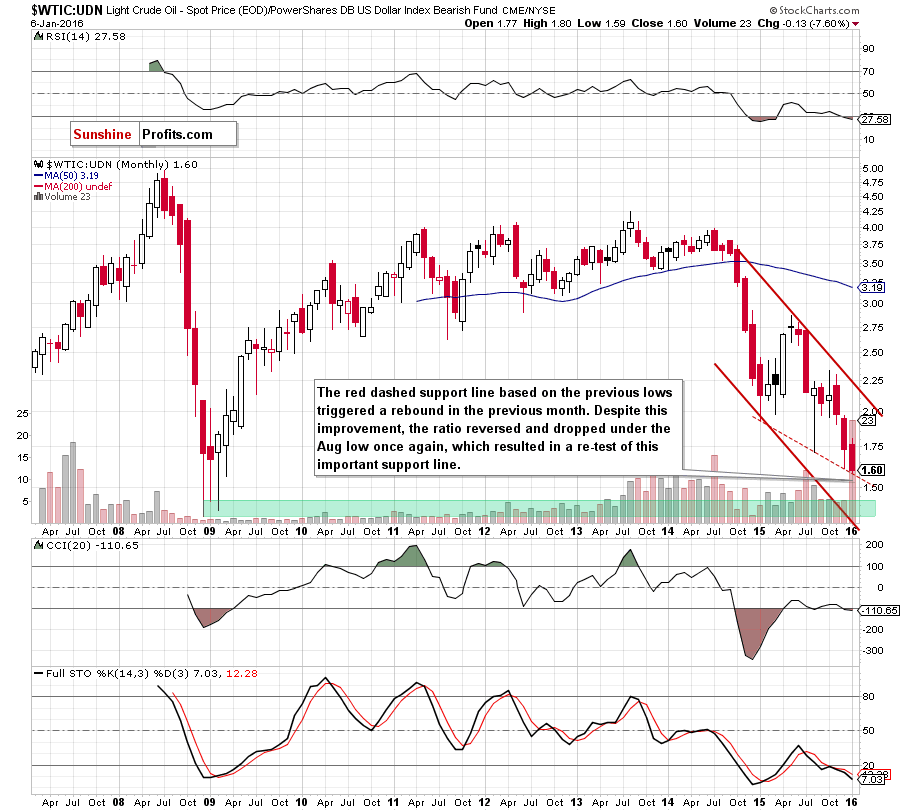
From the long-term perspective, we see that although the red dashed support line (based on the previous lows) triggered a rebound in the recent weeks, the ratio reversed and dropped below the Aug low, which translated into a re-test of this important support. Taking into account, the recent price action, we could see another rebound from here. Nevertheless, a sell signal generated by the Stochastic Oscillator is still in play, supporting oil bears and another downswing. If we see such price action, the next downside target would be the Dec 2008 low of 1.34.
Scenarios
Just like a month ago, today’s Oil Investment Update includes scenarios of what could happen in the coming weeks. Naturally, we will continue to monitor the market in the coming days and if anything invalidates our long-term outlook we will send you an additional message.
- Bullish scenario
If crude oil bounces off the support zone created by the neck line of the head and shoulders formation (marked on the weekly chart) and the 2009 low, we’ll see a rebound and an increase to at least $38.39 (the Jan high). If this resistance is broken, the next upside target would be the barrier of $40 or even the late Nov highs of $43.30-$43.36. - Bearish scenario
If the commodity extends losses, and broke below the 2009 low of $33.55, we’ll see a drop to around $32, where the lower border of the red declining trend channel (marked on the daily chart) is. If it is broken, the commodity will test the psychological barrier of $30. If oil bears manage to push light crude below it, we may see a drop to around $25.
Summary
While it’s still possible that we will see a corrective upswing in the coming days, it seems much more likely that crude oil will move lower in the coming weeks (and quite likely – days). The key thing about the crude oil market is that once it breaks even lower, there is no strong support until the $25 level. Consequently, the $25 level is our next target level for crude oil. Therefore, even though not much time passed since we entered the current trade and it’s already significantly profitable, it seems that the profits will be even bigger before this trade is over.
Very short-term outlook: bearish
Short-term outlook: bearish
MT outlook: bearish
LT outlook: mixed with bearish bias
Trading position (our opinion): Short positions (with a stop-loss order at $39.12) are justified from the risk/reward perspective. We will keep you – our subscribers – informed should anything change.
This completes this month’s Oil Investment Update. Our next Oil Investment Update is scheduled for Thursday, Feb 4, 2016. Oil Trading Alerts subscribers will additionally receive similar but shorter alerts on a daily basis (or more than once a day when the situation requires it). You – Oil Investment Updates subscribers – will receive short Investment Alert messages should the outlook for the medium or long term change before the next Update is posted.
Thank you.
Nadia Simmons
Forex & Oil Trading Strategist
Oil Investment Updates
Oil Trading Alerts

