

In our previous Oil Investment Update, we wrote the following:
(…) If crude oil moves higher and breaks above the key resistance zone created by the 38.2% Fibonacci retracement (…), we may see an increase to around $50, where the psychologically important barrier, the 50% Fibonacci retracement (…) and the long-term red declining resistance line (based on the Sep 29, 2014 and Jun 15 weekly opening prices - marked on the weekly chart) are.
Looking at the charts from today’s point of view, we see that the situation developed in line with the above scenario and crude oil hit the Oct high of $50.92. Despite this short-lived improvement, oil bulls didn’t manage to hold gained levels as ongoing worries over the supply glut weighed on investors’ sentiment. At the beginning of the month, the combination of mixed economic data from China and a record-high production (which hit a post-Soviet record of 10.78 million barrels per day) in Russia in Oct. pushed light crude lower. Additionally, Wednesday’s ADP report showed that U.S. non-farm private employment rose by 182,000 last month, beating expectations for an increase of 180,000. Additionally, the U.S. Commerce Department said that the trade deficit declined to $40.81 billion in September also beating analysts’ forecasts. On top of that the Institute of Supply Management showed that its non-manufacturing PMI rose to 59.1 last month well above forecasts of 56.5. Thanks to these bullish numbers, the U.S. dollar extended gains, making crude oil less attractive for buyers holding other currencies. On top of that, the U.S. Energy Information Administration reported that crude oil inventories increased by 2.847 million barrels in the week ended October 30, which pushed the commodity lower. As a result, light crude moved away from the key resistance lines and closed the day under $47. What’s next? Let’s jump right into charts (chart courtesy of http://stockcharts.com) to find the answer.
Crude Oil
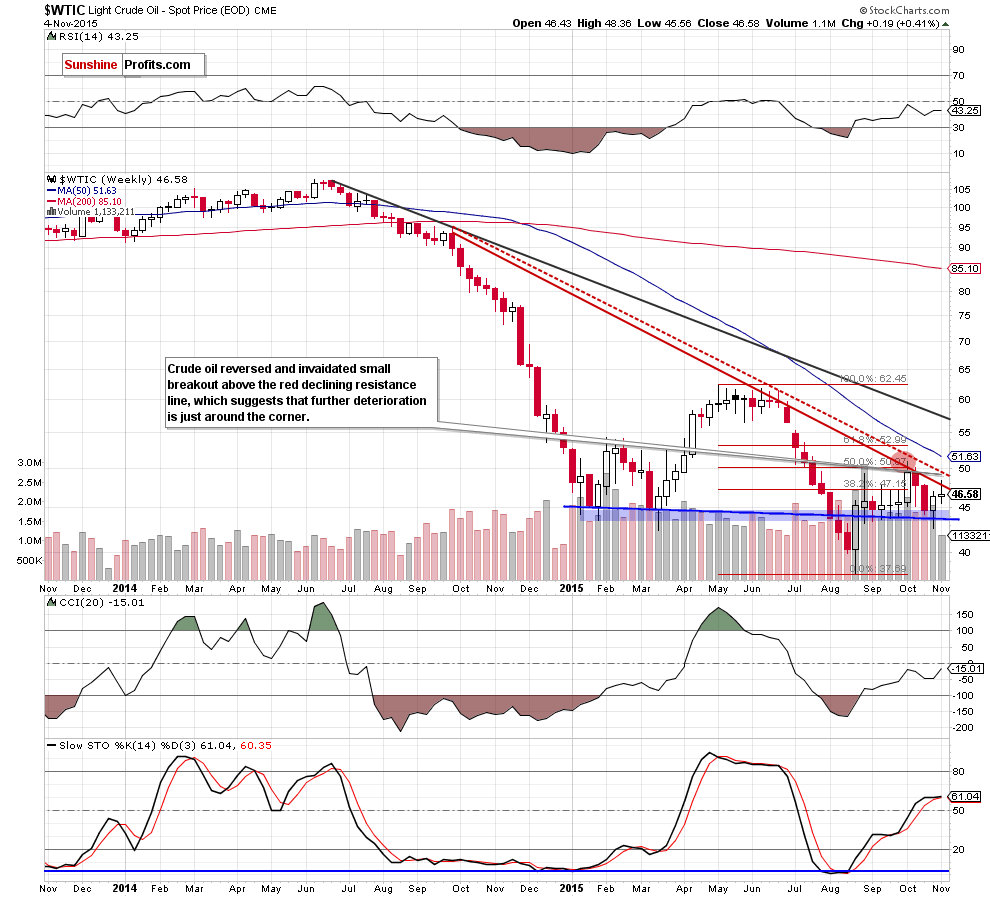
Looking at the weekly chart we see that although crude oil dropped below the blue support line in the previous week, oil bulls managed to stop their opponents, which resulted in an invalidation of the breakdown under the blue support area. This positive event triggered further improvement and light crude increased to the red declining resistance line earlier this week. Despite this upward move, this key resistance line was strong enough to stop further rally (similarly to what we saw in the previous month), which resulted in a pullback. With this downswing, light crude invalidated small breakouts above the red line (a bearish signal), which suggests further deterioration.
How low could the commodity go? In our opinion, the initial downside target would be the blue support line (currently around $43.81). If this key support is broken, we’ll likely see an acceleration of declines and a drop to (at least) $40.57-$40.86, where the next support area (created by the 76.4% and 78.6% Fibonacci retracement levels) is. If this support is broken, we’ll see a test of the Aug lows.
Did recent moves have any impact on the long-term chart?
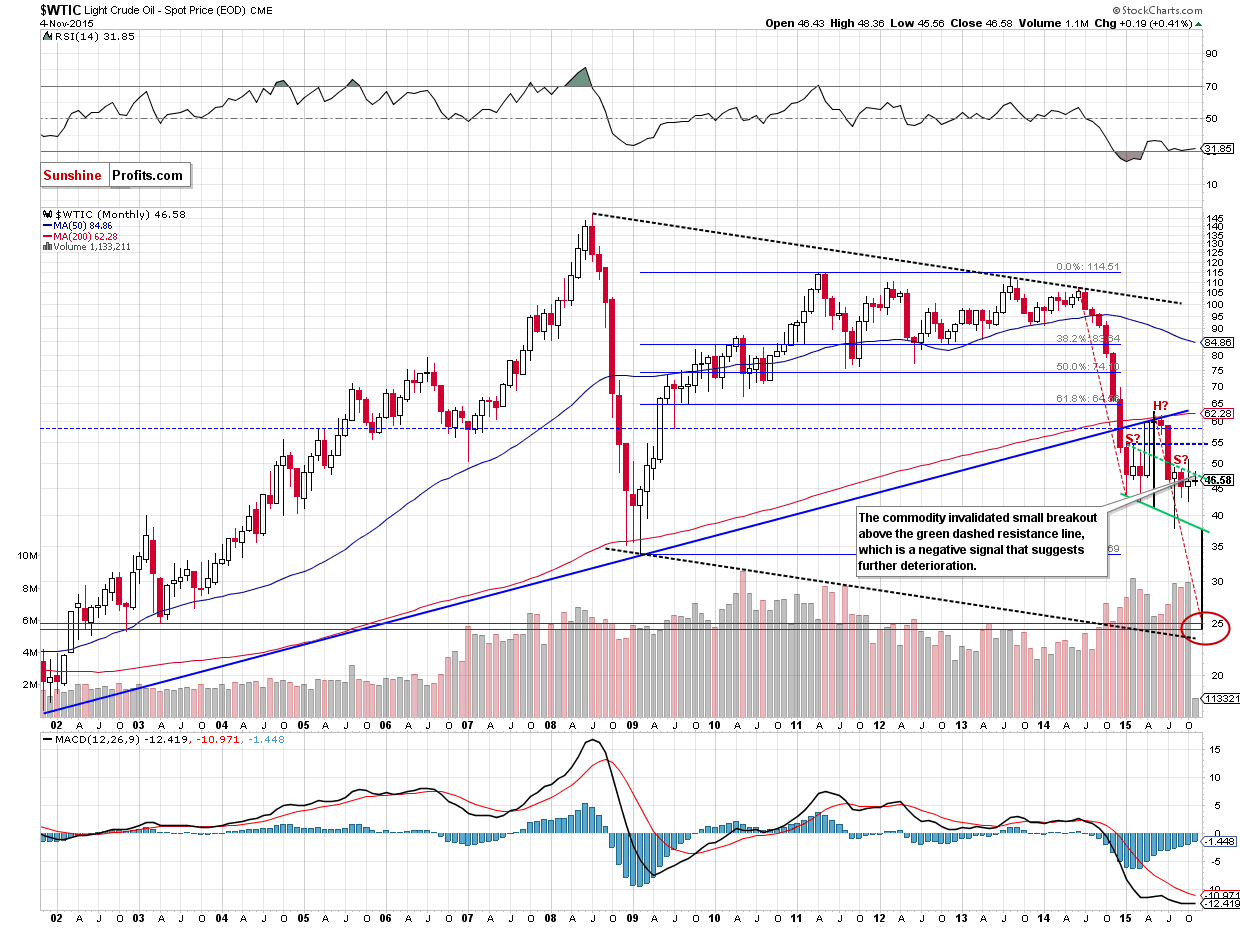
Not really, because as you see on the monthly chart although light crude moved little higher earlier this month, the green dashed resistance line stopped oil bulls, triggering a decline. As a result, the commodity invalidated small breakout above this important resistance line, which suggests that the head and shoulders pattern is underway.
Therefore, we believe that if crude oil extends losses and breaks under the green support line (the neck line of the formation), we’ll see not only fresh 2015, but also further deterioration, which could took the commodity even to $25.
Why? We believe that the best answer to this question will be the quote from our Oil Trading Alert posted on Sep 9:
- The breakdown below the key long-term rising support line (marked with blue) was confirmed and verified – this year’s rally didn’t take crude oil back above it – the line proved to be strong resistance. This by itself doesn’t imply a target level at a certain point, but it strongly suggests that crude oil has to fall much lower, before the decline is over.
- The symmetry of major declines: the 2008 slide is the only decline that is really similar to the current one, and in order for this similarity to be upheld (history repeats itself to a considerable extent), crude oil would have to move even a bit below $25. On the above chart you can see that in the form of the declining dashed black lines.
- The symmetry between the 2014 slide and the (likely) current decline. This year we have definitely seen some kind of consolidation (which might still turn out to be a bottom, but that is unlikely in our view) and the move that follows a consolidation is very often similar to the one that preceded it. If you look at the red dashed declining lines on the above chart you’ll notice that for the previous decline to repeat, crude oil would have to move to about $25.
- Speaking of the consolidation, it’s taking the form of a head-and-shoulders pattern and once / if the pattern is completed, we will have a pattern-based target at around $25. The reason is that once price breaks below the “neck level”, it’s likely to decline as much as the size of the “head” in the pattern.
- The late-2002 and 2003 bottoms create strong support at those levels.
The amount of signals that points to $25 as the most likely target is uncanny, which makes it quite reliable.
Yes, there also are the 2008 and 2009 lows, but generally not much (if anything) confirms them as a major target, so they might not be able to generate anything more than a short-lived bounce (if anything at all).
Please keep in mind that the above is what we believe as most likely based on today’s prices.
Summing up, the key long- and medium-term resistance lines triggered a correction of the previous upward move, which suggests that further deterioration in the coming day(s) is more likely than not and short positions continue to be justified from the risk/reward point of view.
Having discussed the situation in crude oil, let’s examine the NYSE Arca Oil Index (XOI) to find out what the current outlook for oil stocks is.
Oil Stocks
A month ago, we wrote the following:
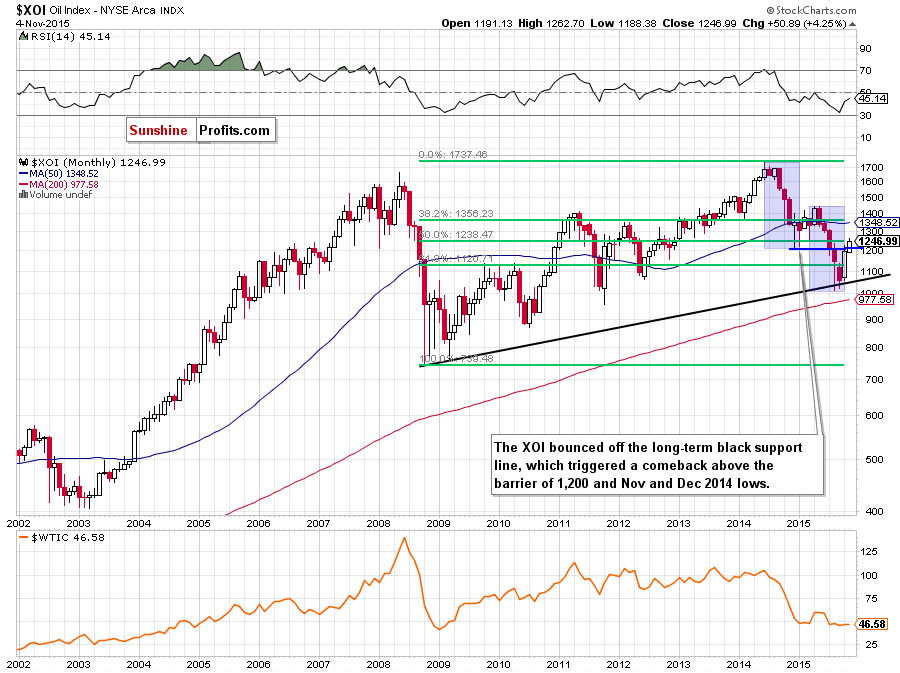
(…) oil stocks dropped to the long-term black support line based on the Oct 2008 and Mar 2009 lows once again. In Aug, and also a month ago, this solid support was strong enough to trigger a rebound, which suggests that this key support line will likely stop oil bears once again. On top of that, the Apr-Aug decline is almost the same as declines between June and December 2014, which increases the probability of reversal and higher values of the XOI in the coming weeks (or even months).
Looking at the monthly chart, we see that the situation developed in line with the above scenario and oil stocks rebounded sharply in the previous month, gaining over 13%. Earlier this month, the XOI extended gains and came back above the barrier of 1,200 and the Nov and Dec 2014 lows, which suggests further improvement.
But will we see such price action? Let’s focus on the medium-term chart and look for more clues about future moves.
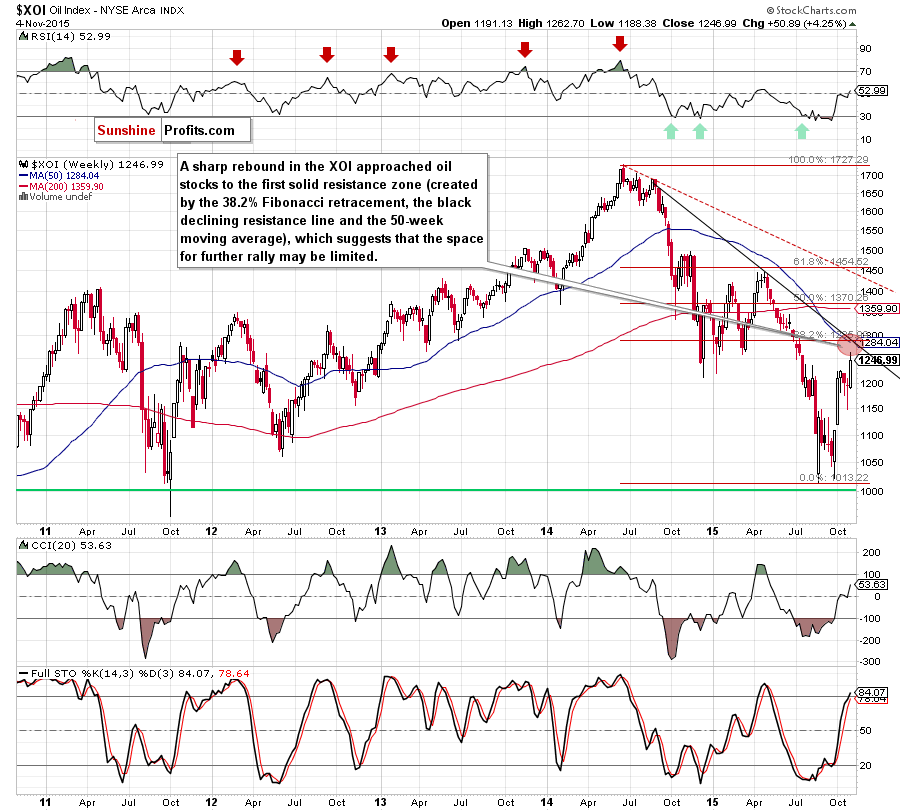
From this perspective, we see that oil stocks bounced off the support zone created by the Aug low and the psychologically important barrier of 1,000, which encouraged oil bulls to act and resulted in an increase above 1,250. With this upward move, the XOI approached the first solid resistance zone (created by the 38.2% Fibonacci retracement, he black declining resistance line and the 50-week moving average), which suggests that the space for further rally may be limited and reversal in the coming week(s) should not surprise us.
Additionally, when we take a closer look at the daily chart below, we’ll see that there are also very short-term factors, which reinforces the bearish scenario.
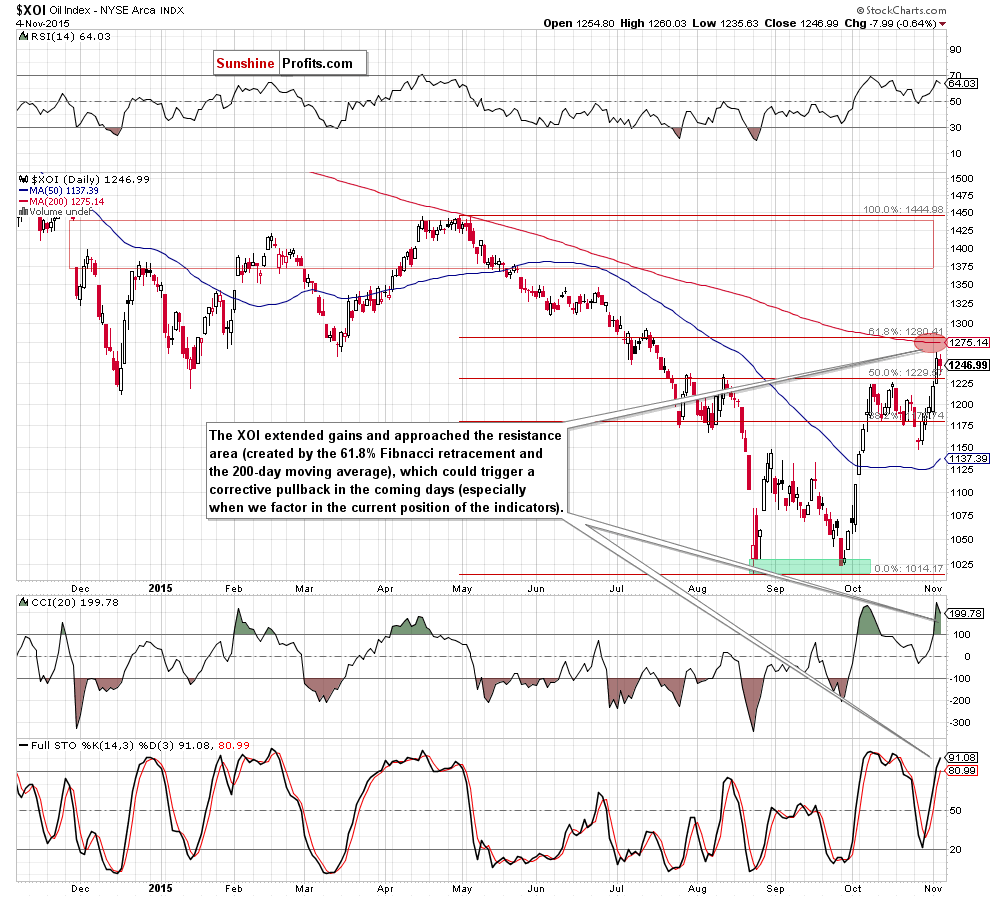
As you see on the daily chart, the XOI approached the resistance area (created by the 61.8% Fibonacci retracement and the 200-day moving average), which could trigger a corrective pullback in the coming days (especially if the CCI and Stochastic Oscillator generate sell signals).
Summing up, oil stocks rebounded sharply and approached the first solid resistance zone, which could trigger a corrective pullback in the coming days (or even weeks). If this is the case, and oil stocks reverse, the initial downside target would be around 1,171, where the 38.2% Fibonacci retracement (based on the Sep-Nov rally) currently is. If it is broken, the next target for oil bears would be the bottom of the previous correction (at 1,147).
Ratio Analysis
Once we know the current situation in crude oil and oil stocks, let’s focus on the relationship between them. What can we infer from the chart below?
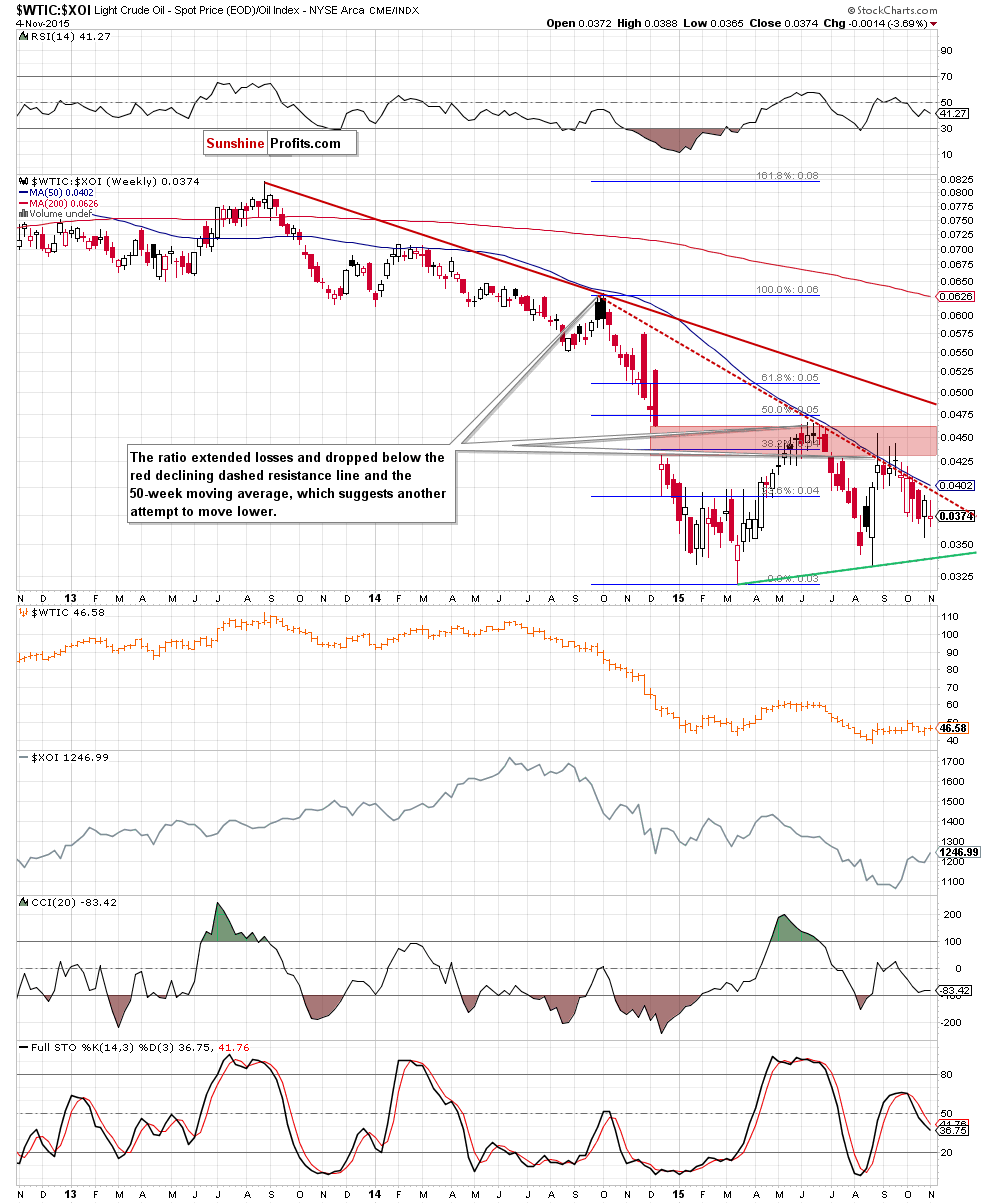
Looking at the above chart, we see that the red gap in combination with the 38.2% Fibonacci retracement (based on the Oct-Mar declines) triggered a decline, which took the ratio below the red dashed declining resistance line and the 50-week moving average (at the same time, light crude moved lower and hit the Oct low of $42.58). The last two weeks brought a small rebound (in the ratio and crude oil), but the ratio still remains under the key resistances, which suggests that even if we see another upswing from here, the space for gains is limited and reversal is just around the corner.
What does it mean for crude oil? Based on price action that we have seen in the past, we think that lower values of the ratio will translate to a pullback in light crude – similarly to what we saw in June, at the turn of Sep and Oct and also in Feb 2014.
Having said the above, let’s analyze the oil-to-gold ratio.
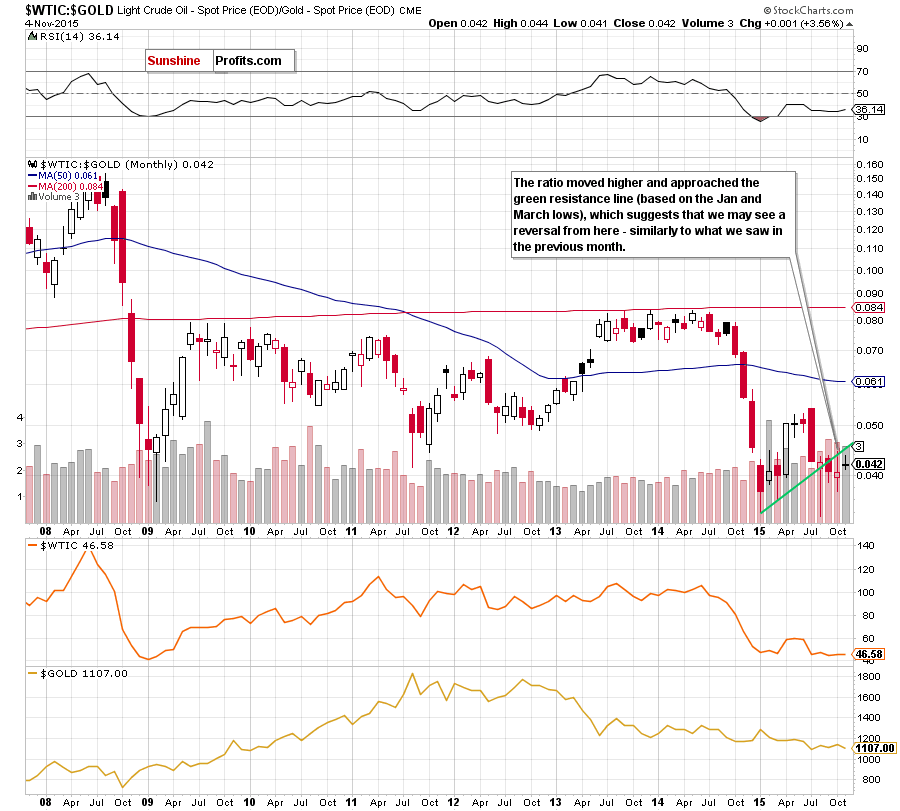
Looking at the monthly chart, we see that the ratio extended the previous month’s rebound and approached the green resistance line (based on the Jan and March lows), which suggests that we may see a reversal from here – similarly to what we saw in Oct.
Are there any other factors that could reinforce this scenario? Let’s examine the weekly chart and find out.
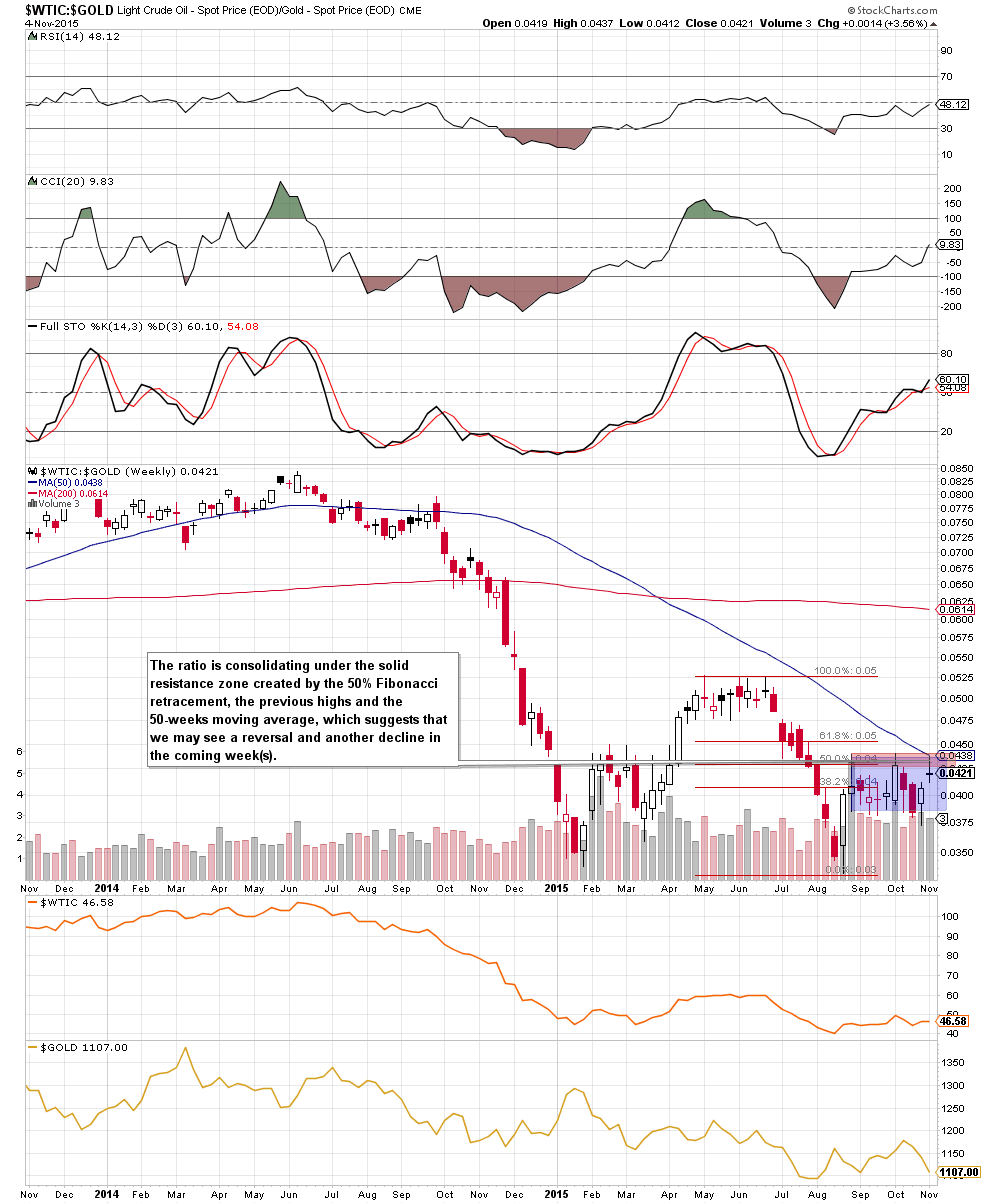
From this perspective, we see that the ratio is consolidating under the solid resistance cone created by the 50% Fibonacci retracement, the previous highs and the 50-week moving average, which suggests that we may see a reversal and another decline in the coming week(s) – especially when we factor in the situation in the short term.
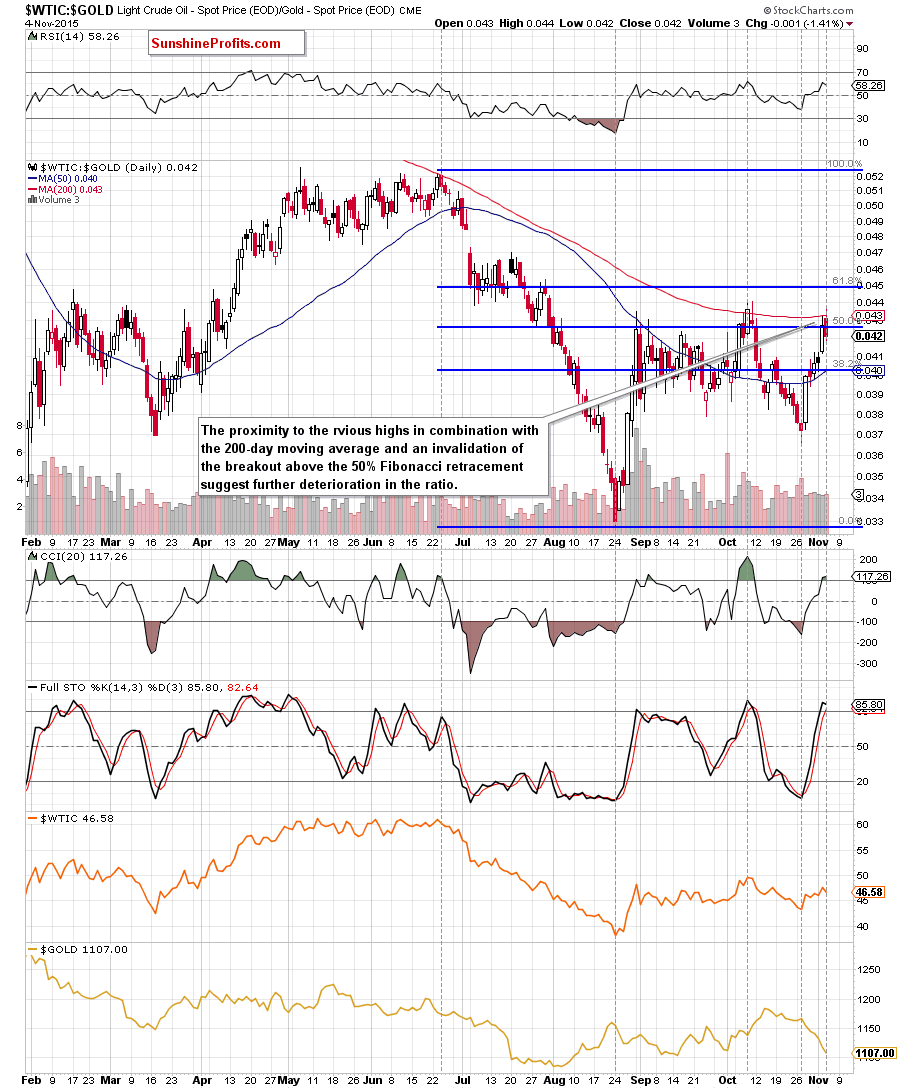
As you see on the daily chart, the proximity to the previous highs in combination with the 200-day moving average triggered a decline, which invalidated earlier breakout above the 50% Fibonacci retracement. At this point, it is worth noting that we saw similar situation in mid-Oct. Back then such price action translated to sharp declines and resulted in a drop to fresh Oct lows, which suggests that we may see similar deterioration in the coming days/weeks – especially when we factor in the current position of the indicators (the CCI and Stochastic Oscillator are very close to generating sell signals). If this is the case, and the ratio declines from here, we’ll also see a reversal and lower values of crude oil – similarly to what we saw in previous months.
What about gold? Unfortunately, the relationship between the ratio and the gold does not give us such clear guidance as in the case of oil. As you see, there were periods of time, when gold moved higher/lower in line with light crude, however, recently both commodities have moved in opposite directions and it is hard to how gold will react to the reversal in the ratio. Therefore if you want to have a more complete picture of gold (and the precious metal sector) we encourage you to sign up for Gold & Silver Trading Alerts or the All-Inclusive Package that includes it.
Finishing this section, we would like to take a closer look at the relationship between crude oil and the USD Index as the U.S. dollar is one of very important factors that affect the price of the commodity.
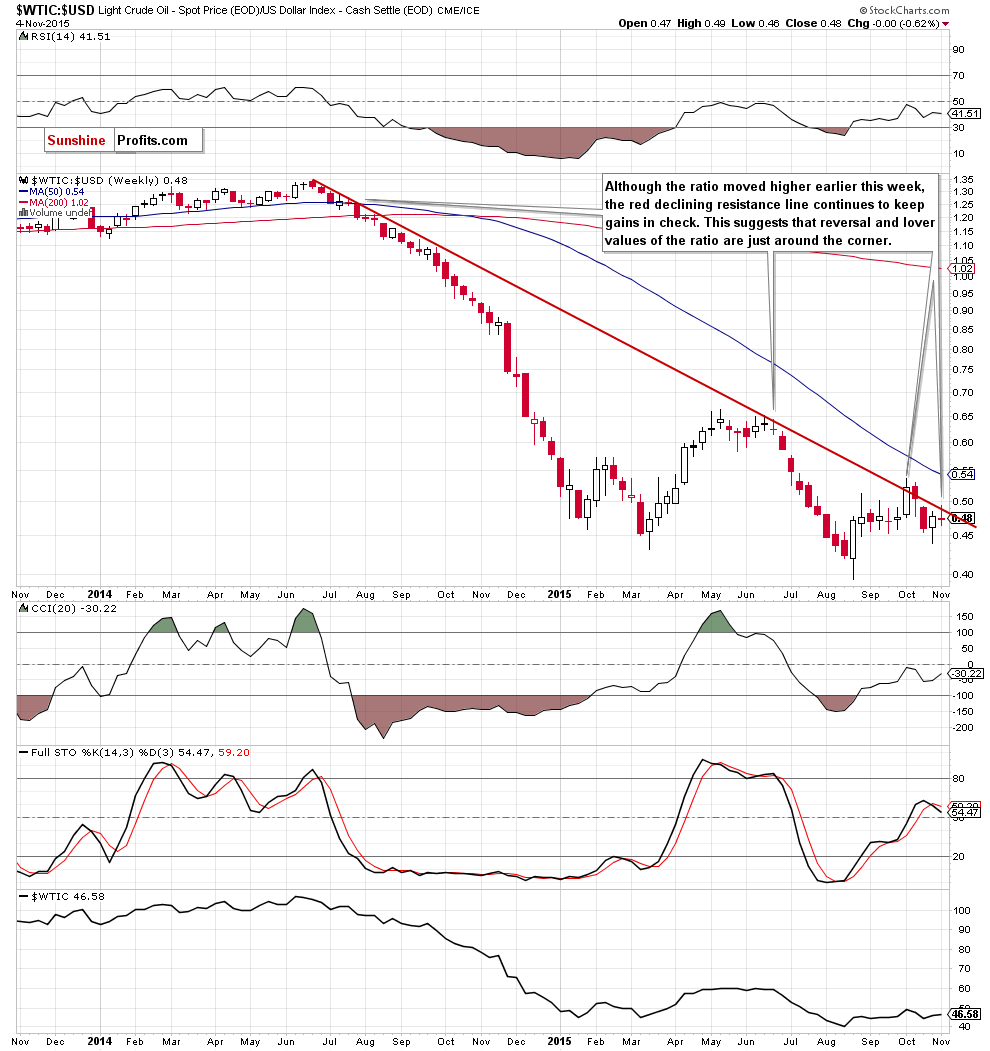
Looking at the above chart, we see that although the ratio moved higher earlier this week, the red declining resistance line continues to keep gains in check. As you see, many times in the past this key resistance line was strong enough to stop further improvement (in Aug and Sept 2014, in Jun and Oct 2015), which suggests that reversal and lower values of the ratio are just around the corner. If this is the case, and the ratio declines from here, such price action will translate to lower prices of crude oil – similarly to what we saw in previous months.
Non-USD Crude Oil Price
Know the situation for the above ratios, let’s move on to the non-USD (WTIC:UDN ratio) chart of crude oil. As a reminder, UDN is the symbol for the PowerShares DB US Dollar Index Bearish Fund, which moves in the exact opposite direction to the USD Index. Since the USD Index is a weighted average of the dollar's exchange rates with world's most important currencies, the WTIC:UDN ratio displays the value of crude oil priced in "other currencies".
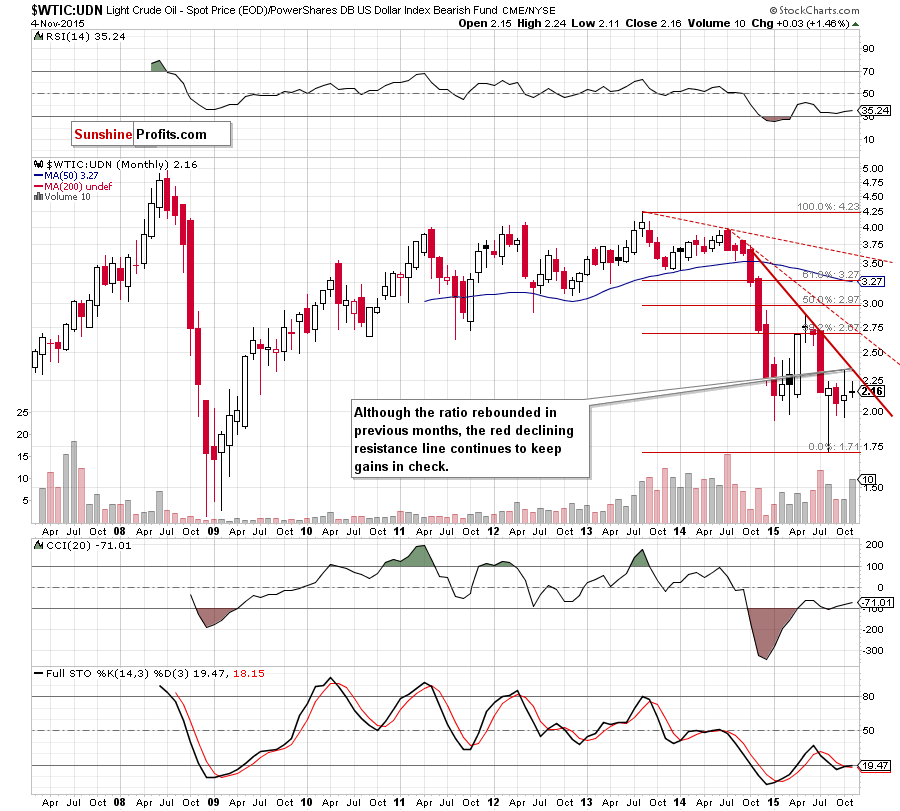
From the long-term perspective, we see that although the ratio moved higher in the previous month, the red declining resistance line continues to keep gains in check.
Will the medium-term picture give us more clues about future moves? Let’s check.
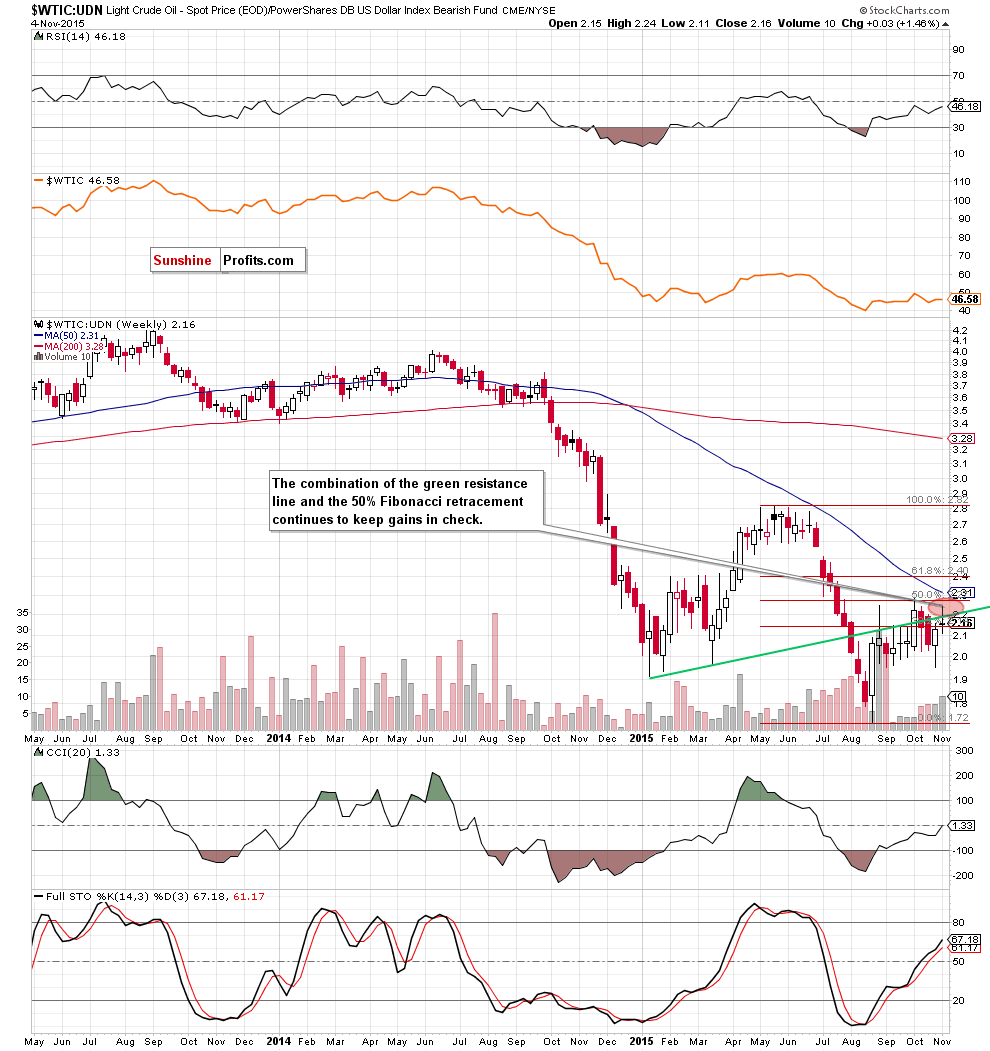
On the weekly chart, we see that the previously-broken green support/resistance line (based on the Jan and Mar lows) continues to keep gains in check. Taking this fact into account, we believe that as long as there is no weekly close above this important line another attempt to move lower is more likely than not (even if oil bulls try to re-test it once again). If we see such price action, it will translate to lower values of light crude in the coming week (s).
Scenarios
Just like a month ago, today’s Oil Investment Update includes scenarios of what could happen in the coming weeks. Naturally, we will continue to monitor the market in the coming days and if anything invalidates our long-term outlook we will send you an additional message.
- Bullish scenario
If crude oil moves higher and breaks above the key resistance lines (the green dashed line and the long-term red declining resistance line (based on the Sep 29, 2014 and Jun 15 weekly opening prices - marked on the weekly chart), we’ll see a test of the red dashed declining resistance line (based on the Sep 29, 2014 and Jun 2 highs), the barrier of $50, the 50% Fibonacci retracement (based on the May-Aug declines) and the Oct high. If this resistance area is broken, the next target for oil bulls would be around $53 (the 61.8% Fibonacci retracement based on the May-Aug declines) or even around $55.34-$56.50, where the Jun-Jul gap is. - Bearish scenario
If the commodity declines below the blue support zone (based on the Jan lows) and the blue support line, the current declines will accelerate and we’ll see a test of $40. If it is broken, the next target for oil bears would be the Aug low of $37.75 or even around the support zone based on the Dec 2008 and Jan 2009 lows (around $35.13-$35.52).
Summary
Although crude oil extended gains in the previous month, the combination of the barrier of $50, the 50% Fibonacci retracement (based on the May-Aug declines) and the 200-day moving average encouraged oil bears to act, which resulted in a small drop below the support zone based on the Jan lows and the blue support line (marked with blue on the weekly). Despite this negative signal, light crude reversed, invalidating earlier breakdown and climbed to the key resistance lines. Taking this fact into account, and combining it with a potential head and shoulders formation (marked on the long-term chart) and the current position of the above ratios, which remains under important resistance levels (in all cases their reversals and declines will translate to lower values of crude oil), we believe that reversal and lower prices of light crude are just around the corner (especially if the commodity successfully drops under key support zone).
Very short-term outlook: bearish
Short-term outlook: bearish
MT outlook: bearish
LT outlook: mixed with bearish bias
Trading position (our opinion): Short positions with a stop-loss order at $54.12 (yes, that far as the medium-term outlook is unlikely to change as long as crude oil stays below the declining medium-term resistance line) and initial (!) target price at $35.72 are justified from the risk/reward perspective.
This completes this month’s Oil Investment Update. Our next Oil Investment Update is scheduled for Thursday, Dec 3, 2015. Oil Trading Alerts subscribers will additionally receive similar but shorter alerts on a daily basis (or more than once a day when the situation requires it). You – Oil Investment Updates subscribers – will receive short Investment Alert messages should the outlook for the medium or long term change before the next Update is posted.
Thank you.
Nadia Simmons
Forex & Oil Trading Strategist
Oil Investment Updates
Oil Trading Alerts

