

The overall situation in the oil market hasn’t changed much since our previous Oil Investment Update was posted. Looking at the charts from today’s point of view we can summarize Sep in one simple sentence: a prolonged consolidation between Jan lows and Aug high. In the previous month light crude lost 5.86%, but there was no significant breakdown, which could accelerate declines. What’s interesting, although the U.S. Energy Information Administration reported that crude oil stocks decreased by 1.9 million barrels for the week ending Sept. 18, extending a 2.1 million barrel drop from a week earlier, we didn’t notice a breakout above the key resistance zone, which could translate to a sharp rally (a negative sign). Additionally, gasoline inventories increased, fuelling worries that such build after the end of summer driving season could translate into high product stocks during autumn months (another negative signal). On top of that, yesterday’s EIA report showed that U.S. crude stockpiles rose by 4.0 million barrels for the week ending on Sept. 25, significantly beating expectations for a 0.5 million drop. In this way, yesterday’s increase halted a two week streak of declines, which raised worries over a supply glut (U.S. crude inventories remain near its highest level at this time of the year in at least 80 years). The report also showed another increase in gasoline inventories (which rose by 3.3 million barrels), which currently are near the upper limit of the average range. At this point it is worth noting that Friday’s Baker Hughes report showed that U.S. oil rigs fell by 4 to 640 in the week ending September 18, which clearly shows that although such small drops trigger one-day rebounds, they don’t have stable and positive impact on crude oil stockpiles. All the above, in combination with ongoing worries over the economic situation in China and the U.S. suggests that fundamental factors will likely support oil bears in the coming weeks.
Will the technical picture of the oil market confirm this scenario? Let’s jump right into charts (chart courtesy of http://stockcharts.com) to find the answer.
Crude Oil
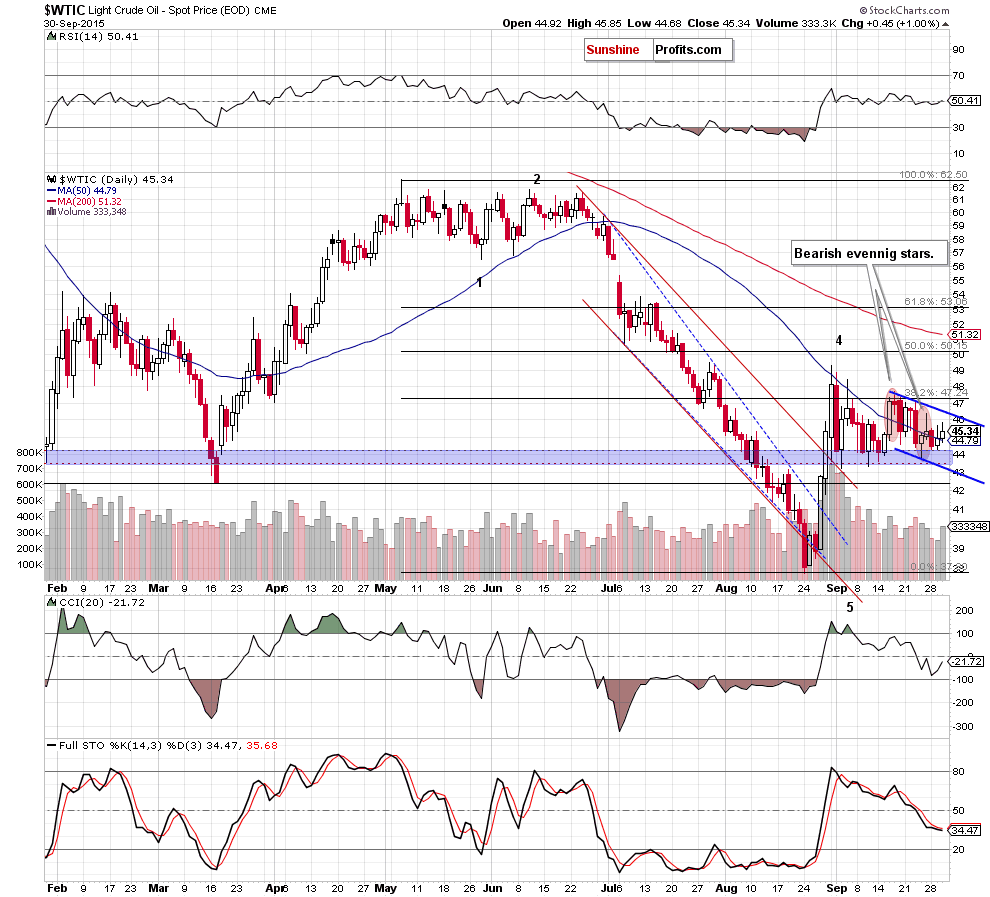
Looking at the daily chart, we see that crude oil bounced off the blue support zone in the previous week for the fourth time, which triggered a small upward move that took the commodity above the 50-day moving average. Additionally, light crude closed yesterday’s session above it, which in combination with the size of volume (it was bigger than day before) suggests that we’ll see a test of the upper border of the declining trend channel (or even the recent highs and the 38.2% Fibonacci retracement if the blue resistance is broken) in the coming day(s).
Did the recent price action have any impact on the medium-term picture?
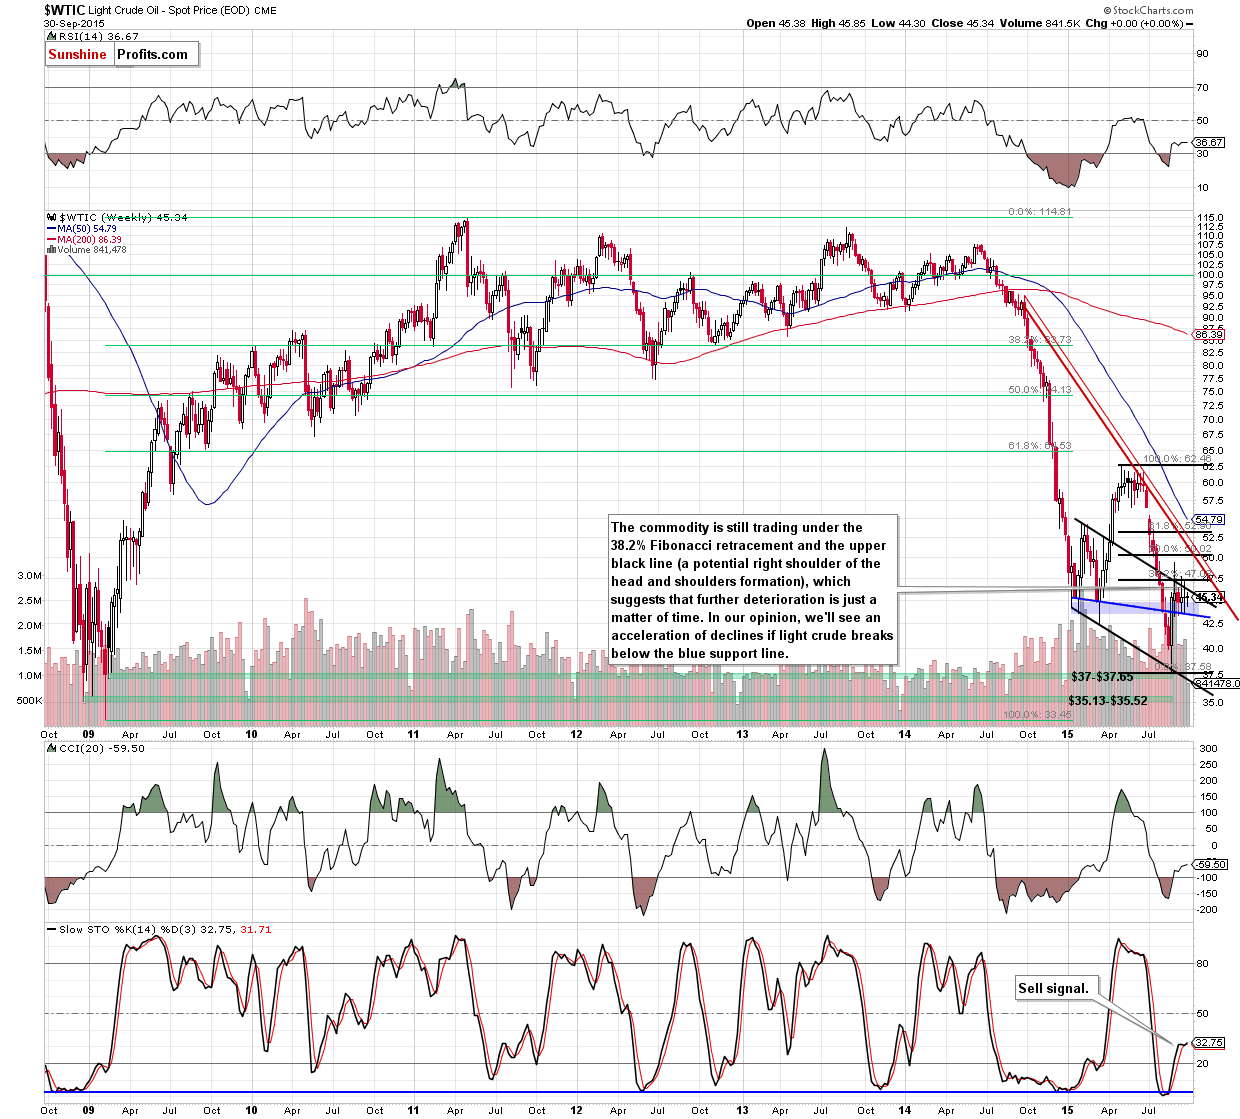
Not really, because as you see on the weekly chart, crude oil is still consolidating between the blue support zone (reinforced by the blue support line) and the key resistance zone based on the 38.2% Fibonacci retracement and the medium-term upper black line (a potential right shoulder of the head and shoulders formation), which successfully keeps gains in check.
Taking all the above into account, we believe that it is still quite likely that crude oil will slide all the way down to more or less $25 dollars. Why? We believe that the best answer to this question will be the quote from our Oil Trading Alert posted on Sep 9:
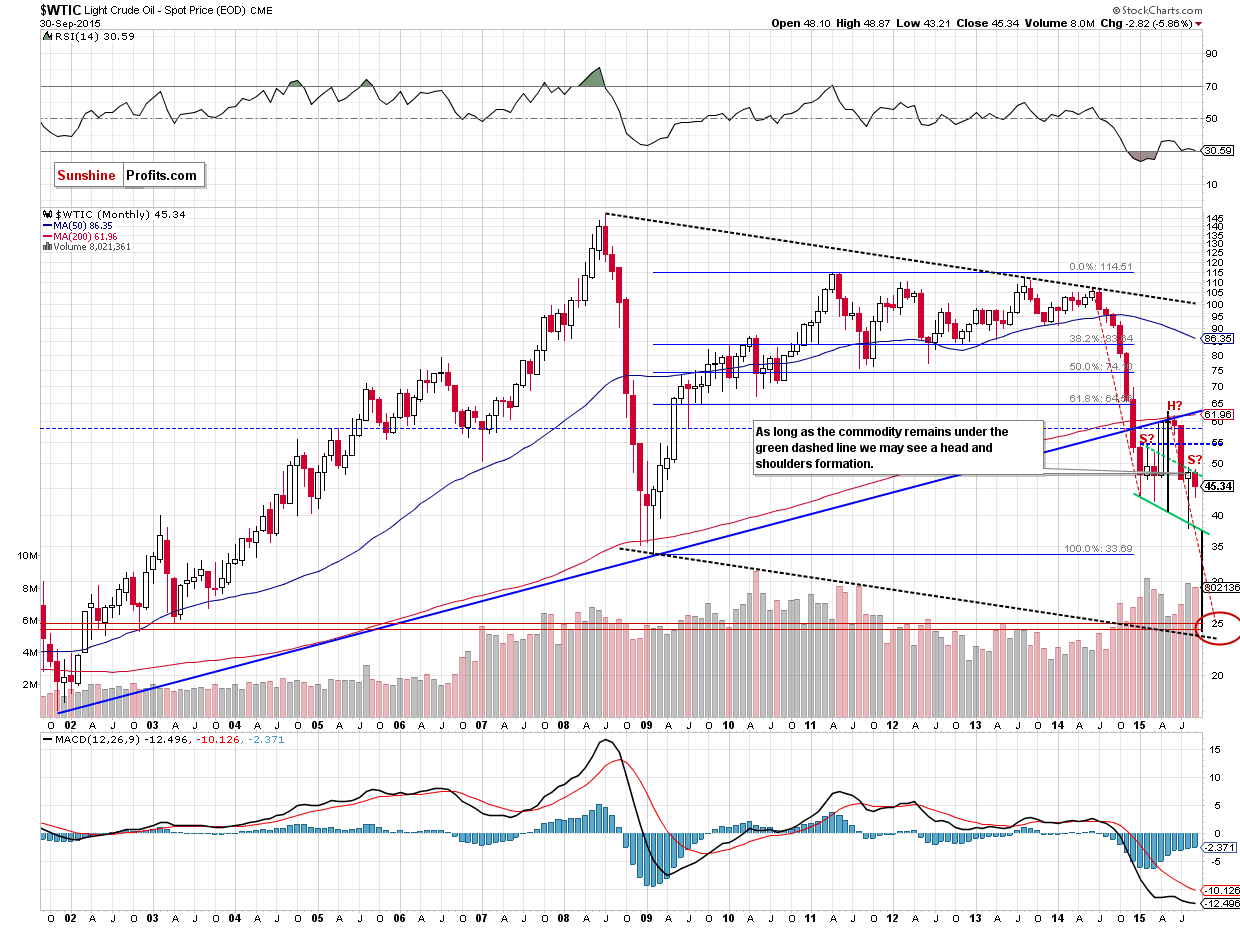
- The breakdown below the key long-term rising support line (marked with blue) was confirmed and verified – this year’s rally didn’t take crude oil back above it – the line proved to be strong resistance. This by itself doesn’t imply a target level at a certain point, but it strongly suggests that crude oil has to fall much lower, before the decline is over.
- The symmetry of major declines: the 2008 slide is the only decline that is really similar to the current one, and in order for this similarity to be upheld (history repeats itself to a considerable extent), crude oil would have to move even a bit below $25. On the above chart you can see that in the form of the declining dashed black lines.
- The symmetry between the 2014 slide and the (likely) current decline. This year we have definitely seen some kind of consolidation (which might still turn out to be a bottom, but that is unlikely in our view) and the move that follows a consolidation is very often similar to the one that preceded it. If you look at the red dashed declining lines on the above chart you’ll notice that for the previous decline to repeat, crude oil would have to move to about $25.
- Speaking of the consolidation, it’s taking the form of a head-and-shoulders pattern and once / if the pattern is completed, we will have a pattern-based target at around $25. The reason is that once price breaks below the “neck level”, it’s likely to decline as much as the size of the “head” in the pattern.
- The late-2002 and 2003 bottoms create strong support at those levels.
The amount of signals that points to $25 as the most likely target is uncanny, which makes it quite reliable.
Yes, there also are the 2008 and 2009 lows, but generally not much (if anything) confirms them as a major target, so they might not be able to generate anything more than a short-lived bounce (if anything at all).
Please keep in mind that the above is what we believe as most likely based on today’s prices.
Summing up, crude oil closed yesterday’s session above the 50-day moving average, which suggests a test of the upper border of the declining trend channel. However, as long as the medium-term resistance levels and sell signals generated by the indicators remain in place, lower values of the commodity are more likely than not. Therefore, short positions continue to be justified from the risk/reward point of view.
Having discussed the situation in crude oil, let’s examine the NYSE Arca Oil Index (XOI) to find out what the current outlook for oil stocks is.
Oil Stocks
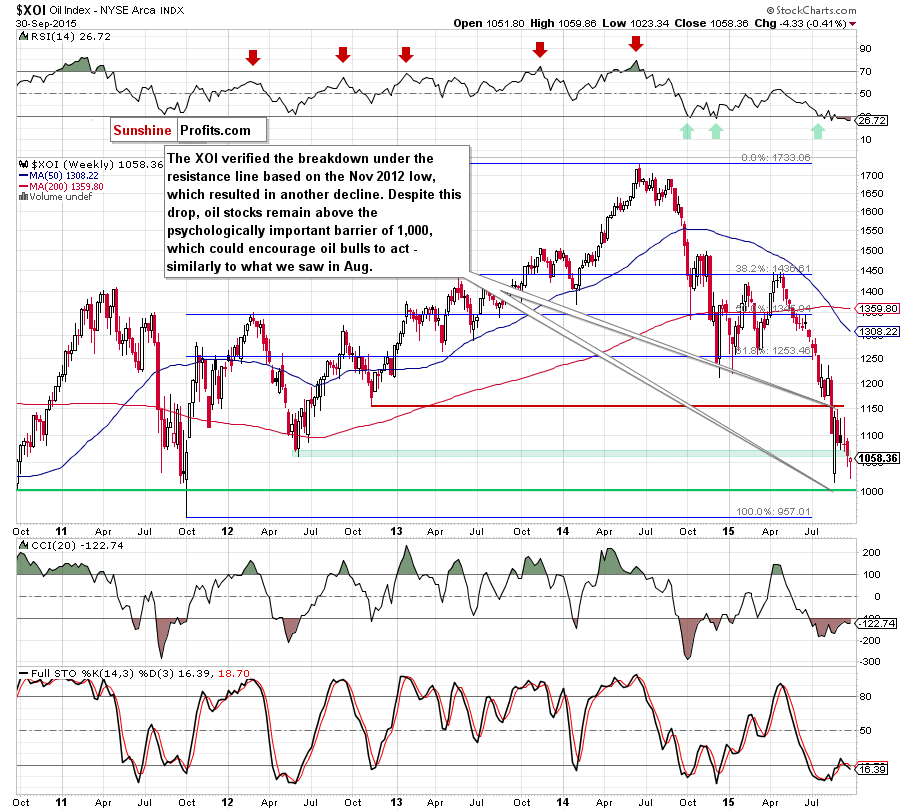
Looking at the weekly chart we see that the XOI verified the breakdown under the red resistance line based on the Nov 2012 low, which resulted in another decline. With the recent downward move oil stocks approached the support zone created by the Aug low and the psychologically important barrier of 1,000, which could encourage oil bulls to act – similarly to what we saw in Aug.
But will we see such price action? Let’s focus on the long-term chart and look for more clues about future moves.
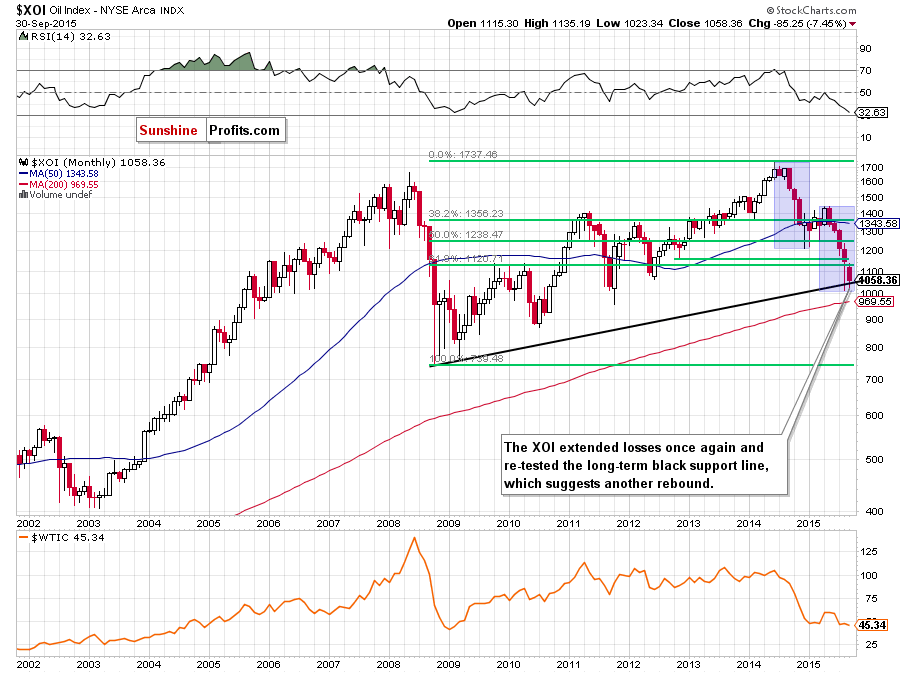
From this perspective we see that oil stocks dropped to the long-term black support line based on the Oct 2008 and Mar 2009 lows once again. In Aug, and also a month ago, this solid support was strong enough to trigger a rebound, which suggests that this key support line will likely stop oil bears once again. On top of that, the Apr-Aug decline is almost the same as declines between June and December 2014, which increases the probability of reversal and higher values of the XOI in the coming weeks (or even months).
Summing up, oil stocks extended losses and re-approached the very important support zone created by the long-term black support line (based on the Oct 2008 and Mar 2009 lows), the Aug low and the barrier of 1,000. This area triggered a sharp rebound a month ago, which suggests that history will repeat itself and we’ll see similar price action in the coming weeks.
Ratio Analysis
Once we know the current situation in crude oil and oil stocks, let’s focus on the relationship between them. What can we infer from the chart below?
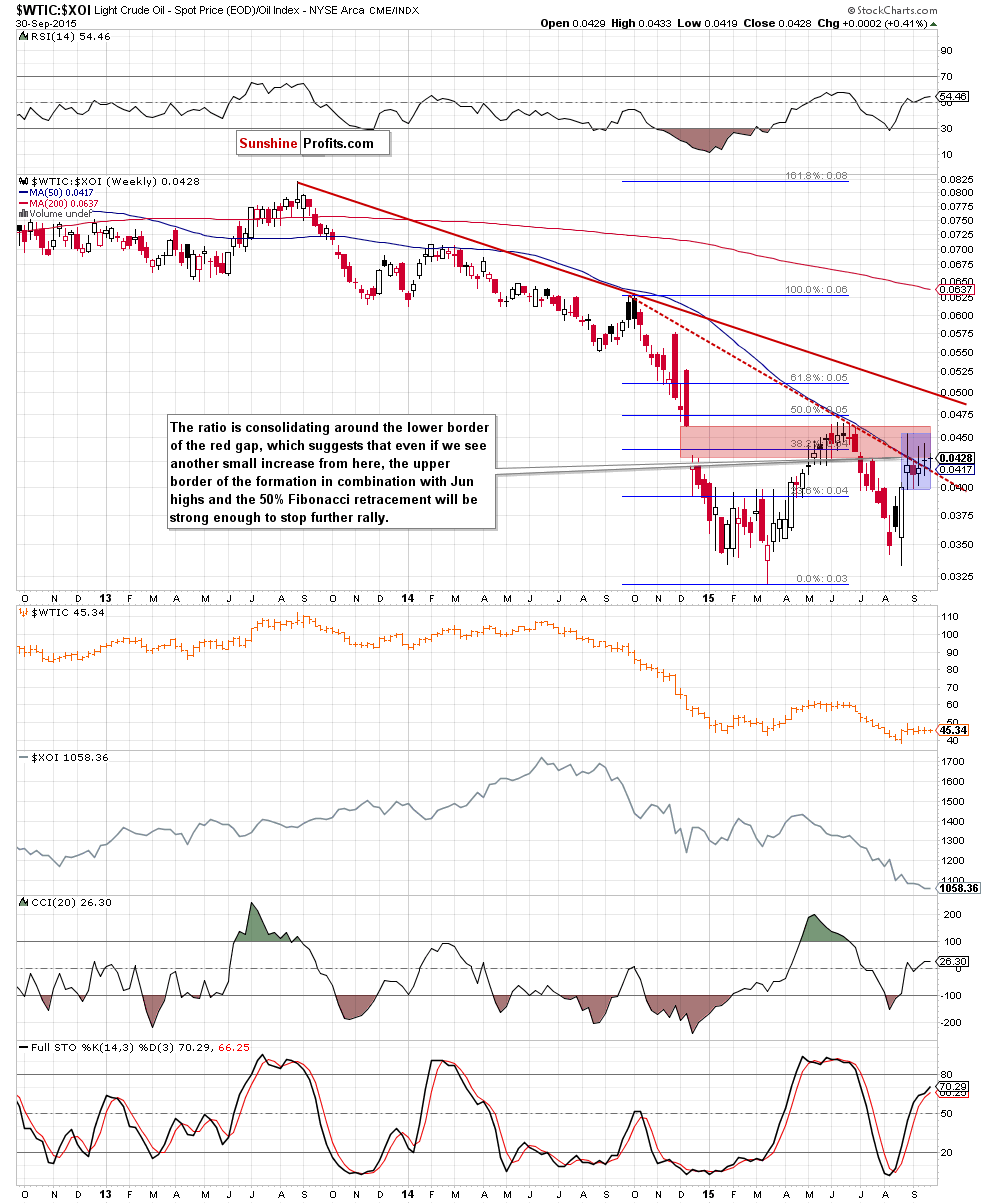
Looking at the above chart, we see that although the ratio climbed above the 50-week moving average, the lower border of the red gap in combination with the 38.2% Fibonacci retracement (based on the Oct-Mar declines) continues to keep gains in check. At this point it is worth noting that even if we see another small increase from here, the solid resistance zone created by the upper border of the formation, the Jun high and the 50% Fibonacci retracement will be strong enough (in our opinion) to stop further improvement and trigger a sizable downward move in the coming week(s).
What does it mean for crude oil? Based on price action that we have seen in the past, we think that lower values of the ratio are just around the corner. If this is the case, and the ratio declines from here, such price action will likely translate to a pullback in light crude – similarly to what we saw in June, at the turn of Sep and Oct and also in Feb 2014.
Having said the above, let’s analyze the oil-to-gold ratio.
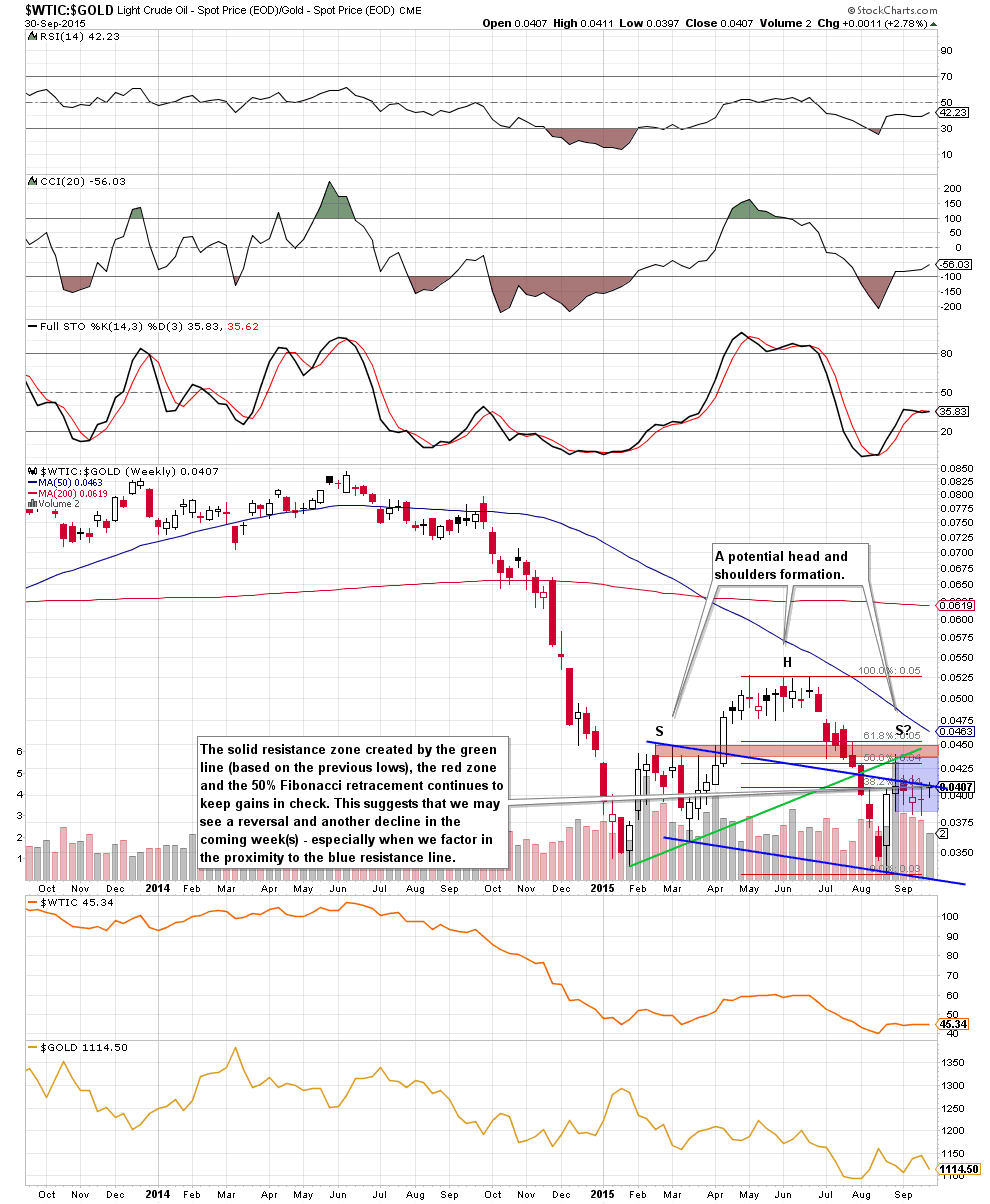
Looking at the weekly chart we see that the solid resistance zone created by the green line (based on the Jan and Mar lows), the red zone (based on Feb highs) and the 50% Fibonacci retracement (based on the May-Aug declines) continues to keep gains in check. On top of that, the ratio is still trading under the blue resistance line (parallel to the line based on the Mar and Aug lows), which suggests that we may see a reversal and another decline from here in the coming week(s). Additionally, when we take a closer look at the above chart, we can notice a potential head and shoulders pattern, which increases the probability that this formation will encourage oil bears to act. If this is the case, and the ratio moves lower from here, crude oil will likely also reverse – similarly to what we saw in the past.
Finishing our commentary on this ratio, we would like to draw your attention to the monthly chart below.
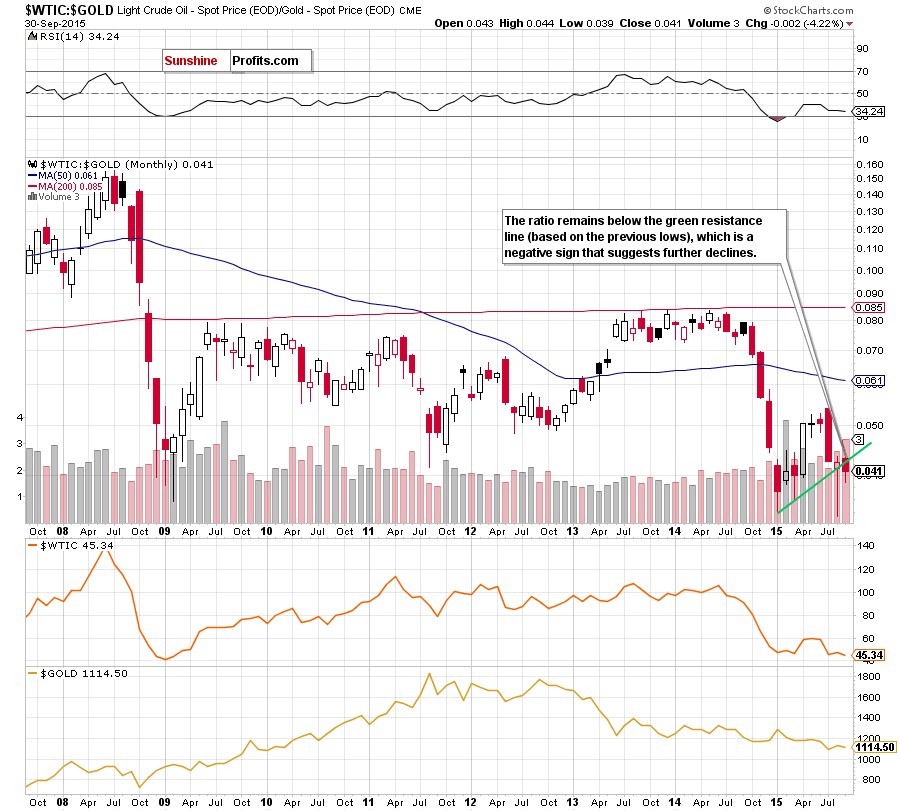
From this perspective, we see that the ratio closed the previous month under the green support line, which is an additional negative signal that suggests further declines in the ratio and also in black gold.
Non-USD Crude Oil Price
Know the situation for the above ratios, let’s move on to the non-USD (WTIC:UDN ratio) chart of crude oil. As a reminder, UDN is the symbol for the PowerShares DB US Dollar Index Bearish Fund, which moves in the exact opposite direction to the USD Index. Since the USD Index is a weighted average of the dollar's exchange rates with world's most important currencies, the WTIC:UDN ratio displays the value of crude oil priced in "other currencies".
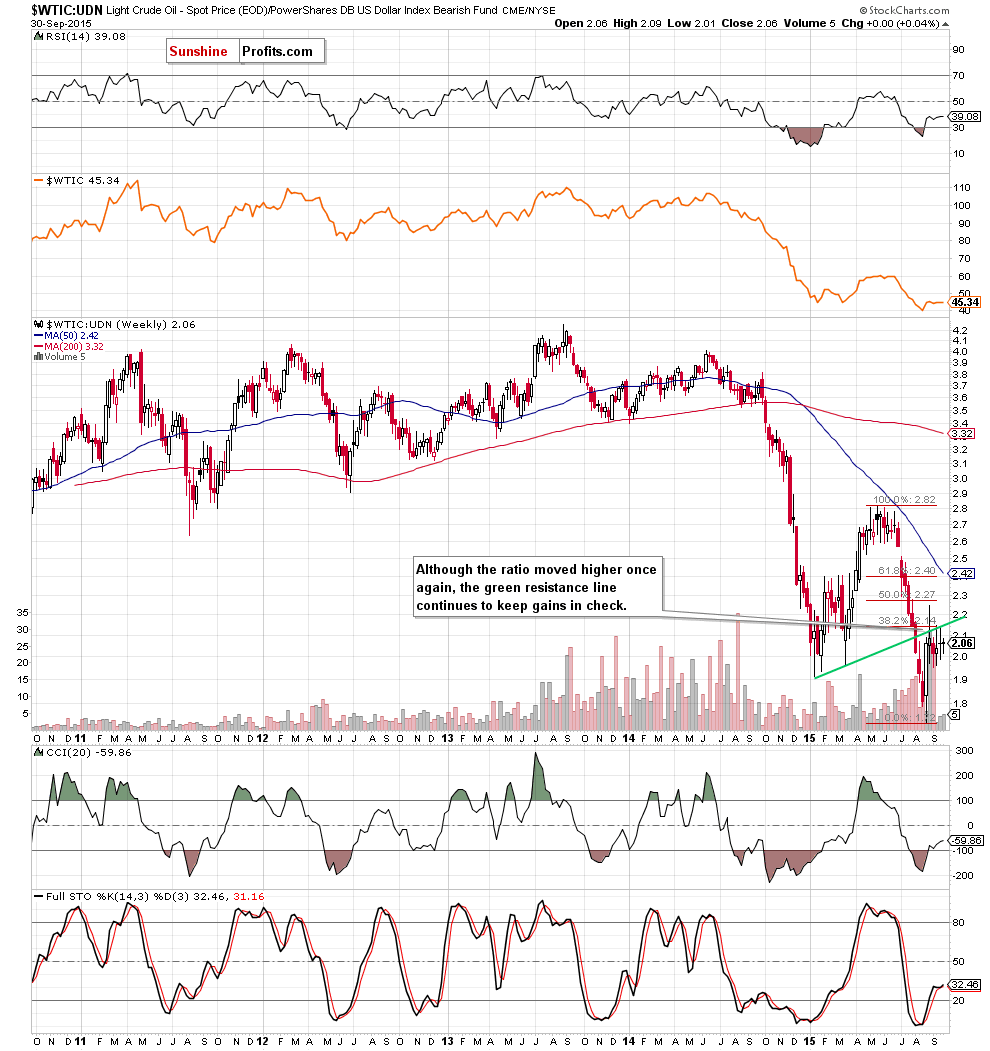
From this perspective, we see that the previously-broken green support/resistance line (based on the Jan and Mar lows) continues to keep gains in check. Taking this fact into account, we believe that as long as there is no weekly close above this important line another attempt to move lower is more likely than not (even if oil bulls try to re-test it once again). If we see such price action, it will translate to lower values of light crude in the coming week(s).
Scenarios
Just like a month ago, today’s Oil Investment Update includes scenarios of what could happen in the coming weeks. Naturally, we will continue to monitor the market in the coming days and if anything invalidates our long-term outlook we will send you an additional message.
- Bullish scenario
If crude oil moves higher and breaks above the key resistance zone created by the 38.2% Fibonacci retracement and the medium-term upper black line (a potential right shoulder of the head and shoulders formation), we may see an increase to around $50, where the psychologically important barrier, the 50% Fibonacci retracement (based on the May-Aug declines) and the long-term red declining resistance line (based on the Sep 29, 2014 and Jun 15 weekly opening prices - marked on the weekly chart) are. If this price level is broken, the next target for oil bulls would be around $53, where the long-term red dashed declining resistance line based on the Sep 29 and Jun 15 intraweek highs and the 61.8% Fibonacci retracement are. - Bearish scenario
If the commodity declines below the blue support zone (based on the Jan lows), the blue support line and the lower border of the blue declining trend channel (marked on the daily chart), the current declines will accelerate and we’ll see a test of $40. If it is broken, the next target for oil bears would be the Aug low of $37.75 or even around the support zone based on the Dec 2008 and Jan 2009 lows (around $35.13-$35.52).
Summary
Although the last August‘s session approached crude oil to the barrier of $50, oil bears took control very quickly and erased all gains on the following day, taking the commodity to the support zone based on the Jan lows (marked with blue on the weekly and daily charts). Despite this dynamic reversal, the following sessions were not such exciting and, as it turned out, the whole Sep was dominated by short-lived moves in both directions. In the previous month light crude lost 5.86%, but there was no significant breakdown, which could accelerate declines. Will we see it in the coming month? Taking into account a potential head and shoulders formation (marked on the long-term chart) and the current position of the above ratios, which remains under important resistance levels (in all cases their reversals and declines will translate to lower values of crude oil), we believe that reversal and lower prices of light crude are just around the corner (even if the commodity re-tests the 38.2% Fibonacci retracement).
Very short-term outlook: bearish
Short-term outlook: bearish
MT outlook: bearish
LT outlook: mixed with bearish bias
Trading position (short-term; our opinion): Short positions with a stop-loss order at $54.12 (yes, that far as the medium-term outlook is unlikely to change as long as crude oil stays below the declining medium-term resistance line) and initial (!) target price at $35.72 are justified from the risk/reward perspective.
This completes this month’s Oil Investment Update. Our next Oil Investment Update is scheduled for Thursday, Nov 5, 2015. Oil Trading Alerts subscribers will additionally receive similar but shorter alerts on a daily basis (or more than once a day when the situation requires it). You – Oil Investment Updates subscribers – will receive short Investment Alert messages should the outlook for the medium or long term change before the next Update is posted.
Thank you.
Nadia Simmons
Forex & Oil Trading Strategist
Oil Investment Updates
Oil Trading Alerts

