

Just like a month ago we begin this Oil Investment Update with the words that we used to summarize the situation in the previous update (on July 9, 2015). We summarized the situation in the following way:
(…) the commodity closed yesterday’s session under the previously-broken zone created by the Feb highs, which suggests that the upswing could be just a verification of earlier breakdown. Additionally, yesterday’s move was much smaller than the previous upswings (at the end of May and later in June), which clearly means that the short-term downward trend remains in place, suggesting lower values of the commodity. On top of that, the oil-to-oil stocks, oil-to-gold, WTIC:USD and WTIC:UDN ratios opened this week well below the last week’s closing prices, creating gaps, which serve as resistance areas that support oil bears and declines (as long as they are open further improvement in the ratios and also in crude oil is not likely to be seen). This bearish scenario is also reinforced by the rising oil stocks-to-oil and stocks-to-oil ratios (many times in the past higher values of these ratios have triggered declines in crude oil) and sell signals generated by the weekly indicators.
Looking at the current situation in crude oil, we can say with conviction that July was the worst month for the commodity since the begining of the year. In this period of time, crude oil lost 20.85% (making our gains on the short position even bigger) and broke below the Apr low, closing last month at its lowest level since March. Although we saw a rebound after this big downward move, its size didn’t confirm oil bulls‘ strength, which resulted in another decline. At this point, it is also worth noting that although yesterday’s EIA report showed another drop in crude oil inventories (bullish fundamental factor), the commodity moved lower once again and hit a fresh multi-month low of $44.83. Does this show of weakness suggest lower values of the commodity? Let’s jump right into charts (chart courtesy of http://stockcharts.com) to find the answer.
Crude Oil
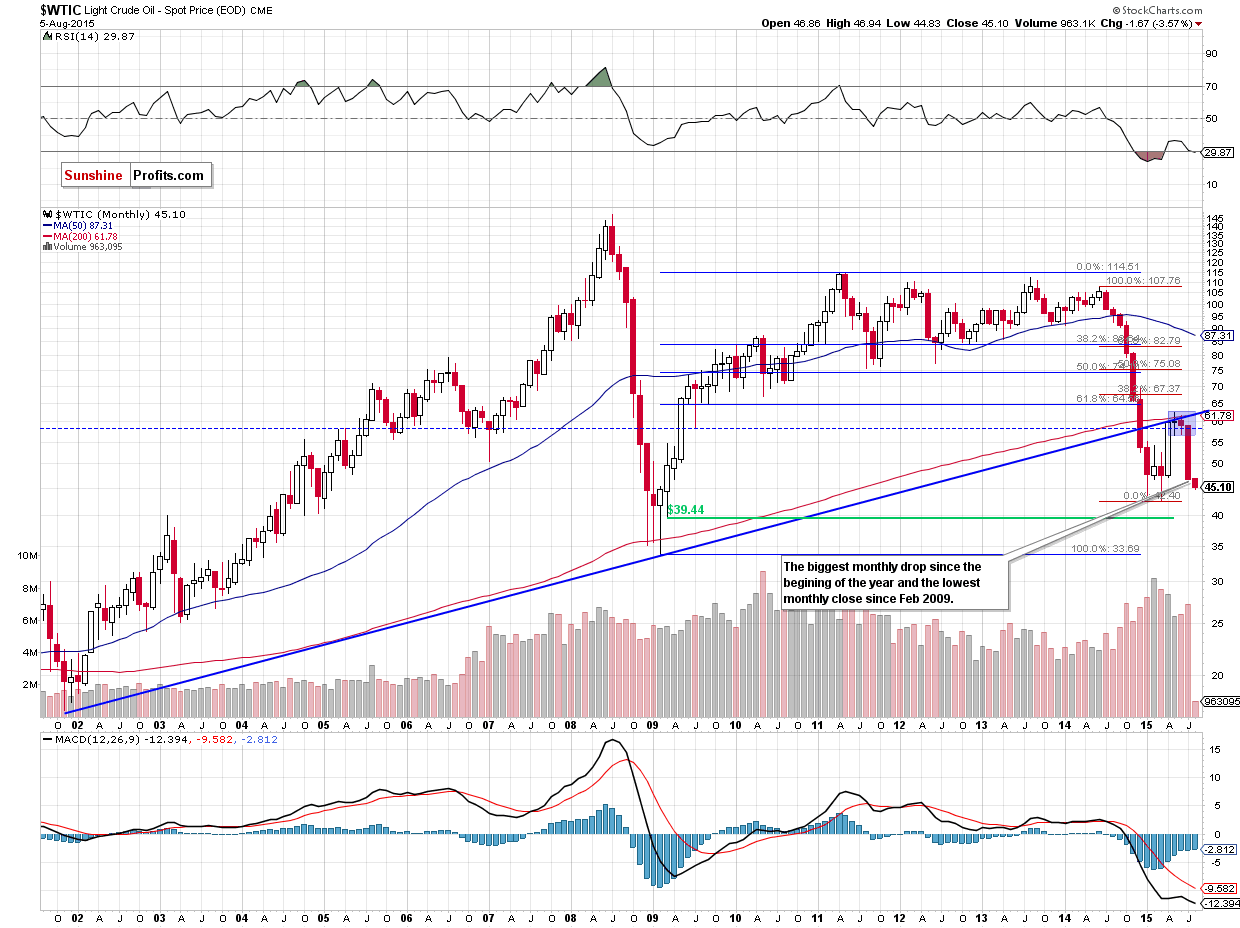
In July crude oil posted its biggest monthly decline since the beginning of the year. On top of that, the commodity closed the previous month at its lowest level since Feb 2009, which confirms oil bears’ strength and suggests further deterioration.
What impact did this move have on the medium-term picture? Let’s examine the weekly chart and find out.
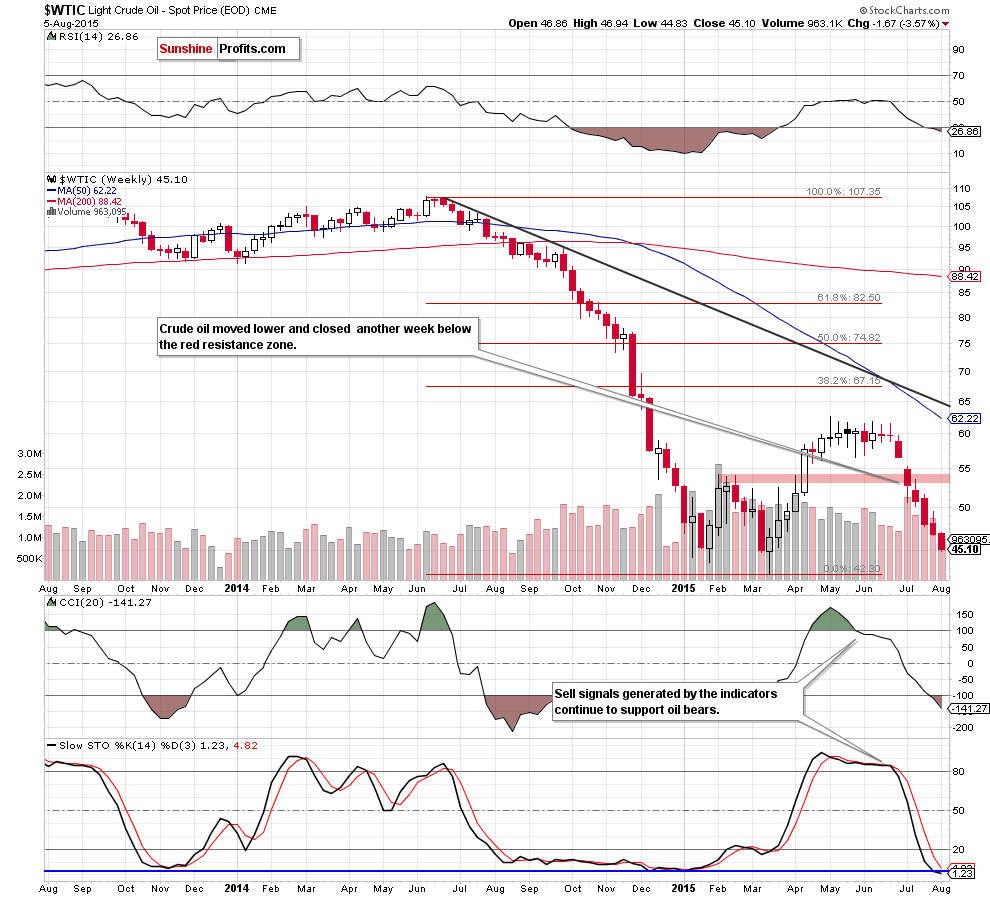
From this perspective we see that crude oil closed another week under the previously-broken support zone based on the Feb highs, which in combination with sell signals generated by the indicators suggests further drops.
How low could the commodity go in the coming days? Let’s take a closer look at the daily chart and find out.
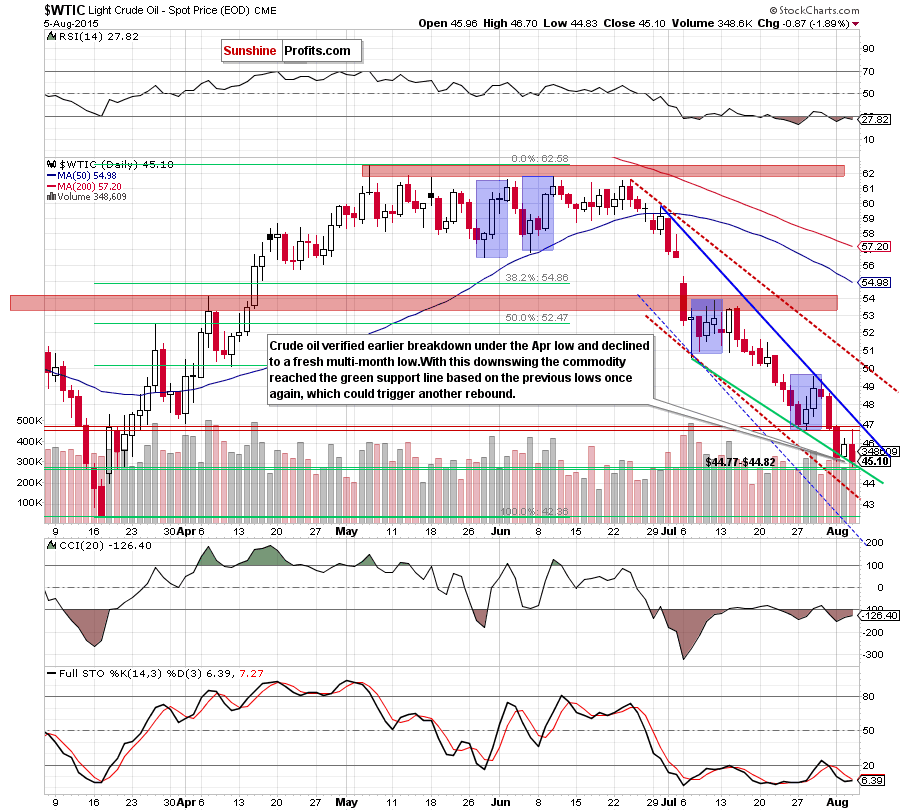
Looking at the daily chart, we see that crude oil declined after the verification of the breakdown under the Apr low and the 78.6% Fibonacci retracement. With this downswing light crude also slipped under the green support line (based on the previous lows) and hit a fresh multi-month low of $44.83. Although the commodity rebounded slightly before the session close, we should keep in mind that yesterday’s downswing materialized on sizable volume, which confirms that the downtrend remains in place. On top of that, sell signals generated by the weekly and daily indicators continued to support oil bears. Taking all the above into account, we believe that further deterioration is more likely than not.
If this is the case, and the commodity closed the day below the support zone (created by the Mar 19, Mar 20 and the green support line based on the previous lows), we’ll likely see a test of the lower border of the red declining trend channel (currently around $43.60). If it is broken, the next target for oil bears would be the Mar low of $42.41.
Summing up, yesterday, light crude reversed and declined, hitting a fresh multi-month low. Taking this fact into account and combining with sizable volume that accompanied yesterday’s decline, we believe that further deterioration and lower values of the commodity are still ahead us.
Having discussed the situation in crude oil, let’s examine the NYSE Arca Oil Index (XOI) to find out what the current outlook for oil stocks is.
Oil Stocks
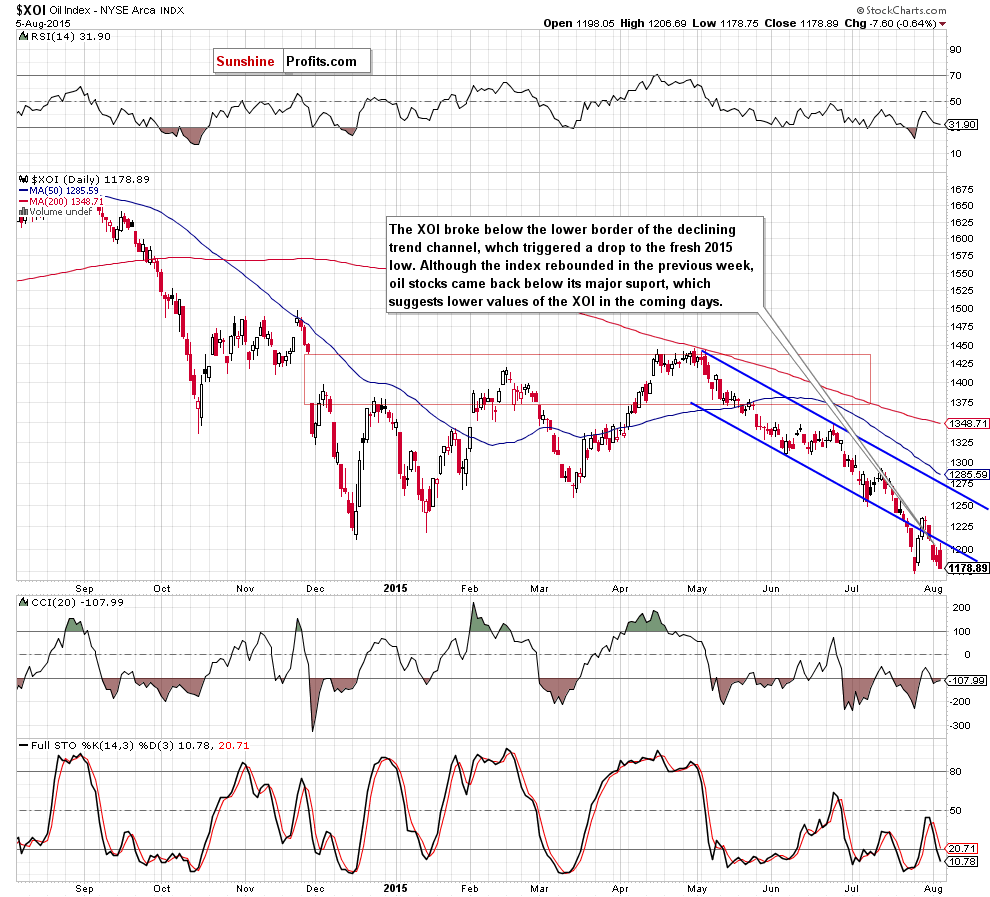
The first thing that catches the eye on the daily chart is a breakdown below the lower border of the declining trend channel. This bearish signal triggered further deterioration, which resulted in a fresh 2015 low of 1,172. Although the index rebounded in the previous week, invalidating earlier breakdown, oil bulls didn’t manage to hold gained levels, which translated to a comeback below the lower line of the formation. Yesterday, oil stocks verified the breakdown, which resulted in another decline. Taking this fact into account, and combining it with sell signal generated by the Stochastic Oscillator, we think that further deterioration is just around the corner. If this is the case, and the XOI extends losses, we’ll see a fresh multi-month low.
How low could oil stocks go? Let’s examine the weekly chart and look for more clues about future moves.
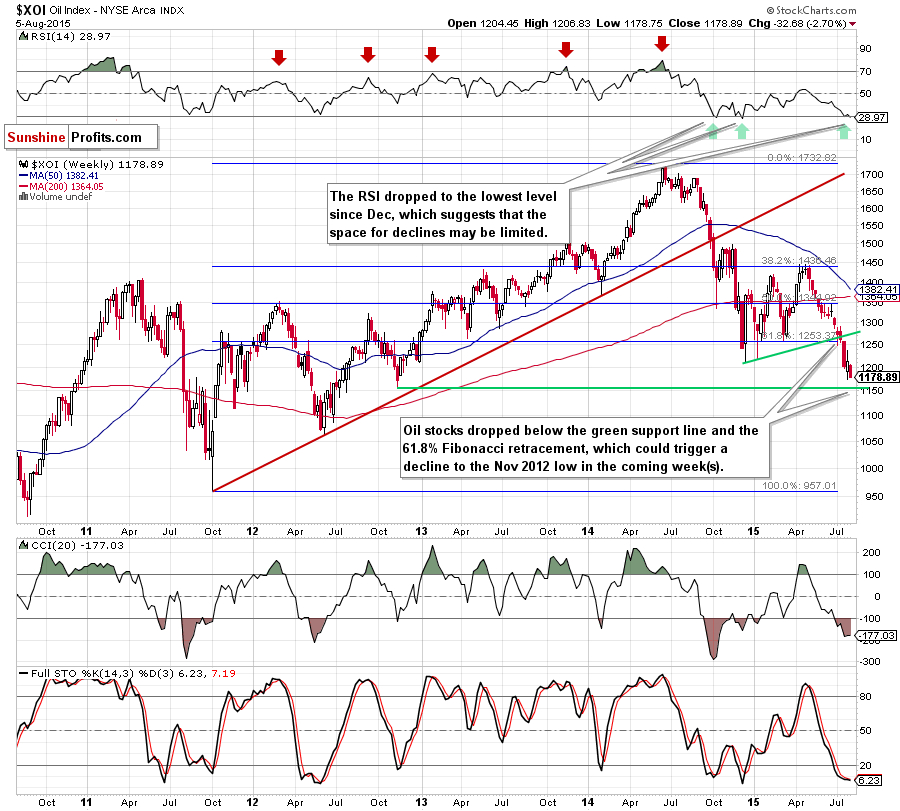
From this perspective, we see that the breakdown under the green support line (based on the Dec and Jan lows) and the 61.8% Fibonacci retracement triggered a drop under the Dec low, which is a bearish signal that suggests a decline to the Nov 2009 low of 1,155 in the coming week(s).
What could happen if this support is broken? Let’s take a look at the long-term chart and find out.
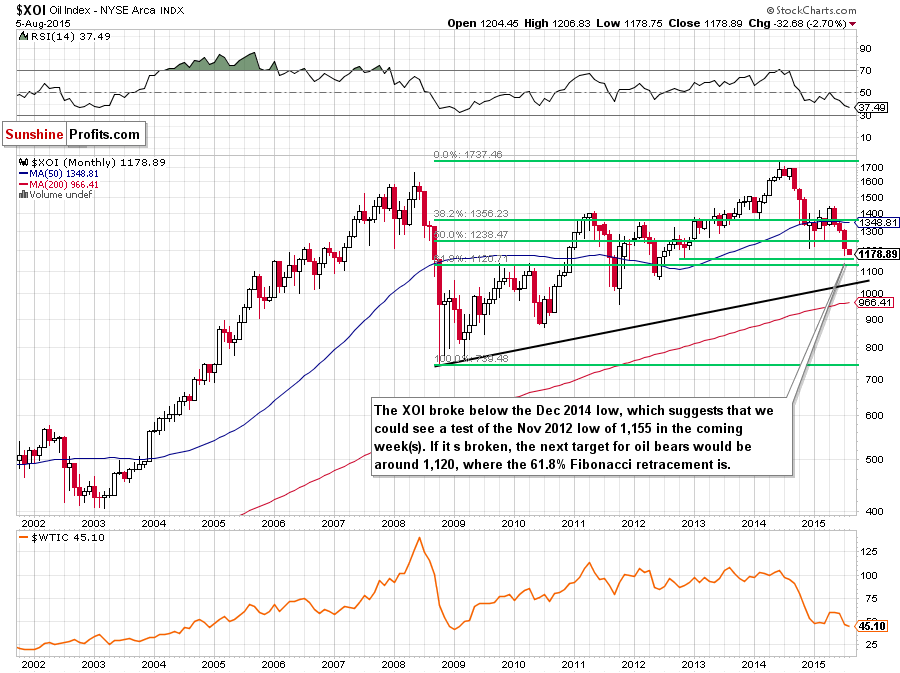
As you see on the above chart, the next downside target for oil bears would be around 1,120, where the 61.8% Fibonacci retracement is.
Summing up, oil stocks extended losses and broke below the Dec low, which suggests that we could see a test of the Nov 2009 low (1,155) or even a drop to around 1,120, where the 61.8% Fibonacci retracement is.
Ratio Analysis
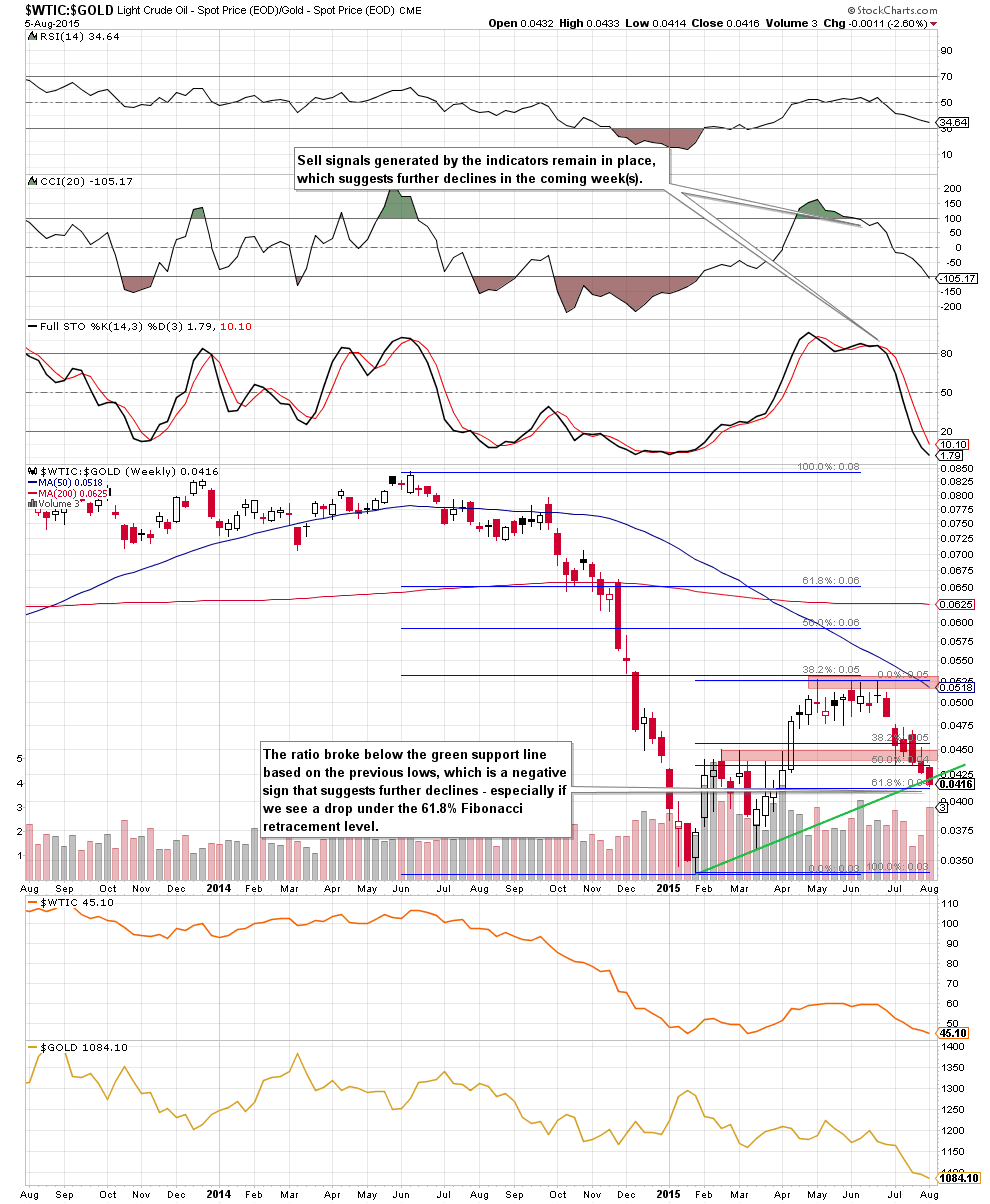
Once we know the current situation in crude oil and oil stocks, let’s focus on the relationship between them. What can we infer from the chart below?
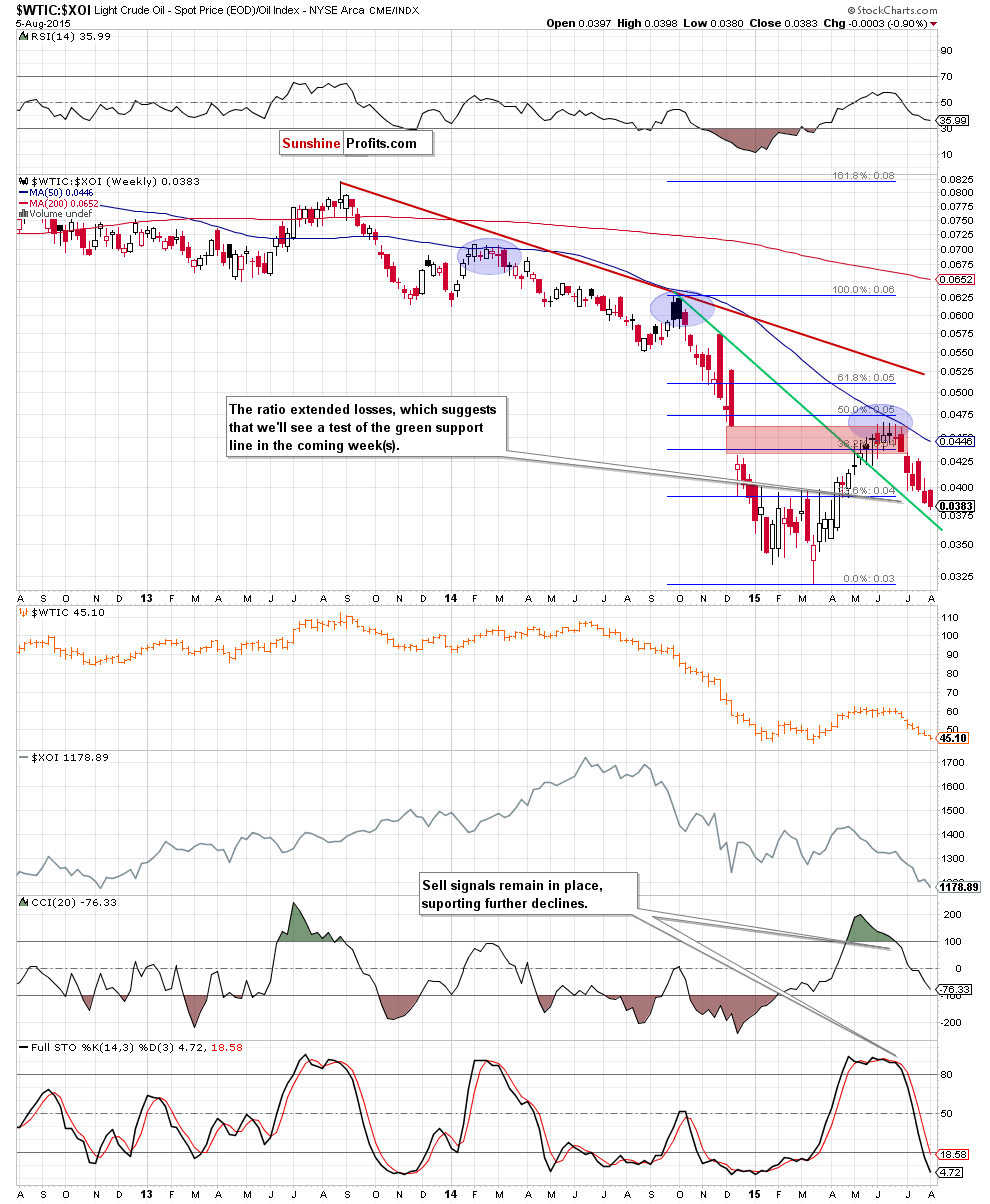
Quoting our previous Oil Investment Update:
(…) sell signals remain in place, supporting further deterioration. At this point, it is also worth noting that even if the ratio extends gains and climbs to 0.0432, the upward move will be seen as a verification of the breakdown below the lower border of the gap, which served as support in the previous weeks.
Looking at the weekly chart, we see that the situation developed in line with the above scenario and the ratio moved sharply lower in the previous weeks. Taking into account the fact that sell signals are still in play, we think that the ratio will test the previously-broken declining line in the coming week (s). If this is the case, such price action will translate to another downswing in light crude.
Having said that, let’s find out whether we can infer something more about future crude oil’s moves from the stocks-to-oil ratio or not.
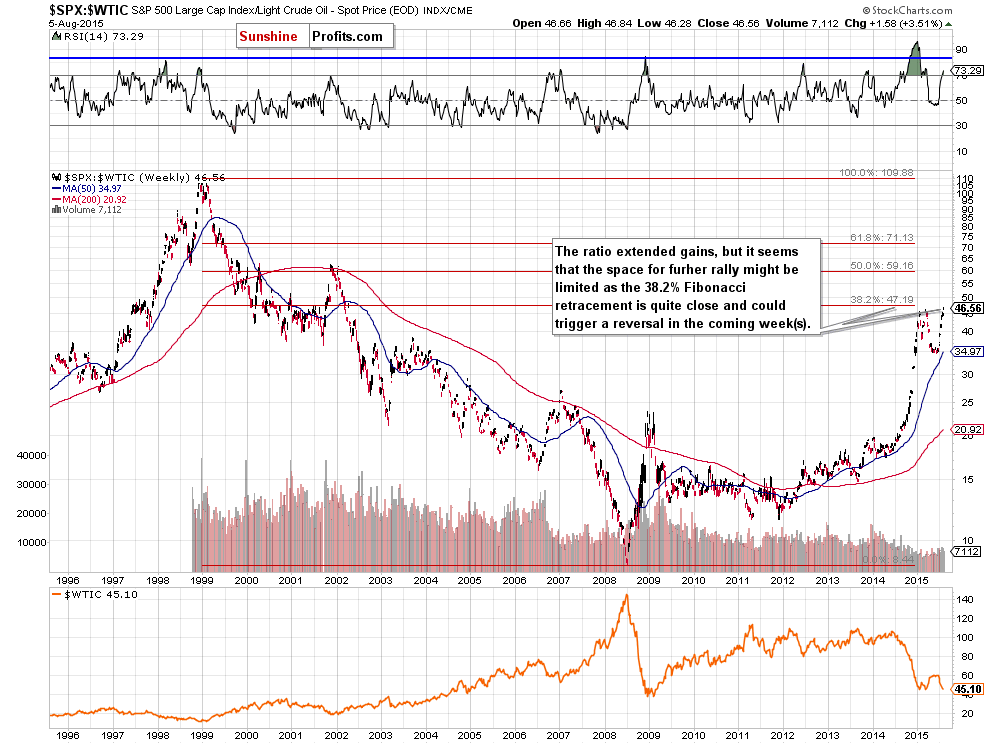
A month ago, we wrote the following:
(…) the ratio extended gains, triggering a decline in crude oil. Taking this fact into account, and combining it with buy signals generated by the indicators, we think that higher values of the ratio (and further declines in light crude) are just around the corner.
From today’s point of view we see that the ratio extended gains as we had expected. With this rally, the ratio approached the 38.2% Fibonacci retracement (based on the entire 1999-2008 decline), which could pause or even stop further improvement. What does it means for light crude? As you see on the above chart, many times in the past local tops in the ratio have corresponded to the local bottoms in the commodity. Therefore, a reversal in the ratio will likely trigger a reversal in crude oil, which means that we should keep an eye on this chart very carefully.
Once we know the current situation in the stocks-to-oil ratio, let’s analyze the oil-to-gold ratio.
Quoting our last Oil Investment Update:
(…) the ratio remains under small gap between the last week’s close and this week’s open, which serves as the nearest resistance. Therefore, even if we see an increase to 0.0485, such upswing will be just a verification of the breakdown below the Jun lows.
(…) the Stochastic Oscillator declined below the level of 80 for the first time since June 2014. Back then, such drop resulted in a sizable decline, which suggests that we may see similar price action in the coming weeks. In this case, declining ratio will trigger a sizable correction in light crude.
As you see on the weekly chart, the previous weeks brought declines (in tune with the above scenario), which took the ratio under the support zone created by the Feb highs. This bearish sign triggered further drops, which resulted in a breakdown under the green support line based on the previous lows. This is an additional negative signal, which suggests further declines – especially if we see a drop under the 61.8% Fibonacci retracement (which is highly likely as sell signals remain in place).
To have a more complete picture of the oil market, we also decided to examine the WTIC:USD ratio.
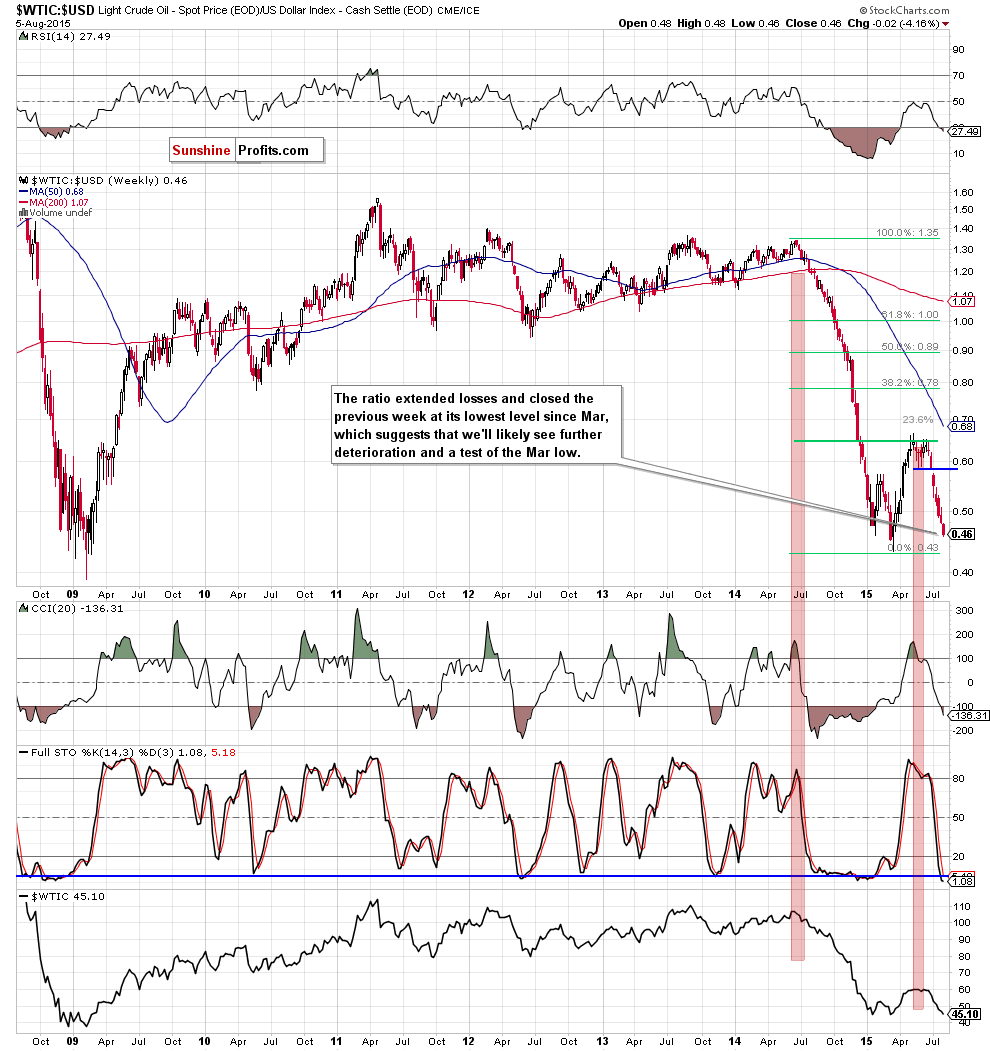
A month ago, we wrote the following:
(…) the ratio is still trading under the Feb highs and well below the gap, which means that as long as here is no comeback above 0.587 (the upper border of the gap), further improvement in the ratio (and also in crude oil) is not likely to be seen. Taking this fact into account, and combining it with sell signals generated by the indicators, we believe that further declines in the ratio and crude oil are more likely than not.
On the weekly chart, we see that the situation developed in line with the above scenario and the ratio extended losses, triggering a decline in crude oil. Taking into account sell signals generated by the indicators and the fact that the ratio closed the previous week at its lowest level since March, it seems to us that we’ll see a test of the Mar low in the coming week(s). Nevertheless, the space for further declines seems limited as the CCI and Stochastic Oscillator are already oversold.
Non-USD Crude Oil Price
Know the situation for the above ratios, let’s move on to the non-USD (WTIC:UDN ratio) chart of crude oil. As a reminder, UDN is the symbol for the PowerShares DB US Dollar Index Bearish Fund, which moves in the exact opposite direction to the USD Index. Since the USD Index is a weighted average of the dollar's exchange rates with world's most important currencies, the WTIC:UDN ratio displays the value of crude oil priced in "other currencies".
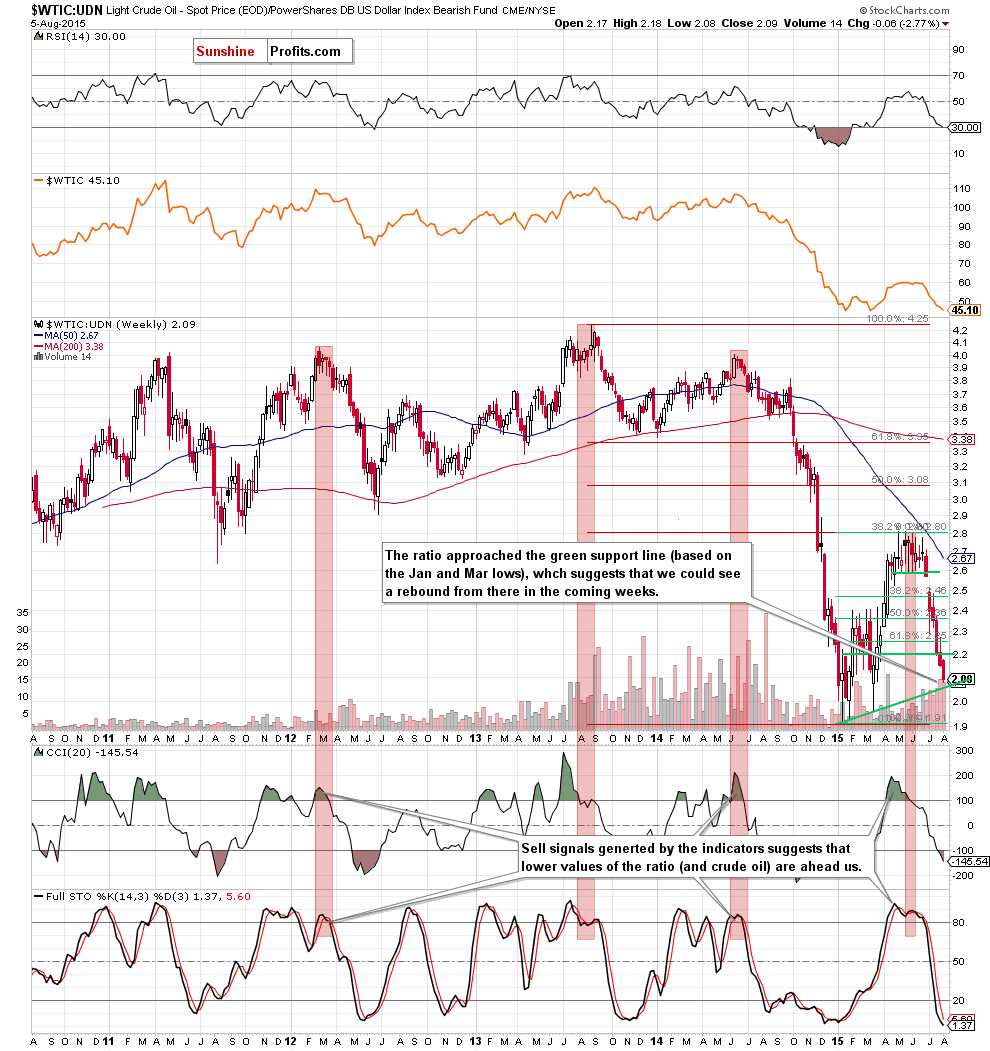
In our July’s Oil Investment Update, we wrote:
(…) as long as there is no invalidation of the breakdown below the blue line (which serves as resistance at the moment) and the gap between the last week’s close and this week’s open is in play further improvement in the ratio (and higher values of crude oil) are not likely to be seen. Additionally, sell signals remain in place, supporting declines.
From this perspective, we see that the ratio extended losses (with tune with our last commentary) and approached the green support line (based on the Jan and Mar lows). Therefore, in our opinion, the ratio (and crude oil) may reverse and rebound after a drop to this support line. This suggests that keeping an eye on the above chart is a good decision.
Scenarios
Just like a month ago, today’s Oil Investment Update includes scenarios of what could happen in the coming weeks. Naturally, we will continue to monitor the market in the coming days and if anything invalidates our long-term outlook we will send you an additional message.
- Bullish scenario
If crude oil bounces off the support zone created by the Mar 19, Mar 20 and the green support line based on the previous lows, we’ll likely see a rebound to the blue resistance line. If it is broken, the next target for oil bulls would be the Jul 29 high of $49.52 or even the red declining resistance line based on the Jun 24 and Jun 30 highs. - Bearish scenario
If the commodity closes the day below the support zone created by the Mar 19, Mar 20 and the green support line based on the previous lows, we’ll likely see a test of the lower border of the red declining trend channel (currently around $43.60). If it is broken, the next target for oil bears would be the Mar low of $42.41.
Summary
In recent weeks crude oil accelerated declines, which resulted in a breakdown not only below the psychologically important barrier of $50 and the 61.8% Fibonacci retracement, but also in a drop under the Apr low and the support zone created by the 76.4% and 78.6% Fibonacci retracements. On top of that, yesterday’s decline (which materialized on sizable volume) verified the breakdown under these levels, which is an additional bearish signal. At this point, it is also worth noting that the last upward move was much smaller than the previous upswings (all marked with blue on the daily chart of crude oil), which clearly means that the down trend remains in place, suggesting lower values of the commodity. However, it seems that this volatile and very profitable trade’s days may be over soon. Given the sharpness of the decline in the recent days it will likely take only a few extra sessions for crude oil to reach strong support levels - the March low ($42.41) and the January low ($43.58), so we think that it’s a good idea to put exit orders in place for the current trade so that profits are taken automatically off the table, when crude oil moves very close to the above-mentioned levels. It seems that placing a profit- take order at $43.82 is justified from the risk/reward perspective. The plan is to see how crude oil performs at these levels – it will likely correct, which will allow us to re-enter short positions at higher prices, thus increasing the profits once again.
Very short-term outlook: bearish
Short-term outlook: bearish
MT outlook: bearish
LT outlook: bearish
Trading position (our opinion):Short positions with a stop-loss order at $65.23 and profit-take order at $43.17 are justified from the risk/reward perspective. We will keep you – our subscribers – informed should anything change.
This completes this month’s Oil Investment Update. Our next Oil Investment Update is scheduled for Thursday, Sep 3, 2015.Oil Trading Alerts subscribers will additionally receive similar but shorter alerts on a daily basis (or more than once a day when the situation requires it). You – Oil Investment Updates subscribers – will receive short Investment Alert messages should the outlook for the medium or long term change before the next Update is posted.
Thank you.
Nadia Simmons
Forex & Oil Trading Strategist
Oil Investment Updates
Oil Trading Alerts

