

Let’s begin this month’s Oil Investment Update with the words that we used to summarize the situation in the previous update (on June 8, 2015). We summarized the situation in the following way:
Although crude oil rebounded and invalidated earlier breakdown under the short-term support level, the commodity still remains below the May and June highs and the key resistance zone created by the long-term blue resistance line and the 200-month moving average. Additionally, last week’s decline materialized on sizable volume (compared to what we saw during the recent weeks), which means that oil bears are getting stronger. On top of that, similar values of the CCI and Stochastic Oscillator (not only in case of crude oil, but also in oil-to-gold , oil-to-usd and WTIC:UDN ratios) preceded huge declines, which took the commodity to the multi-month low of $42.41.Taking this fact into account and combining with the long-term picture and the current position of the ratios, which reached important support/resistance levels (in all cases their reversals will translate to lower values of crude oil), we believe that lower values of crude oil are just around the corner.
The crude oil market has certainly made us wait to see the bearish scenario to play out, but when it did, it moved with vengeance. The price of black gold plunged and declined almost $10 this month and those holding short positions were handsomely rewarded. Of course, no market can move up or down in a straight line, so the fact that we saw a rebound after such a big decline is not surprising. Where will crude oil move next and how can one position themselves given the likely outcome? Let’s jump right into charts (charts courtesy of http://stockcharts.com) to find the answer.
Crude Oil
In our Oil Trading Alert posted on June 29, we wrote the following:
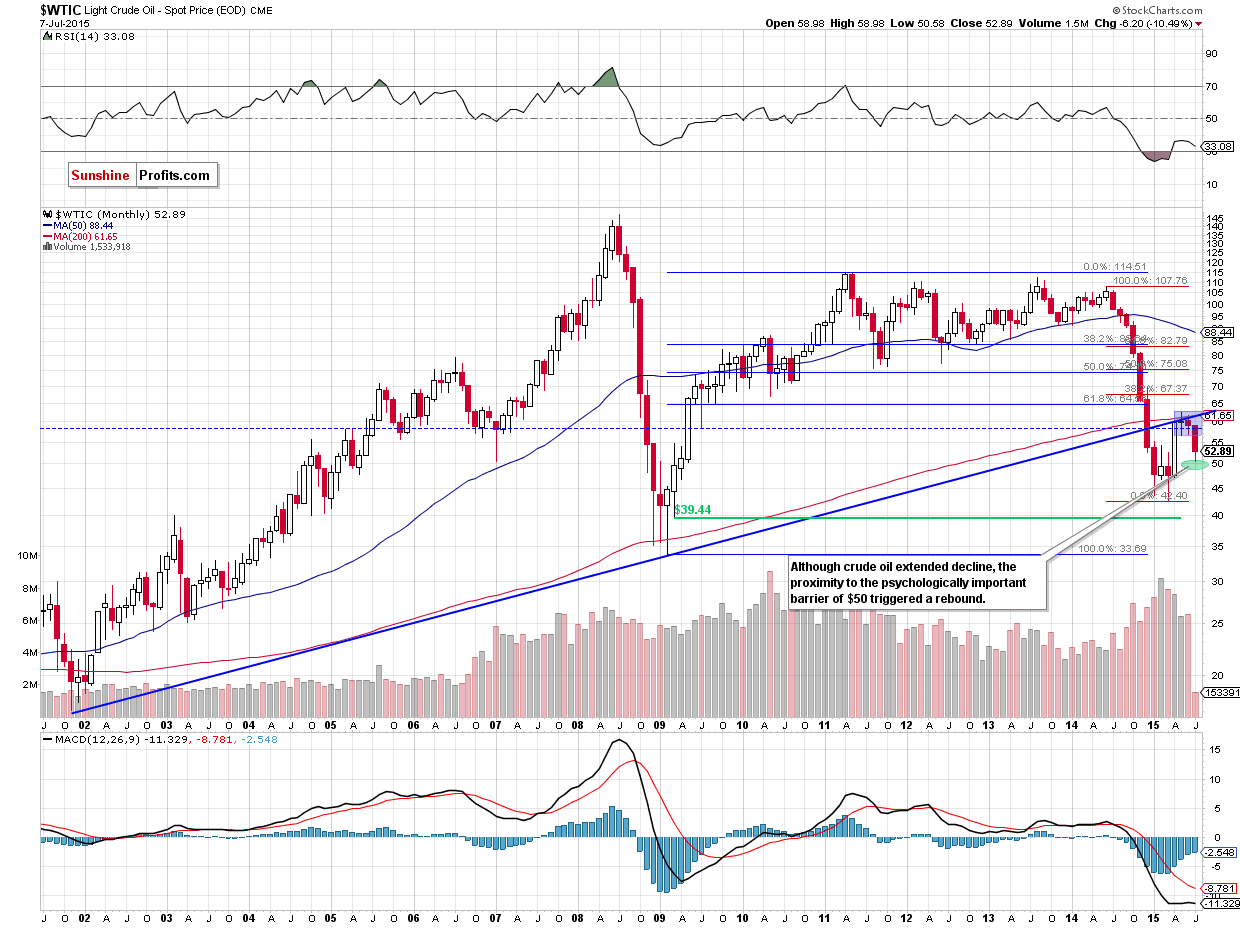
(…) this year’s rally is simply a sizable correction of the previous massive decline. Taking into account the fact that there was no major breakout and the trend remains down, it seems that the short-term outlook would deteriorate, as crude oil didn’t move above the long-term rising resistance line and the 200-month moving average.
On Thursday, crude oil closed the day at $56.50, which triggered a small breakdown under the lower line of the consolidation (marked with blue). This was a bearish signal (especially when we take into account the fact that the commodity closed not only day, but also whole week below this level), which suggested an acceleration of declines.
From today’s point of view we see that the situation developed in line with the above scenario and crude oil dropped sharply on Monday. With this downswing, light crude confirmed the breakdown below the lower border of the consolidation, which resulted in a decline to a 3-month low of $50.58. At this point, it is worth noting that slightly below this level (around $50.44) the size of the downward move corresponded to the height of the formation, which reduced the selling pressure and triggered a rebound.
What impact did this move have on the medium- and short-term pictures? Let’s examine the charts below and find out.
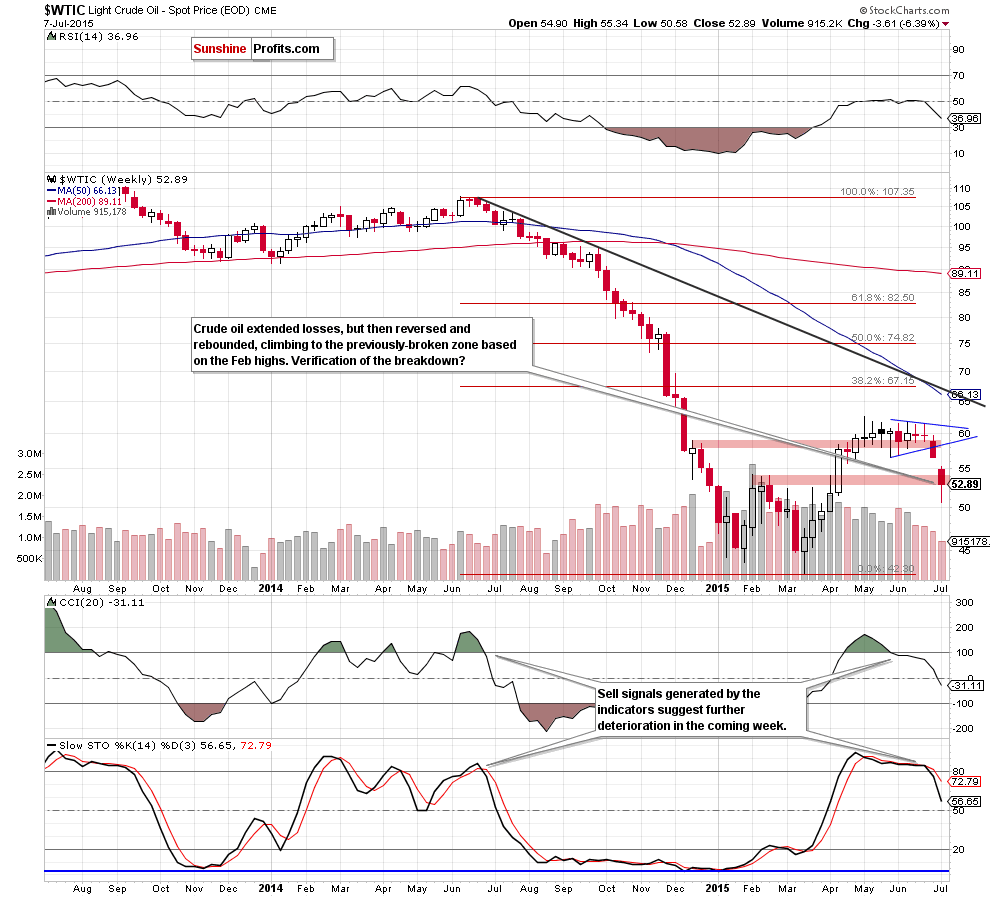
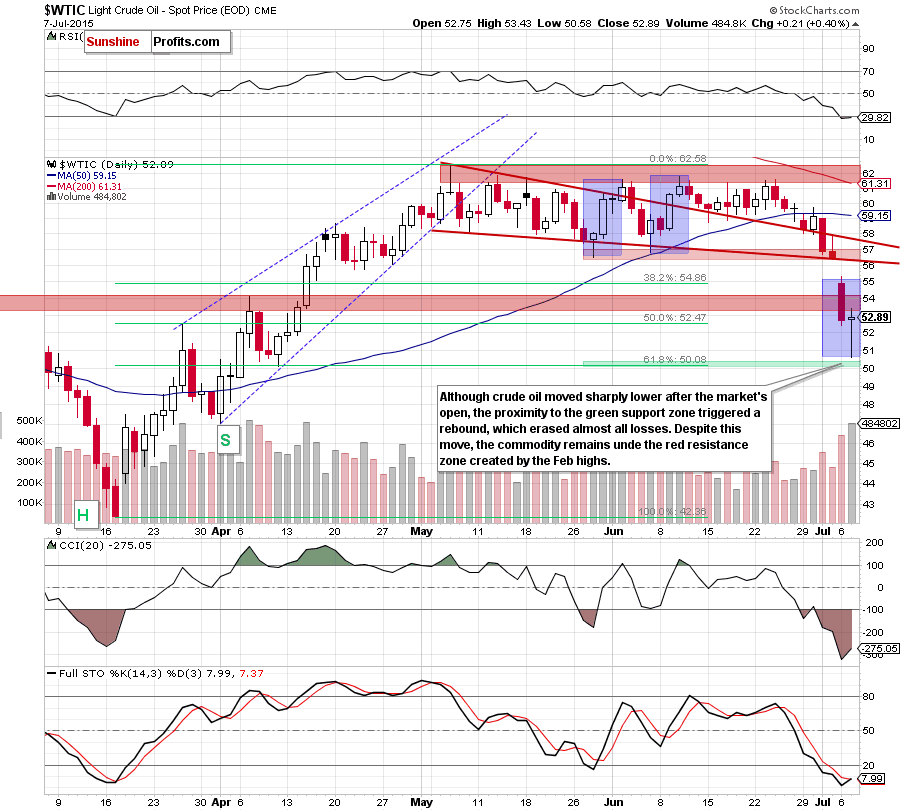
Looking at the above charts, we see that oil bears managed to push light crude below the support zone created by the Feb highs. This bearish signal, in combination with sell signals generated by the daily and weekly indicators, triggered further deterioration, which approached the commodity to the psychologically important barrier of $50 and the 61.8% Fibonacci retracement (marked on the daily chart). This support area encouraged oil bulls to act, which resulted in a sharp rebound that erased almost all earlier losses.
Despite this increase, the commodity closed the day under the previously-broken zone created by the Feb highs (it serves as the nearest resistance at the moment), which suggests that yesterday’s upswing could be nothing more than a verification of earlier breakdown. If this is the case, and light crude declines from here, it would be a bearish signal, which will trigger further deterioration and another test of the $50 (please keep in mind that sell signals generated by the weekly indicators remain in place, supporting further declines) in the coming day(s).
Finishing today’s alert we would like to draw your attention to the fact that yesterday’s upswing is much smaller than the previous upward moves, which we saw at the end of May and later in June (all marked with blue on the daily chart). This means that the short-term downward trend remains in place, suggesting lower values of the commodity.
Summing up, in our opinion, short positions in crude oil are justified from the risk/reward perspective as crude oil verified the breakdown under the zone created by the Feb highs. Additionally, yesterday’s upswing is much smaller than the previous upward moves (seen at the end of May and later in June), which confirms that not only the long-term, but also short-term downward trend remain in place, suggesting lower values of the commodity in the coming days.
Having discussed the situation in crude oil, let’s examine the NYSE Arca Oil Index (XOI) to find out what the current outlook for oil stocks is.
Oil Stocks
In our previous Oil Investment Update, we wrote the following:
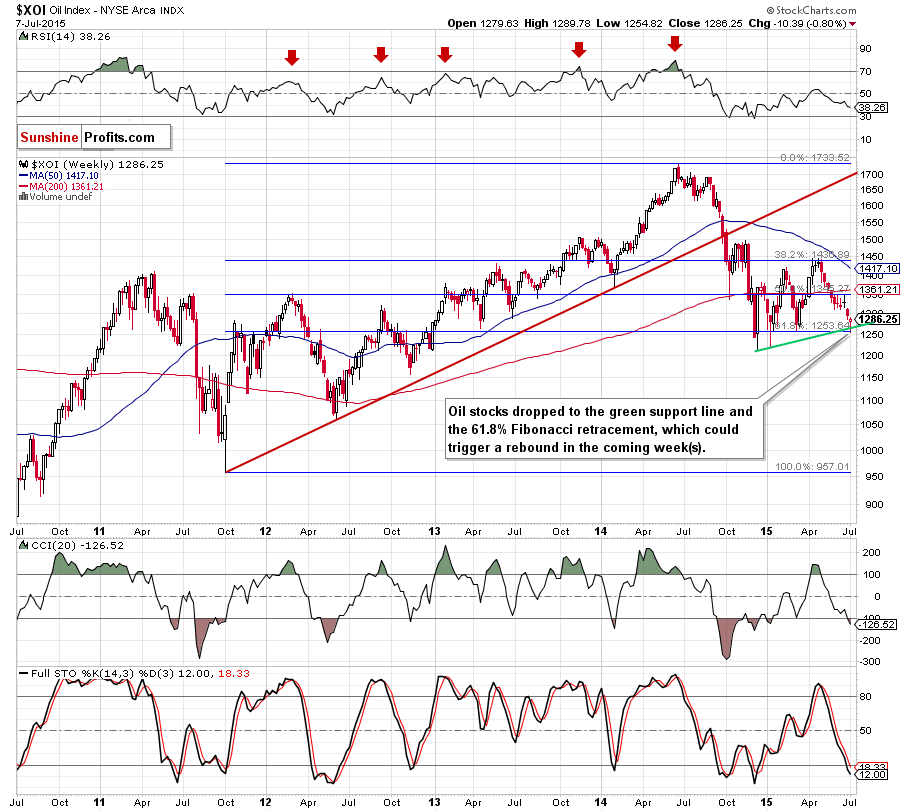
(…) sell signals generated by the indicators remain in place, suggesting further deterioration. What could happen if oil stocks extend losses? The initial downside target would be around 1,253, where the 61.8% Fibonacci retracement (based on the entire 2011-2014 rally) is.
Looking at the weekly chart, we see that oil bears pushed the XOI lower as we had expected and oil stocks reached our downside target. Yesterday, the support zone created by the 61.8% Fibonacci retracement and the green support line triggered a rebound, which invalidated small breakdown under the Mar low. Although this is a positive signal, we should keep in mind that sell signals still support oil bears, suggesting that another test of the above-mentioned support zone can’t be ruled out.
Having said that, let’s check what impact this decline had on the very short-term picture.
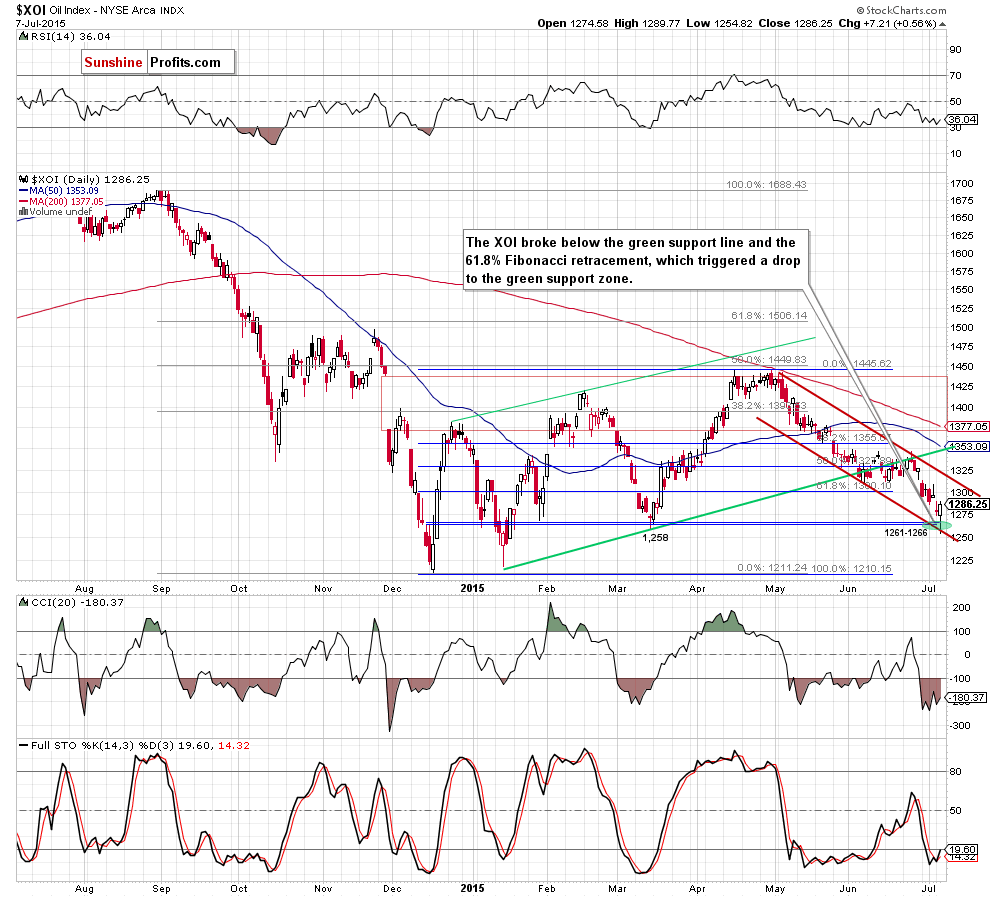
The first thing that catches the eye on the daily chart is a breakdown below the green support line (based on the Jan 14, and Mar13 lows) and the 61.8% Fibonacci retracement (based on the entire Dec-Apr upward move). This bearish signal triggered further deterioration and a drop below the psychologically important barrier of 1,300 in the previous week. Although oil bulls managed to invalidate this breakdown on Thursday, this week’s decline not only erased this increase, but also took the XOI slightly below the March low.
With this downward move, oil stocks reached the green support zone (created by the 76.4% and 78.6% Fibonacci retracement levels and the lower border of the declining trend channel), which encouraged oil bulls to act and resulted in a sharp rebound yesterday. Taking this fact into account, and combining it with the current position of the indicators (the CCI is oversold, while the Stochastic Oscillator generated a buy signal) and the medium-term support zone, we think that further improvement is just around the corner. If this is the case, and the XOI moves higher from here, the initial upside target would be around 1,325, where the upper border of the declining trend channel and the 38.2% Fibonacci retracement (based on the entire May-Jul decline) are.
Before we summarize this section, let’s take a look at the relation between oil stocks and the general stock market. Will it confirm the above pro-growth scenario?
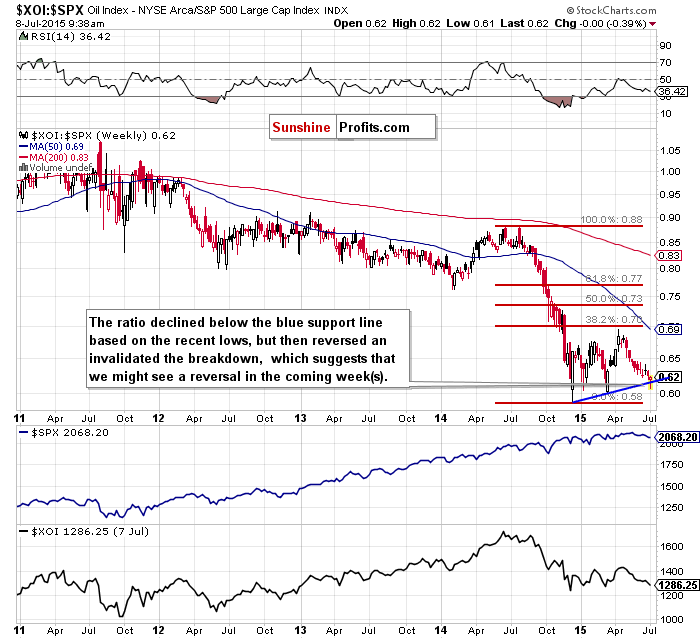
From this perspective, we see that the ratio has declined in the previous weeks, which resulted in a drop below the blue support line based on the recent lows. Despite this move the ratio reversed and rebounded, invalidating earlier breakdown. This is a positive signal, which suggests that we may see a reversal and further improvement in the coming week(s). If we see such price action, higher values of the ratio will likely translate into increase in oil stocks – similarly to what we saw in the past.
Summing up, oil stocks extended losses and reached the solid support area (created by the 61.8% Fibonacci retracement, the medium-term green support line, the 76.4% and 78.6% Fibonacci retracement levels and the lower border of the declining trend channel), which in combination with the position of the daily indicators and the current situation in the oil stocks-to-stocks ratio suggests that we could see a rebound from here to around 1,325 in the coming week(s).
Ratio Analysis
Once we know the current situation in crude oil and oil stocks, let’s focus on the relationship between them. What can we infer from the chart below?
Quoting our previous Oil Investment Update:
(…) the upper border of the red gap between the Dec 8 low and the Dec 15 high stopped further improvement, triggering a pullback. Will we see further deterioration? Taking the above into account, and combining it with the current position of the indicators (the CCI and Stochastic Oscillator are overbought, which will likely translate to sell signals in the coming week), we think that lower values of the ratio are just around the corner. If this is the case, and the ratio declines from here, such price action will likely translate to a pullback in light crude – similarly to what we saw in the previous months.
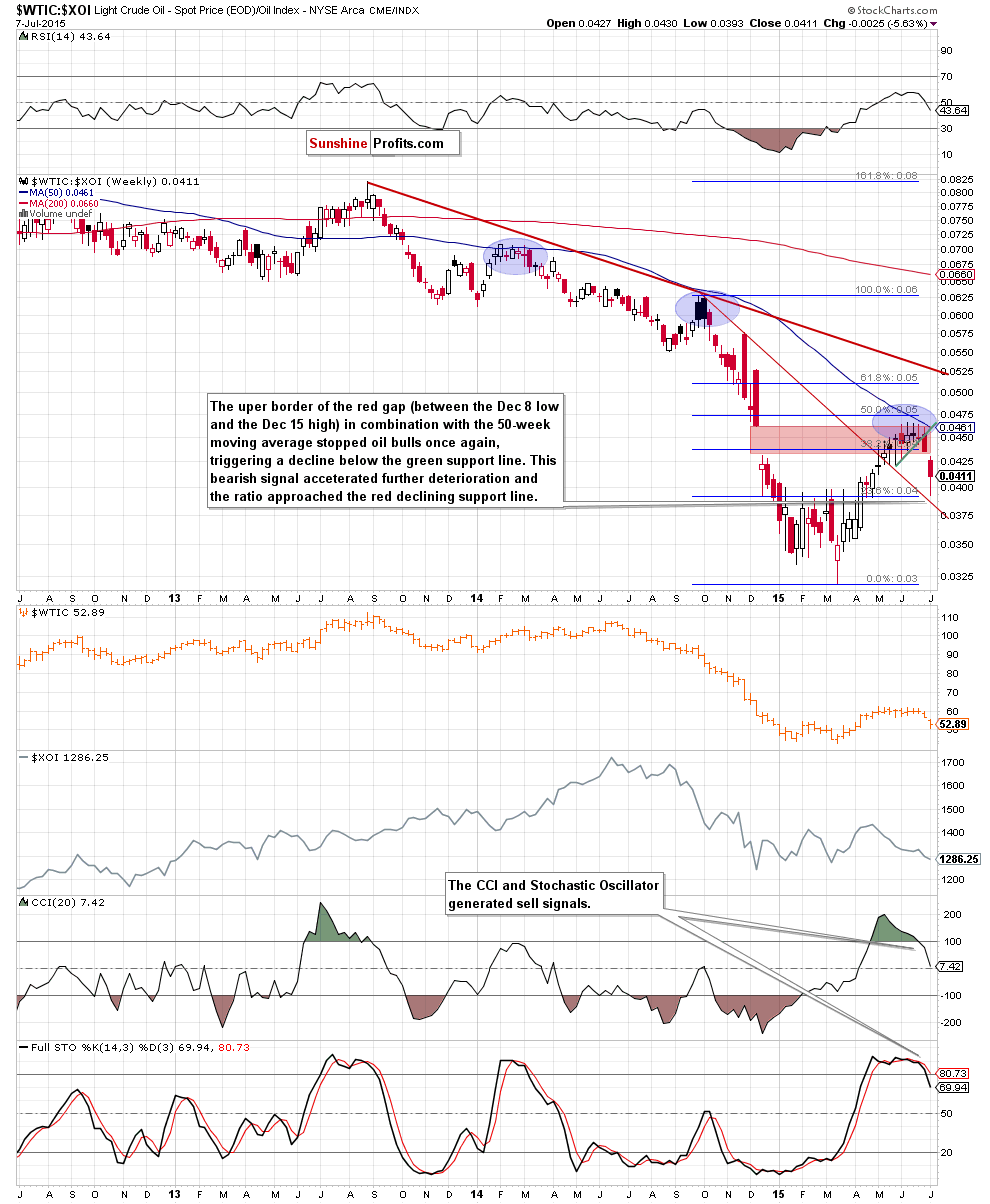
Looking at the weekly chart, we see that the situation developed in line with the above scenario as the upper border of the red gap in combination with the 50-week moving average stopped oil bulls once again, triggering a drop below the green support line. Earlier this week, this bearish signal accelerated further deterioration and the ratio approached the previously-broken declining red support line. Although we saw a rebound yesterday, sell signals remain in place, supporting further deterioration. At this point, it is also worth noting that even if the ratio extends gains and climbs to 0.0432, the upward move will be seen as a verification of the breakdown below the lower border of the gap, which served as support in the previous weeks.
Is it possible that the reverse of the ratio give us any valuable clues about future moves? Let’s check.
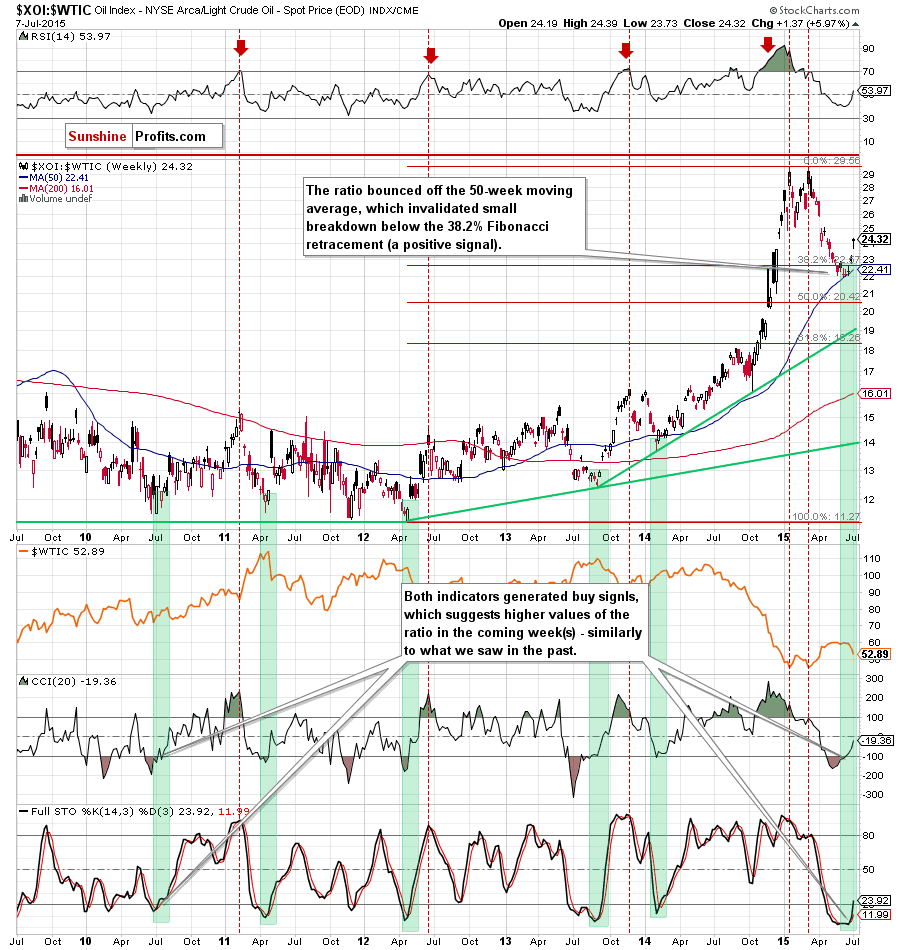
From this perspective we see that the ratio bounced off the 50-week moving average, which invalidated small breakdown below the 38.2% Fibonacci retracement. Taking the above into account, and combining it with the fact that the recent correction of the entire rally was shallow, we think that further improvement in the ratio is just a matter of time – especially when we factor in the current position of the indicators. The CCI and Stochastic Oscillator generated buy signals, which suggests higher values of the ratio – (and lower price of light crude) similarly to what we saw in the past (we marked major reversals with green).
Having said that, let’s find out whether we can infer something more about future crude oil’s moves from the stocks-to-oil ratio or not.
A month ago, we wrote the following:
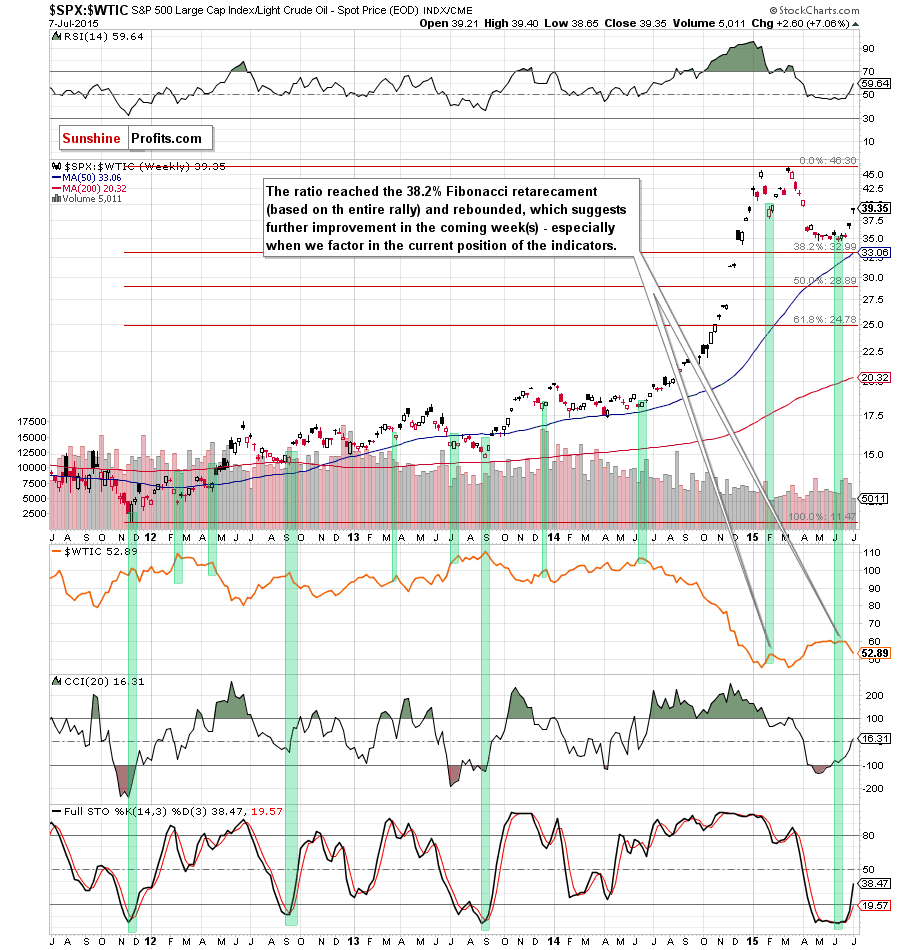
(…) the ratio bounced off the 38.2% Fibonacci retracement based on the entire rally, which suggests further improvement in the coming weeks – especially when we factor in the current position of the indicators (the CCI and Stochastic Oscillator generated buy signals). What does it mean for crude oil? As you see on the above chart, many times in the past (we marked them with green) local bottoms in the ratio have corresponded to local tops in crude oil. Therefore, if we see a rally from here, the probability of a pullback in the commodity will increase.
Looking at the chart, we see that the situation developed in line with the above scenario and the ratio extended gains, triggering a decline in crude oil. Taking this fact into account, and combining it with buy signals generated by the indicators, we think that higher values of the ratio (and further declines in light crude) are just around the corner.
Once we know the current situation in the stocks-to-oil ratio, let’s analyze the oil-to-gold ratio.
Quoting our last Investment Update:
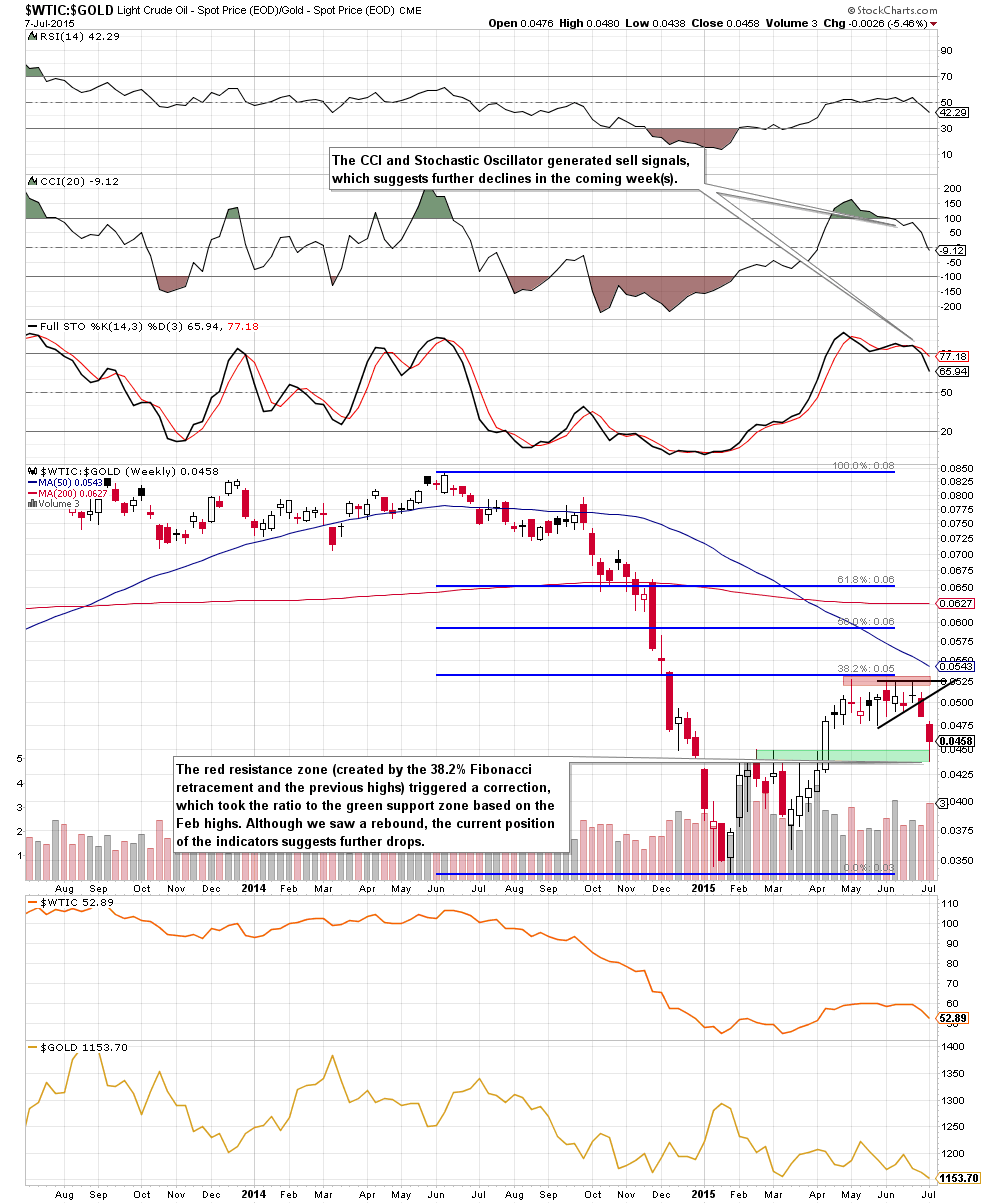
(…) the ratio reached the 38.2% Fibonacci retracement, creating a double top formation, which is a negative signal. Taking the above into account and combining it with the current position of the indicators (the CCI and Stochastic Oscillator are overbought and very close to generating sell signals) and the Fibonacci resistance level, it seems to us that we might see a correction of the recent rally in the coming week(s). If we see such price action, crude oil will likely also move lower – similarly to what we saw in the past.
From today’s point of view we see that the ratio declined as we had expected. In the previous week, we saw a breakdown under the lower border of the black triangle, which triggered further deterioration earlier this week. With this downswing, the ratio reached the green support zone based on the Feb and Mar highs, which resulted in a rebound (in the ratio and also in light crude). Despite this move, the ratio remains under small gap between the last week’s close and this week’s open, which serves as the nearest resistance. Therefore, even if we see an increase to 0.0485, such upswing will be just a verification of the breakdown below the Jun lows. Taking the above into account, and combining with sell signals generated by the indicators, we think that further declines are still ahead us.
Finishing today’s commentary on this ratio, we would like to draw your attention to the fact that the Stochastic Oscillator declined below the level of 80 for the first time since June 2014. Back then, such drop resulted in a sizable decline, which suggests that we may see similar price action in the coming weeks. In this case, declining ratio will trigger a sizable correction in light crude.
To have a more complete picture of the oil market, we also decided to examine the WTIC:USD ratio.
A month ago, we wrote the following:
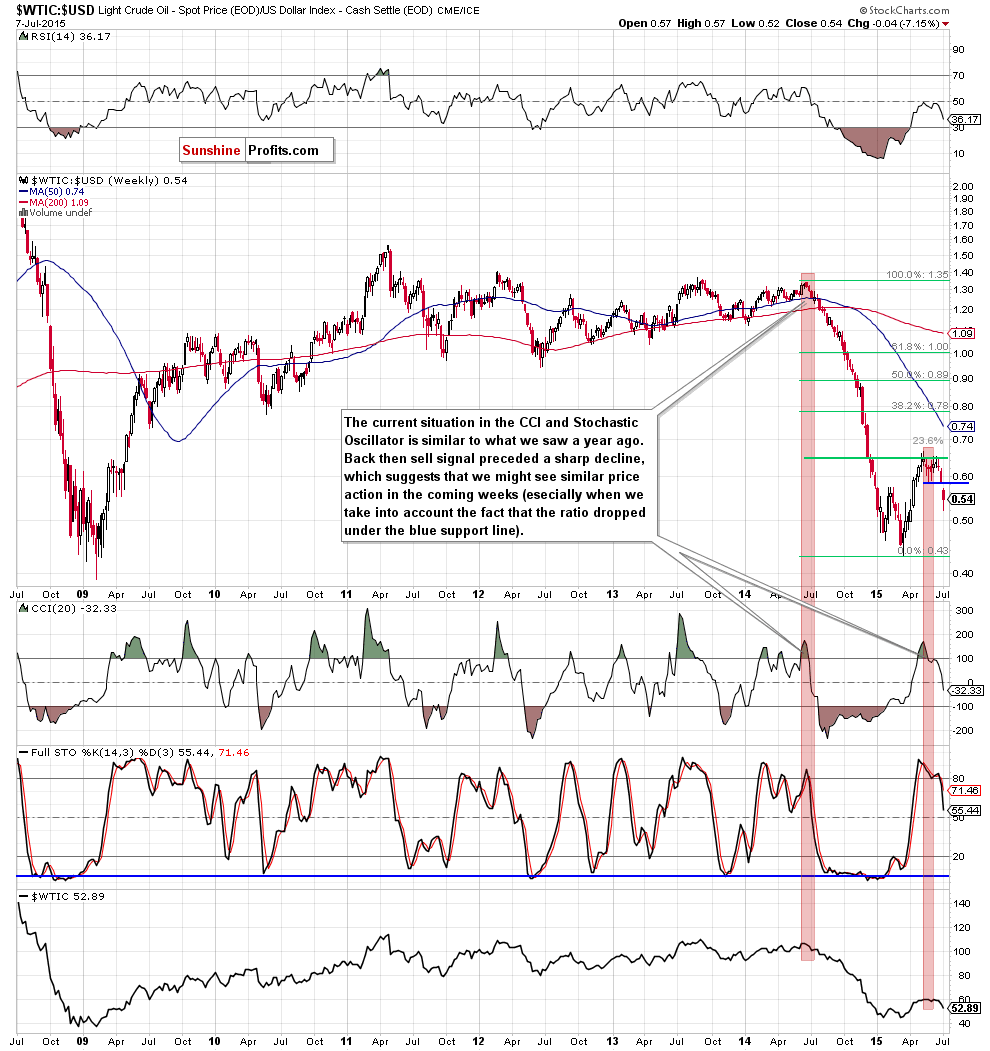
(…) the current situation in the CCI and Stochastic Oscillator is similar to what we saw a year ago. Back then, sell signals generated by the indicators preceded a sharp and sizable decline, which took the commodity below $50. Taking this fact into account, it seems that history will repeat itself once again and we’ll see lower values of the ratio and crude oil in the coming week(s). If this is the case, the initial downside target would be around 0.573, where the Feb highs are.
As you see on the chart, the ratio opened this week below the last week’s close, creating a gap, which serves as the nearest resistance at the moment. This bearish development triggered further deterioration, which resulted in a drop well below our initial downside target from the last update.
At this point it is worth noting that although we saw a rebound yesterday, the ratio is still trading under the Feb highs and well below the gap, which means that as long as here is no comeback above 0.587 (the upper border of the gap), further improvement in the ratio (and also in crude oil) is not likely to be seen. Taking this fact into account, and combining it with sell signals generated by the indicators, we believe that further declines in the ratio and crude oil are more likely than not.
Non-USD Crude Oil Price
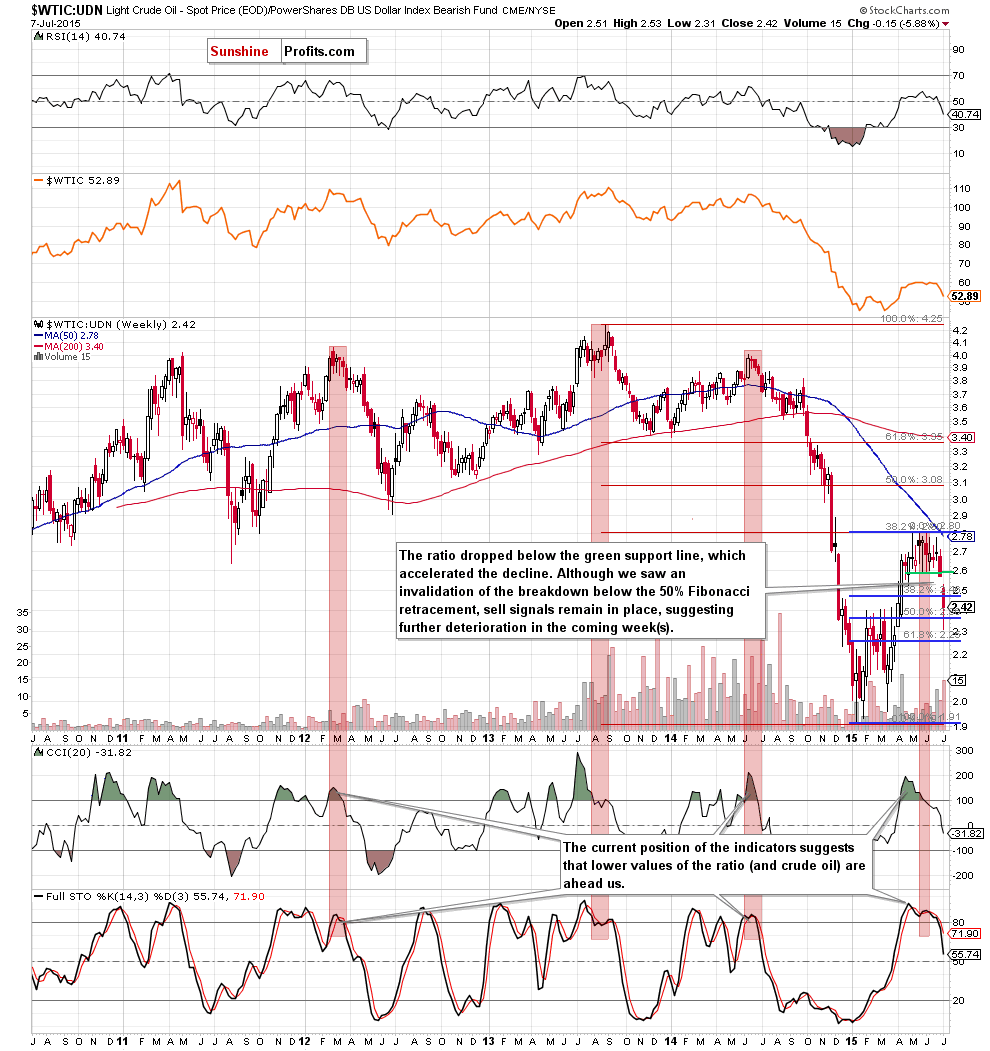
Know the situation for the above ratios, let’s move on to the non-USD (WTIC:UDN ratio) chart of crude oil. As a reminder, UDN is the symbol for the PowerShares DB US Dollar Index Bearish Fund, which moves in the exact opposite direction to the USD Index. Since the USD Index is a weighted average of the dollar's exchange rates with world's most important currencies, the WTIC:UDN ratio displays the value of crude oil priced in "other currencies".
In our June’s Oil Investment Update, we wrote:
(…) although there were several attempts to break above the 38.2% Fibonacci retracement level (based on the entire Aug-Jan decline) they all failed, which resulted in a another decline to the green support line. (…) the current position of the indicators (the CCI generated a sell signal, while the Stochastic Oscillator is extremely overbought) suggests that further declines are just around the corner. At this point, it is worth noting that similar readings of these indicators have preceded declines in the past, which increases the probability of reversal. Nevertheless, in our opinion, the correction will accelerate if the ratio drops under its major support line at 2.59.
The first thing that catches the eye on the above chart is a breakdown below the blue support line based on the Jun lows. This bearish signal triggered further deterioration earlier this week, which resulted in a drop below the 50% Fibonacci retracement. Although the ratio rebounded and invalidated this breakdown, we believe that as long as there is no invalidation of the breakdown below the blue line (which serves as resistance at the moment) and the gap between the last week’s close and this week’s open is in play further improvement in the ratio (and higher values of crude oil) are not likely to be seen. Additionally, sell signals remain in place, supporting declines.
Scenarios
Just like a month ago, today’s Oil Investment Update includes scenarios of what could happen in the coming weeks. Naturally, we will continue to monitor the market in the coming days and if anything invalidates our long-term outlook we will send you an additional message.
Bullish scenario
If crude oil invalidates the breakdown below the Feb highs and closes the gap between the last week’s close and this week’s open (an increase above $56.50), we may see another test of the major resistance zone (currently around $61.65-$61.85) created by the long-term blue resistance line and the 200-month moving average (marked on the monthly chart).
Bearish scenario
If the commodity closes the day below the 61.8% Fibonacci retracement and the psychologically important barrier of $50, we’ll see a test of the support zone created by the Apr low, the 76.4% and 78.6% Fibonacci retracement levels (around $46.73-$47.17). If this solid area is broken, the next downside target for oil bears would be around $44.70 (the 88.6$ retracement) or even the 2015 low of $42.41.
Summary
Although crude oil bounced off the psychologically important barrier of $50 and the 61.8% Fibonacci retracement, the commodity closed yesterday’s session under the previously-broken zone created by the Feb highs, which suggests that the upswing could be just a verification of earlier breakdown. Additionally, yesterday’s move was much smaller than the previous upswings (at the end of May and later in June), which clearly means that the short-term downward trend remains in place, suggesting lower values of the commodity. On top of that, the oil-to-oil stocks, oil-to-gold, WTIC:USD and WTIC:UDN ratios opened this week well below the last week’s closing prices, creating gaps, which serve as resistance areas that support oil bears and declines (as long as they are open further improvement in the ratios and also in crude oil is not likely to be seen). This bearish scenario is also reinforced by the rising oil stocks-to-oil and stocks-to-oil ratios (many times in the past higher values of these ratios have triggered declines in crude oil) and sell signals generated by the weekly indicators.
Very short-term outlook: bearish
Short-term outlook: bearish
MT outlook: bearish
LT outlook: bearish
Trading position (short-term; our opinion): Short positions with a stop-loss order at $65.23 are justified from the risk/reward perspective. We will keep you – our subscribers – informed should anything change.
This completes this month’s Oil Investment Update. Our next Oil Investment Update is scheduled for Thursday, Aug 6, 2015. Oil Trading Alerts subscribers will additionally receive similar but shorter alerts on a daily basis (or more than once a day when the situation requires it). You – Oil Investment Updates subscribers – will receive short Investment Alert messages should the outlook for the medium or long term change before the next Update is posted.
Thank you.
Nadia Simmons
Forex & Oil Trading Strategist
Oil Investment Updates
Oil Trading Alerts

