
Let’s start today’s Update with an important administrative announcement.
Based on the current scope of our two services dedicated to Oil Investors and Traders: Oil Investment Updates and Oil Trading Alerts and feedback to both of them, we have decided to adjust the form of the former service.
In their current form, Oil Investment Updates have been useful mostly to long-term investors and medium-term traders, because short-term trades require additional frequent updates in the form of daily alerts – which is what the Oil Trading Alerts service is all about.
Consequently, short-term traders didn’t get a significant amount of new information from the Investment Updates over what they had already read in their Trading Alerts.
Long-term investors that aim to focus and profit on major price moves were updated on a weekly basis, which was more than enough. At first sight it seems like good news because these investors were receiving more information. However, information related to short-term trades was not really useful as it’s not what long-term investors care about. In this way, this additional information might have been an obstacle in enjoying the updates as long-term investors had to make sure that the information that they were reading and taking into account while making investment decisions regarded their preferred investment horizon, and was not an indication of what was likely to happen in a day or two.
In this way, for long-term investors, less might be more. Consequently, we will be adjusting the form of Oil Investment Updates and the frequency of their publication.
As far as the form is concerned, starting from the next Update, we will focus less on the very short-term trends, but at the same time we will start adding a section with scenarios that will outline the ways in which the situation on the crude oil market will be likely to evolve in the following weeks. Each scenario will be accompanied by a description of its likelihood and suggested actions. In this way, you will be better prepared for what’s to come than you have been so far.
As far as the frequency is concerned, Oil Investment Updates will move from a weekly publication schedule with no interim messages to monthly publication with interim messages (Investment Alerts) sent as soon as the medium- and long-term outlook changes. The Investment Alerts will be included in the service at no additional cost and sent out whenever the situation requires it.
Consequently, thanks to adjusting the way the Oil Investment Updates service works, you will get less text to read, but what you’ll get will likely do a better job in keeping you up-to-date as far as medium- and long-term trends are concerned and you will be informed about changes faster.
The next Oil Investment Update will be posted on January 7 (and the following Updates will generally be posted on the first Tuesday of the month) and it will include the already mentioned scenario analysis. Starting today you will be receiving Investment Alerts if the medium- or long-term trends change. In other words, from today you are being kept up-to-date at all times – even if there is nothing posted, you can rest assured that we are monitoring the situation (we have been monitoring it on a continuous basis anyway in order to keep the Oil Trading Alerts subscribers up-to-date) and will report to you as soon as it’s necessary.
As far as the market situation is concerned, there’s not much that we can comment on today, as a lot depends on what happens during the Fed meeting this week. Currently, opinion remains divided on whether the Fed will move this week or wait until January - or even March. Growth in jobs, retail sales, services and overall output in the world's biggest economy - combined with last week's breakthrough budget deal in Washington fueled concerns amid oil investors that the Federal Reserve could make a small cut to its asset purchase program at its policy meeting. As a reminder, a cut in its stimulus would boost the dollar, weighing on most commodities, including oil, that are priced in the currency. However, when we take a closer look at the charts of light crude, we notice that there were periods of time when crude oil moved higher in tune with the greenback. Consequently, higher values of the dollar do not necessarily mean lower oil prices. Additionally, even if the Fed decides to move toward tapering its bond buying program, it will suggest that the U.S. economy is recovering and, as is well known, an improving economy means that oil demand may grow, which will likely trigger a move up in light crude.
Please note that today oil investors will get inflation data from the U.S., which will probably shape the final expectations going into the meeting, because that has been one of the things that has been holding the Fed back.
Crude Oil
To see what the crude oil market itself can tell us, let's jump straight into the technical part of this week‘s Oil Investment Update. Just like in previous weeks, we’ll take a look at charts in different time horizons to have a more complete picture of the current situation in the market.
Let’s start with a look at the monthly chart of light crude (charts courtesy by http://stockcharts.com).
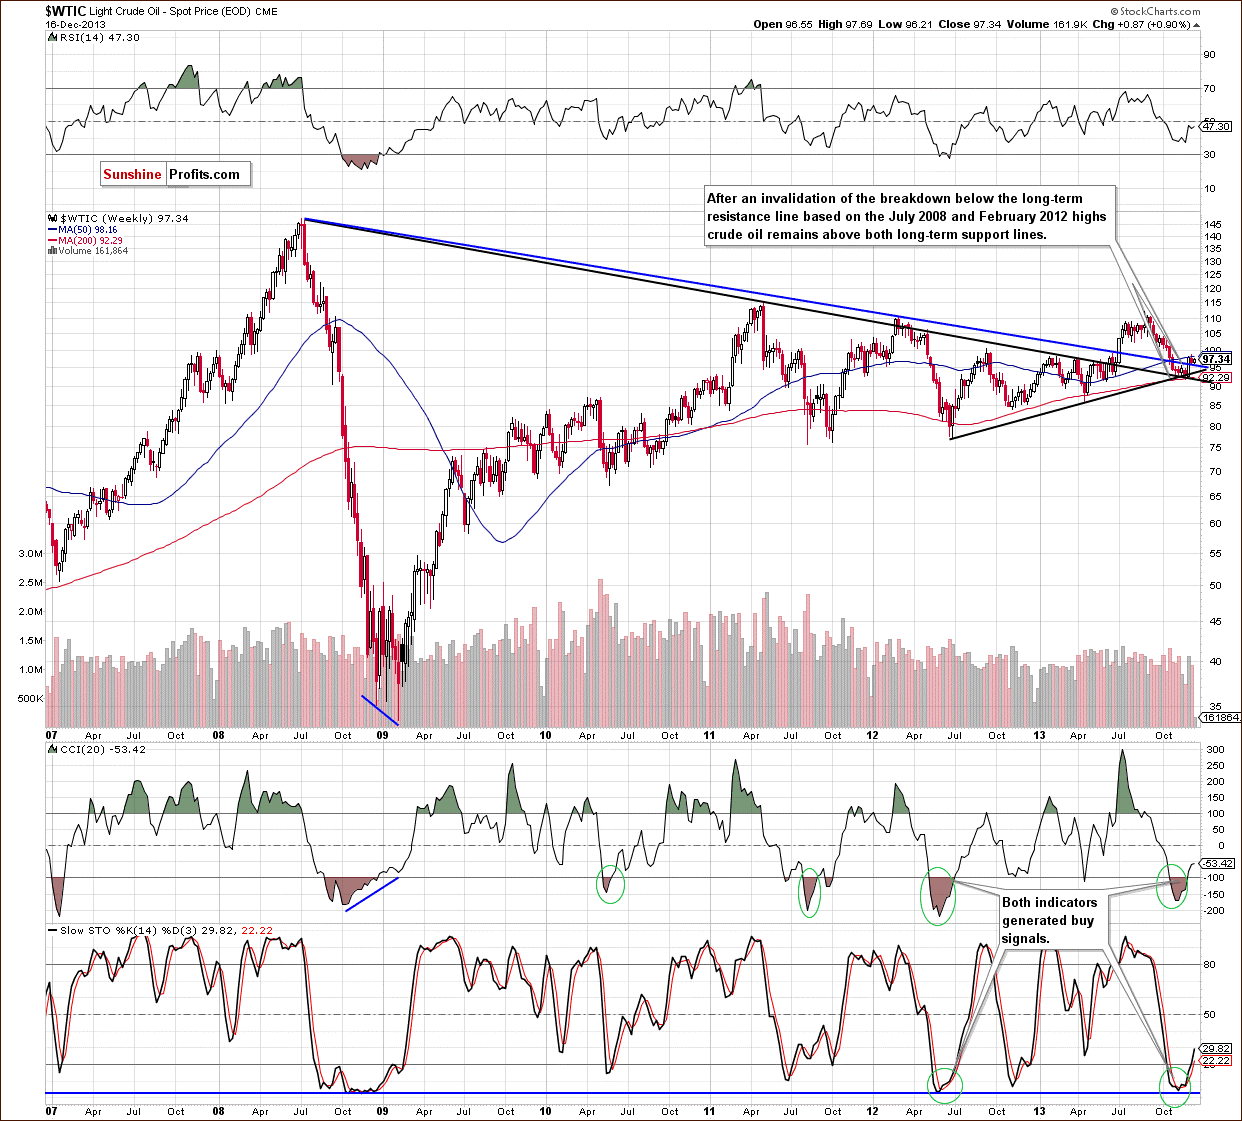
The situation in the long-term chart hasn’t changed much recently. After an invalidation of the breakdown below the long-term support/resistance line based on the July 2008 and February 2012 highs, the XOI paused the rally in the previous week. Despite a small drop, it still remains above both long-term support lines and buy signals generated by the CCI and Stochastic Oscillator remain in place.
From this point of view, the situation is mixed with bullish bias.
Now, let’s zoom in on our picture of the oil market and see the weekly chart.
In our last Oil Investment Update, we wrote the following:
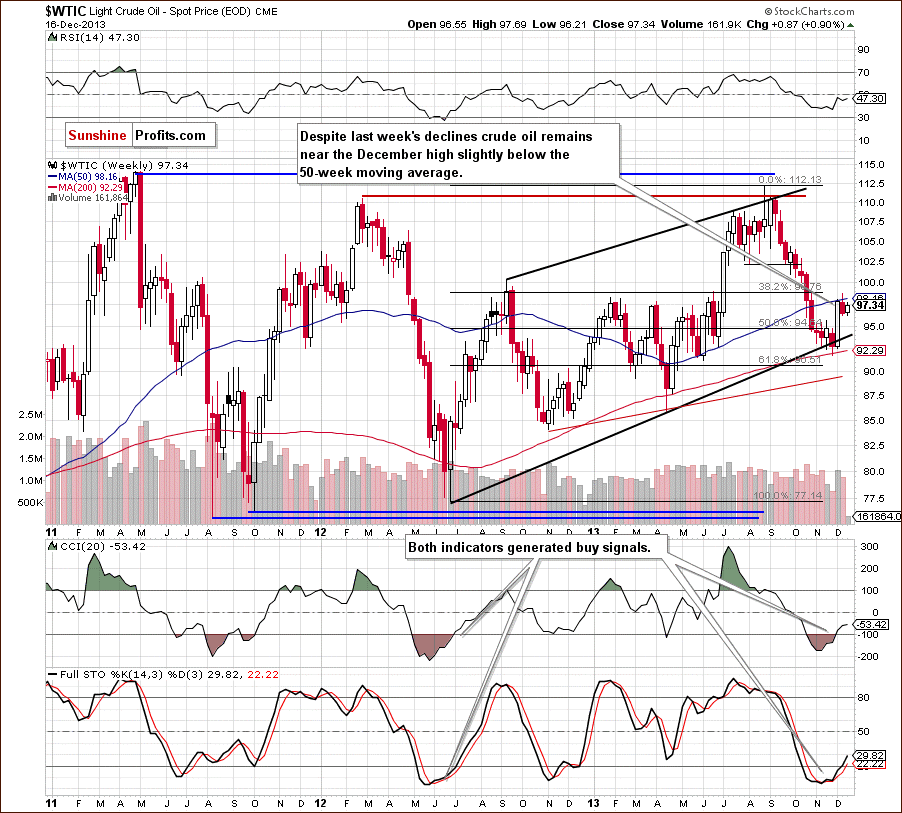
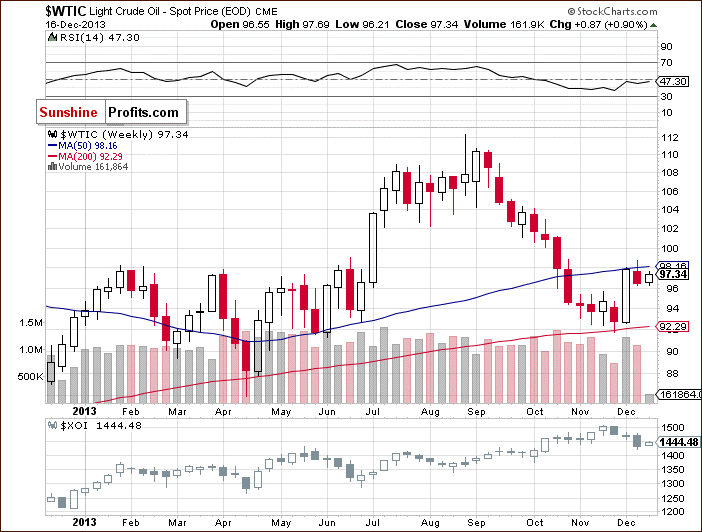
(…) light crude bounced off in the previous week and invalidated the breakdown, which is a strong bullish sign. In this way, crude oil reached its first resistance created by the 50-week moving average. Therefore, pause or a pullback should not surprise us. Please note that both indicators on the above chart generated buy signals, which supports the bullish case.
Looking at the above chart, we see that we had such price action in the previous week. Light crude bounced down from its 50-week moving average and declined below $97. Despite this fact, we clearly see that the recent corrective move was shallow, which is a bullish signal. At the beginning of this week crude oil reversed course and taking the above into account, we will likely see another attempt to move above the 50-week moving average. If oil bulls do not fail, we may see further improvement and an upswing above $100.
Now, let’s check the short-term outlook.
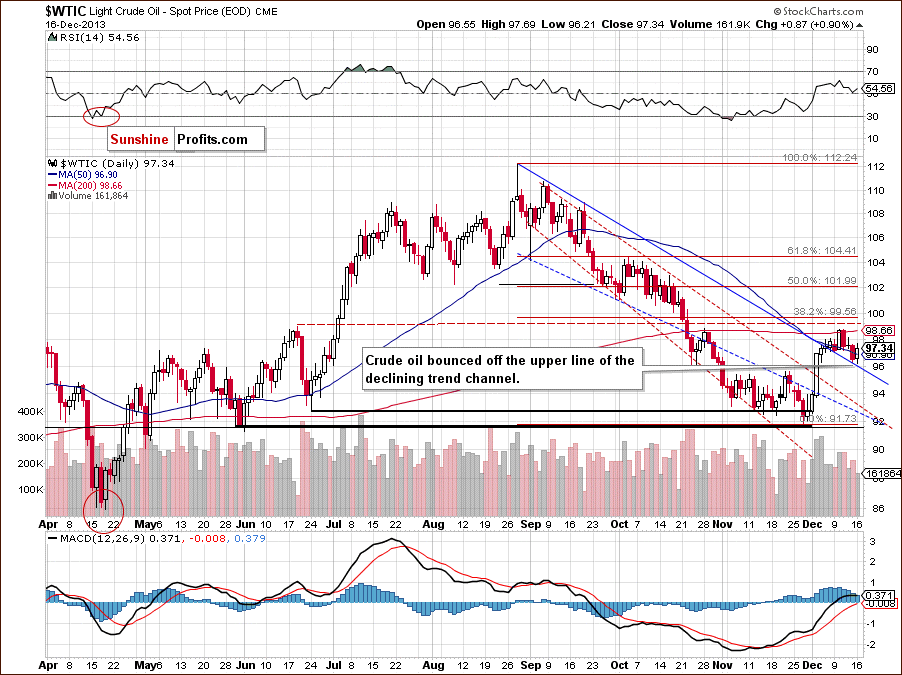
As you can see on the above chart, at the beginning of the previous week crude oil reached the 200-day moving average, which had successfully stopped growth at the end of October. Similarly to what we saw at that time, this strong resistance encouraged oil bears to act and resulted in a decline, which took light crude to the upper border of the declining trend channel (in terms of intraday highs) once again. Despite last week’s drop, the buyers didn’t give up and managed to push the price higher on Monday. With this upward move, crude oil invalidated the breakdown below the 50-day moving average, which is a positive signal. Nevertheless, it is still trading below the 200-day moving average, which serves as major short-term resistance and keeps further growth in check.
Summing up, looking at the above charts, we clearly see that although crude oil gave up the gains in the previous week and declined below $97, the long- and short-term support lines successfully stopped further declines. Additionally, the recent corrective move is still shallow and it hasn’t even reached the 38.2% Fibonacci retracement level based on the recent rally, which is a bullish signal. Therefore, we may see further improvement. However, as long as crude oil remains below its 200-day moving average, it seems that any upward move is limited.
Having discussed the current outlook for crude oil, let’s examine the NYSE Arca Oil Index (XOI) to find out what the current outlook for oil stocks is.
Oil Stocks
Just like a week ago, we begin with the long-term chart.
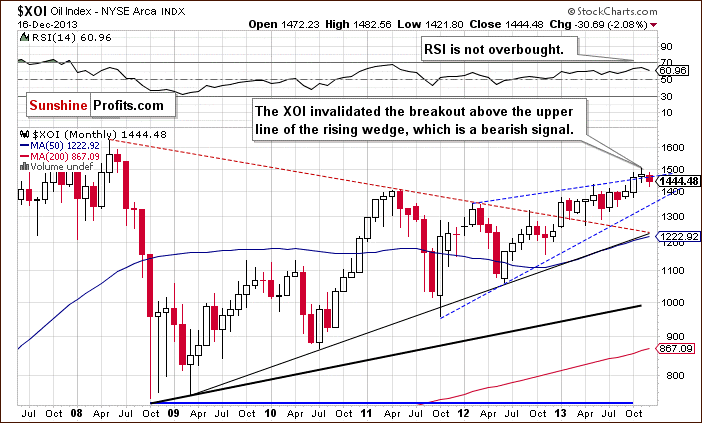
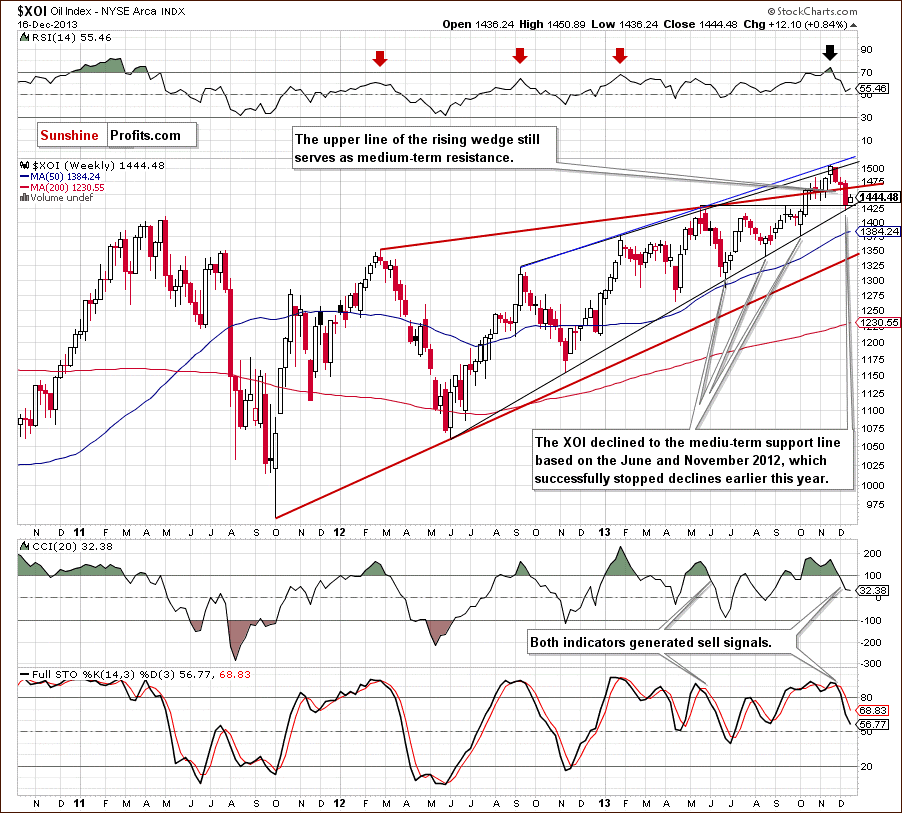
On the above chart, we see that the situation has deteriorated recently. The oil stock index extended its declines and dropped below the upper line of the rising wedge. From this perspective the breakout that we saw in October was invalidated, which is strong bearish signal and we may see further deterioration.
To see the current situation more clearly, let’s zoom in on our picture and move on to the weekly chart.
In our last Oil Investment Update, we wrote the following:
(…) taking into account the position of the RSI and the sell signals generated by two other indicators, we may see further deterioration this week. Please note that if this support line is broken, the next target for sellers will be around 1,439, where the bottom of the previous correction is.
Looking at the above chart, we see that sellers broke below the upper line of the rising wedge in the previous week, which triggered further declines and took the XOI to its downside target. As you can see on the weekly chart, with this downward move the oil stock index reached the medium-term support line based on the June and November 2012 lows, which successfully stopped declines earlier this year. We saw such situations in June, August and also in October. From this perspective, if history repeats itself once again we may see similar price action this (or next) week. Nevertheless, this time, before we see higher values of the XOI, the buyers will have to break above the upper line of the rising wedge, which serves as major medium-term resistance (currently around 1,463). If they manage to do that, we may see an upward move to at least 1,483 where the resistance level created by the previously-broken 2013 high is. The next upside target will be the psychological barrier of 1,500.
What could happen if the buyers fail? If the sellers push the XOI below the medium-term support line we will likely see further deterioration and the downside target will be the psychological barrier of 1,400. If it’s broken, the next target will be around 1,376, where the bottom of the Sept.-Oct. correction is.
From the technical point of view, the medium-term uptrend remains in place at the moment, and the situation is still bullish.
Now, let’s turn to the daily chart.
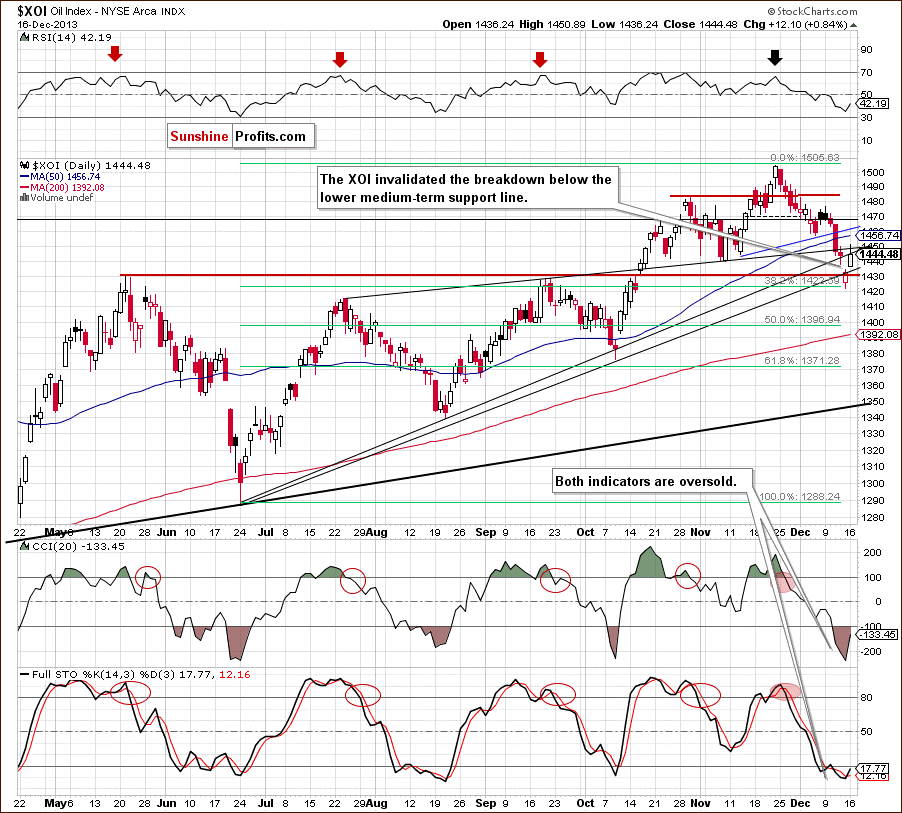
Looking at the above chart, we see that the XOI declined in the previous week once again and dropped below the bottom of the corrective move that we saw at the beginning of November (at 1,439). In this way, the oil stock index also slipped below the upper line of the rising wedge (marked with the black thin line) and two medium-term support lines (the upper one is based on the June and August lows and the lower one is created by the June and October lows). However, when we take a closer look at the chart, we see that the XOI reversed course after reaching the 38.2% Fibonacci retracement level based on the entire June-November rally. As you can see on the daily chart, this support encouraged buyers to act, and resulted in an upswing, which push the index above the May high.
Despite this growth, the combination of the previously-broken upper medium-term rising support line and the upper line of the rising wedge stopped further improvement and the XOI closed Monday below this resistance zone. If the buyers do not give up and the oil stock index comes back above this lines, we may see an upward corrective move to at least 1,456-1,461 where the 50-day moving average and the previously-broken neck line of the head and shoulders pattern are. On the other hand, if the buyers fail, we will likely see a pullback to the lower rising support line (currently around 1,435) or even to the Friday low at 1,421.
Summing up, from the long-, medium- and short-term perspectives, the situation has deteriorated. However, although we saw an invalidation of the long-term breakout (which is a bearish signal), oil stocks reached very a important medium-term support line based on the June and November 2012 lows, which successfully stopped declines earlier this year. Additionally, the XOI reached the 38.2% Fibonacci retracement level based on the entire June-November rally, which suggest that the sentiment for oil stocks may turn positive in the near future.
Crude Oil - Oil Stocks Link
Having discussed the current situation in crude oil and the oil stock index, let’s comment on the relationship between them.
When we take a look at the above chart and compare the price action in both cases in the previous week, we see that crude oil and oil stocks moved lower together. Yesterday, we also saw light crude and oil stocks move higher together.
At this point, you may ask the following question: does it mean that the strong negative correlation reversed as we have seen similar price action in both oil and oil stocks in recent days? Not necessarily. Although the WTI and the XOI are moving in the same direction at the moment, after weeks of negative correlation it’s too early to say if this is a meaningful reversal of the tendency or just a temporary phenomenon.
However, if this positive correlation remains in place, we will likely see further improvement in both cases. What could happen if it reversed this (or next) week? Similarly to what we wrote 2 weeks ago in our Oil Investment Update, if this positive correlation is only temporary and see a return to a negative relationship between them once again, higher values of oil stocks will trigger lower values of crude oil (and vice versa).
Ratio Analysis
Once we know the current relationship between crude oil and oil stocks, let’s take a closer look at the oil-stocks-to-oil ratio. What impact could it have on future oil moves? Let’s start with the long-term chart.
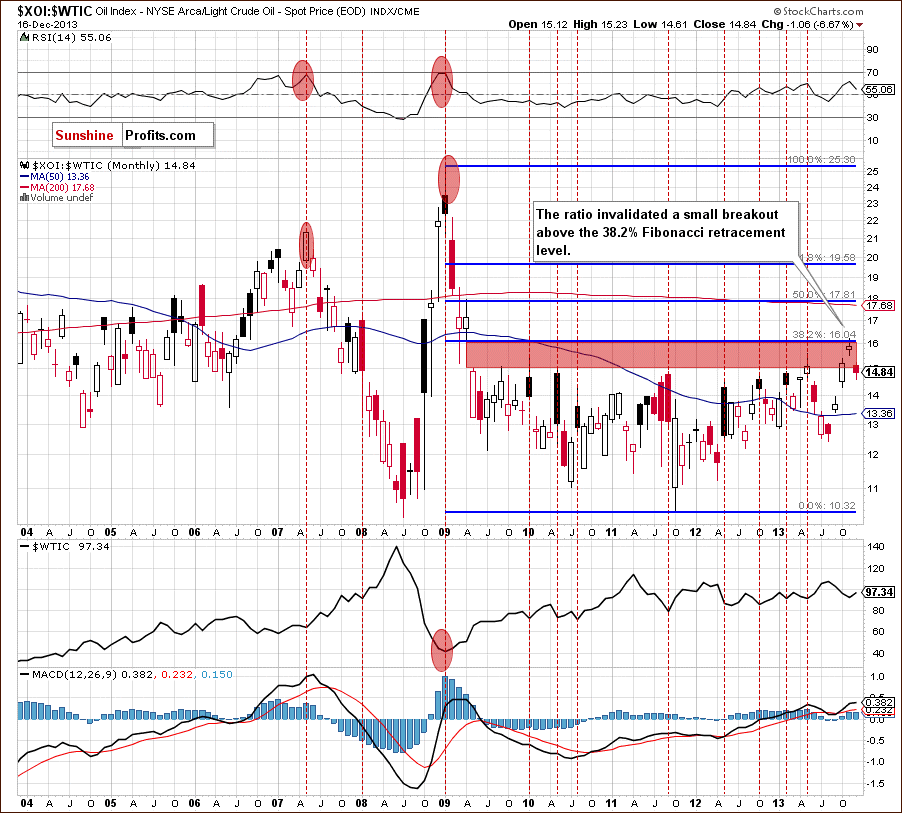
Looking at the above chart, we see that after an invalidation of a small breakout above the 38.2% Fibonacci retracement level (based on the entire 2009-2011 decline), the ratio declined and dropped below the lower line of the gap between the April 2009 low and May 2009 high (marked with the red rectangle), which is not supporting further growth. Please note that in most previous cases since 2009 such price action has triggered higher values of light crude.
Now, let’s zoom in on our picture and examine the weekly chart.
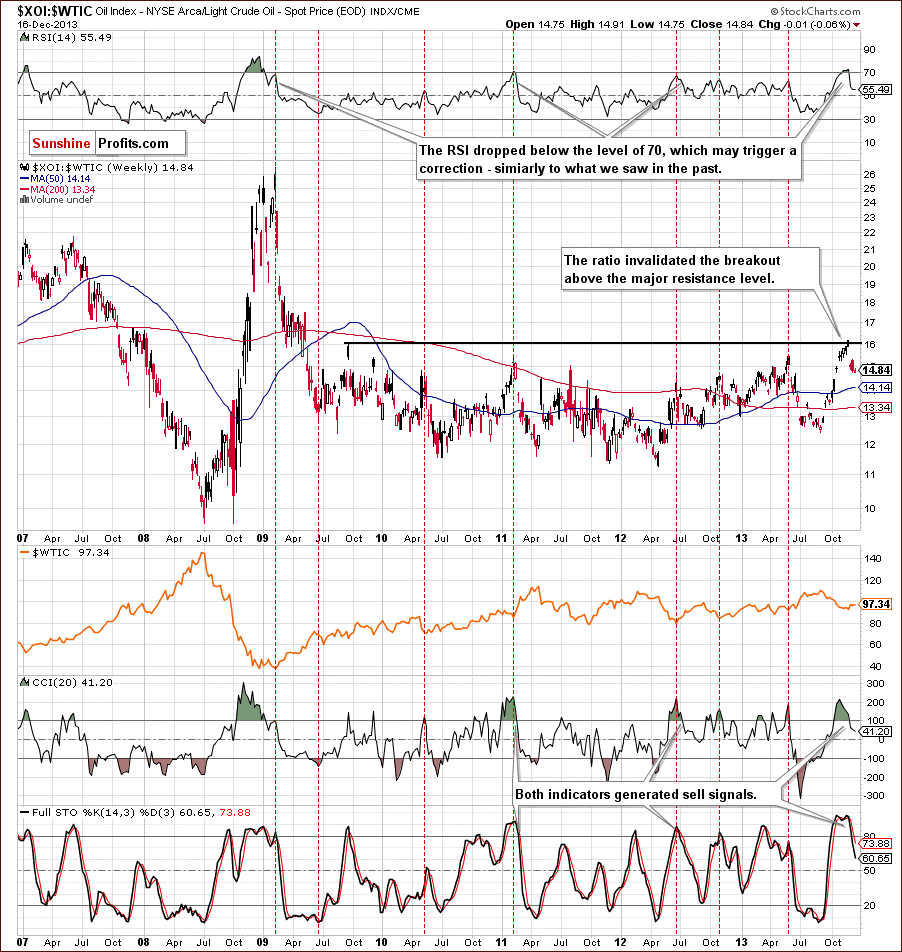
Quoting our last Oil Investment Update:
(…) the RSI dropped below the level of 70, which suggests further deterioration in the ratio. We saw similar situations in the past and in all previous cases such circumstances had a positive impact on the price of light crude. When we factor in the position of the CCI and the Stochastic Oscillator, we clearly see that both indicators generated sell signals, which is another bearish signal.
Looking at the above chart, we see that the medium-term sell signals remains in place and suggest lower values of the ratio, which will likely push crude oil higher. However, taking into account the fact that the ratio corrected 38.2% of its Aug.-Nov. rally, we may see a pause or even a small upward correction before further deterioration.
Combining the long- and medium-term pictures, we can conclude that the implications for crude oil are bullish and further growth in crude oil is just around the corner.
Having discussed the above, let’s focus on the oil-to-gold ratio in the medium term. Will it give us some interesting clues about crude oil’s future moves?
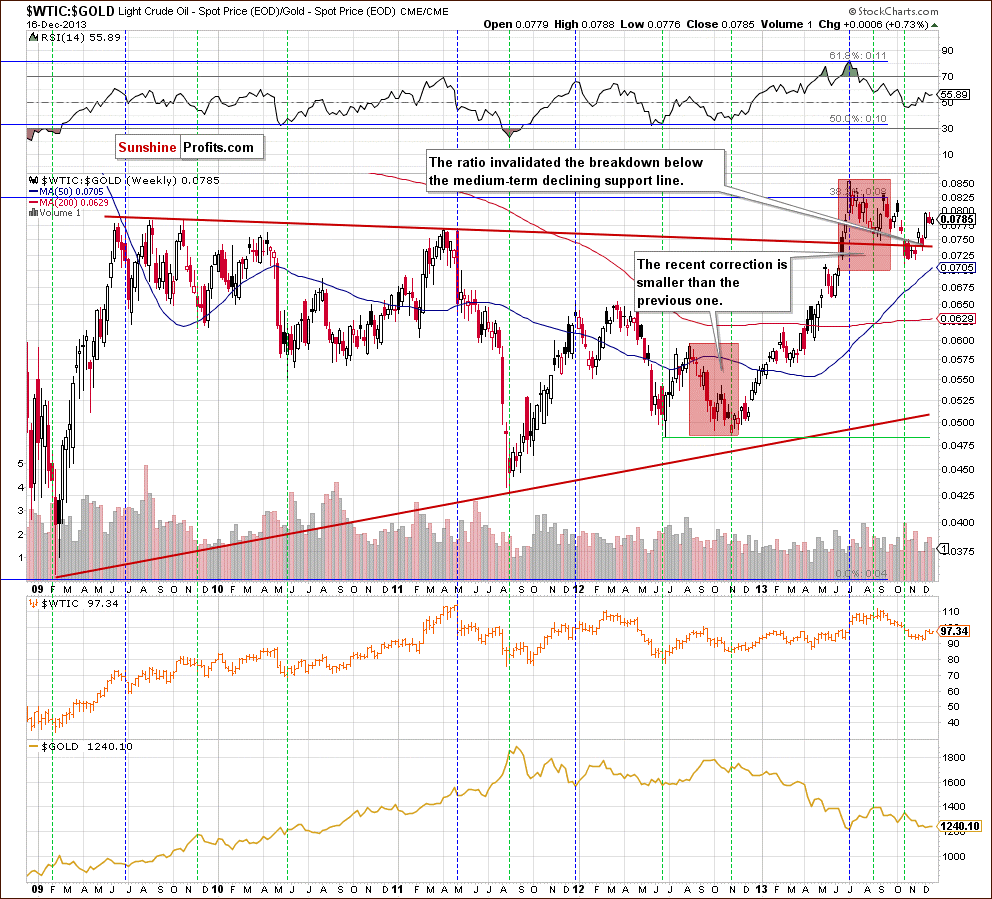
Looking at the above chart, we see that the ratio paused after a sharp rally, however, it still remains near last week’s high. Taking this fact into account, we may see further improvement in the near future and what we wrote in our previous Oil Investment Update remains up-to-date:
(…) the rising ratio has had a positive impact on the price of crude oil since the beginning of the year. We can assume that higher values of the ratio will likely support the price of light crude.
Summary
From today’s point of view, we see that the situation hasn’t changed much recently. After a rally that we saw at the beginning of the month and an invalidation of breakdowns below the long- and medium-term lines, crude oil gave up the gains and declined in the previous week. Despite this fact, the current corrective move is still shallow and it hasn’t even reached the 38.2% Fibonacci retracement level based on the recent rally. Additionally, yesterday light crude bounced off the short-term support line created by the upper line of the declining trend channel and came back above its 50-day moving average. Looking at the long-term chart, it seems that light crude verified the breakout above the declining support/resistance line, which is another positive sign. On top of that, the oil-stocks-to-oil ratio and the oil-to-gold ratio suggest further improvement in crude oil in coming weeks.
The biggest event of recent days, in case of oil stocks, has been a downward move which took the oil stock index to its downside target. What’s important, with this downward move the XOI reached very important medium-term support line (which successfully stopped declines earlier this year) and the 38.2% Fibonacci retracement level based on the entire June-November rally. Connecting the above facts, we can conclude that the sentiment for oil stocks may turn positive in the near future.
Very short-term outlook: bullish
Short-term outlook: bullish
MT outlook: mixed with bullish bias
LT outlook: mixed with bullish bias
Trading position (short-term): Long. Stop-loss order for this position: $91.55. Stop-loss order for WTI Crude Oil: $91.30. We will keep you informed should anything change, or should we see a confirmation/invalidation of the above.
This completes this week’s Oil Investment Update. Our next Oil Investment Update is scheduled for Tuesday, Jan. 7, 2014. Oil Trading Alerts subscribers will additionally receive similar but shorter alerts on a daily basis (or more than once a day when the situation requires it). You – Oil Investment Updates subscribers – will receive short Investment Alert messages should the medium- or long-term outlook change before the next Update is posted.
Thank you.
Nadia Simmons
Sunshine Profits' Crude Oil Expert
Oil Investment Updates
Oil Trading Alerts

