

In Nov, crude oil broke not only below the psychologically important barrier of $80, but also under the 50% Fibonacci retracement based on the entire 2009-2011 rally, which accelerated declines and resulted in a multi-year low of $65.69. On top of that, the first day of Dec was also very negative for oil investors as the commodity extended losses to $63.72 and slipped below the solid support zone created by the Aug and Sep 2009 lows and the 61.8% Fibonacci retracement level. As is well known, the bear market is one of the hardest times to keep your head on your shoulders, therefore, you are probably wondering where the final bottom is. Before we try to answer this question, we would like to take a closer look at the fundamental factors that have influenced the price recently.
The most important fundamental factor, which watered down the price of crude oil in the previous month was the OPEC’s decision not to cut output to support the oil market. The Organization of Petroleum Exporting Countries said that it would keep its official production target unchanged at 30 million barrels a day. This decision disappointed market participants and crude oil lost over 10%, dropping to its lowest level since Sep 2009 and hitting a low of $63.72 per barrel. Despite this sharp decline, the commodity rebounded on the following trading day, supported by expectations that U.S. shale producers will cease production. The reason? The Saudi's costs of production are typically very low (less than $10 per barrel), while in the United States’ shale complexes they are ranging from $35-80 per barrel or even more. This means that if the price of the commodity will stay below $80 for a long period of time, it will be unprofitable for producers and may lead them to stop production, which could trigger drops in crude oil inventories. As you know from our previous Oil Investment Updates, declines in light crude stockpiles usually translate to higher prices. Therefore, any news that U.S. shale producers will stop (or cut) production will be supportive for the commodity.
Are there any other technical factors that could encourage oil bulls to push the buy button? In the November’s Oil Investment Update we wrote that a stronger greenback had been one of the major driving forces behind drops in the commodity. Since then, most solid U.S. economic data pushed the USD Index (which tracks the performance of the U.S dollar against a basket of six major rivals) higher, making crude oil more expensive for buyers in other currencies. However, yesterday’s ADP report showed that the U.S. private sector created 208,000 jobs in November, missing expectations for jobs growth of 223,000 and down from 233,000 in October. In this way, the number approached 200,000, which fueled fears that Friday's official November jobs report may indicate that the labor market may be softening. If the numbers disappoint, it will likely weaken the U.S. currency and support crude oil, making it more attractive in dollar-denominated exchanges. Nevertheless, we should keep in mind that weaker-than-expected jobs data could be a double-edged sword, because higher unemployment could lead to lower demand for gasoline as less people commute to jobs. Will the coming data support or push the commodity lower? Before we know the answer to this question, let’s jump in to the world of charts to find out what are they saying about future moves (charts courtesy of http://stockcharts.com).
Crude Oil
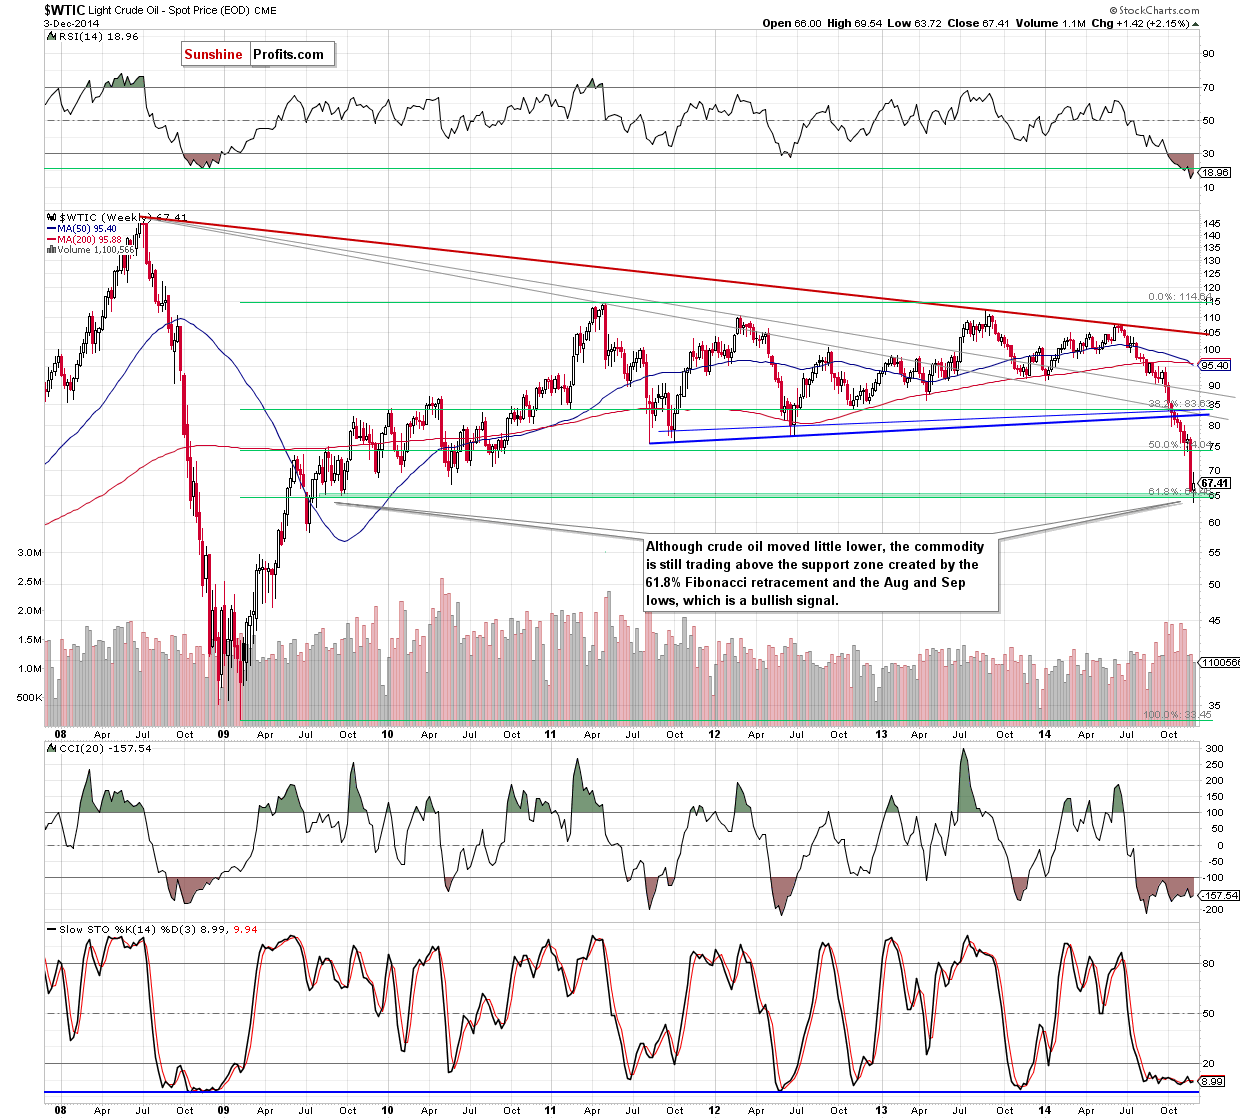
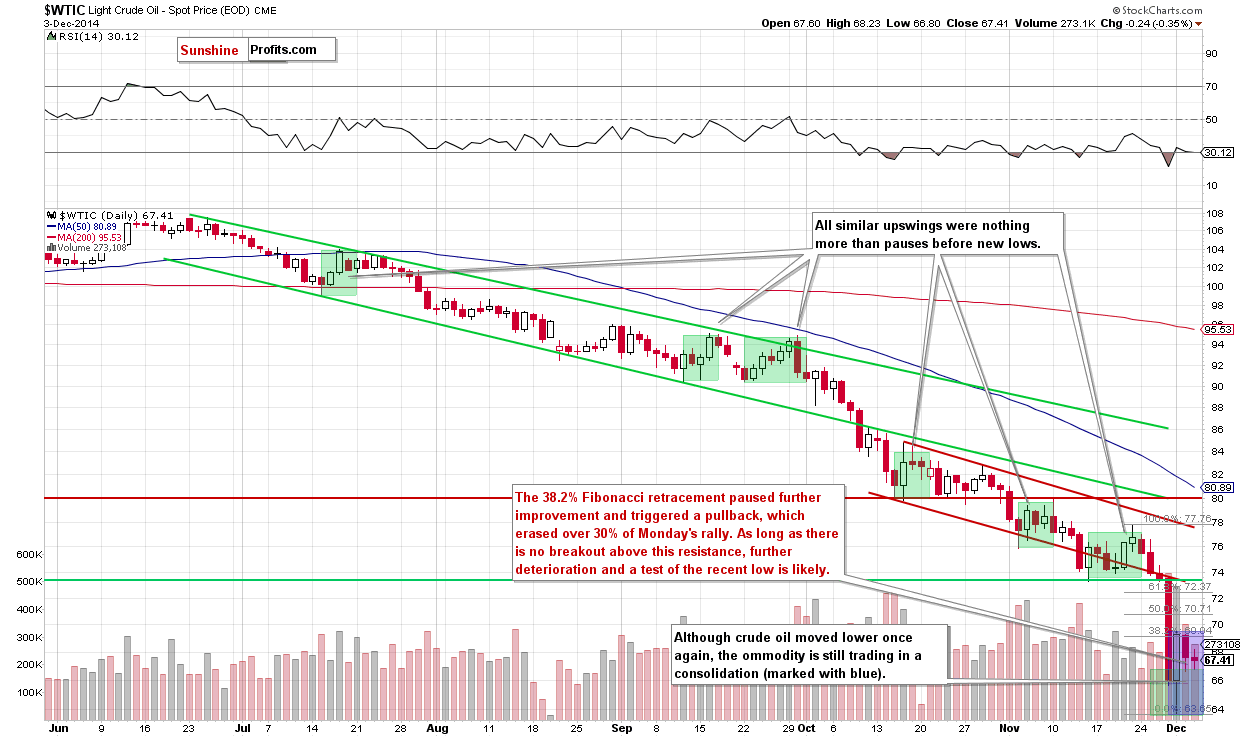
Looking at the above charts, we see that the situation in crude oil has deteriorated significantly since our last Oil Investment Update was posted. As you see the drop below the solid support zone created by the 50% Fibonacci retracement (based on the entire 20112013 rally), the Nov lows and the lower border of the declining trend channel (marked with red on the daily chart) triggered a sharp decline, which took the commodity to a fresh multi-year low of $63.72. With this downward move, light crude slipped slightly below the 61.8% Fibonacci retracement, but invalidated the breakdown very quickly. This bullish signal triggered a corrective upswing on Monday, however, the 38.2% Fibonacci retracement based on the recent decline (launched on Nov 21) stopped further improvement and we saw a pullback in the following days. Did this move change anything? Not really, because as long as the commodity is trading in a narrow range between the solid support zone (created by the 61.8% Fibonacci retracement and the Aug and Sep 2009 lows) and the 38.2% Fibonacci retracement, bigger upswing or downswing is not likely to be seen and a test of the strength of the recent low can’t be ruled out.
Finishing this part of Oil Investment Update we want you to keep in mind that Monday’s upswing was much bigger ($5.82) than the previous ones and materialized on huge volume, which is a positive step toward the trend reversal. Why just such an increase was so important? Because since mid-Jul all smaller corrective upswings were nothing more than pauses before new lows. Therefore, we think that if this week’s move won’t be followed by a fresh multi-year low, the final bottom might be already in. At this point some of you may ask: what if oil bulls fail and crude oil will move lower? In this case, we’ll see further deterioration and a drop even to around $58.32-$60, where the Jul 2009 lows (in terms of intraday and weekly closing prices) are. Will we see fresh lows? Before we try to answer this question, we’ll analyze the current situation in the oil stocks index and examine interesting ratios to have a more complete picture of the oil market.
Summing up, although crude oil moved little lower in the recent days, the overall situation is still unclear to open any positions. Additionally, as we have pointed out before, as long as the commodity is trading in a narrow range between the support and resistance lines, bigger upswing or downswing is not likely to be seen. Therefore, waiting on the sidelines waiting for the confirmation that the final bottom is in is the best choice at the moment.
Having discussed the situation in crude oil, let’s examine the NYSE Arca Oil Index (XOI) to find out what the current outlook for oil stocks is.
Oil Stocks
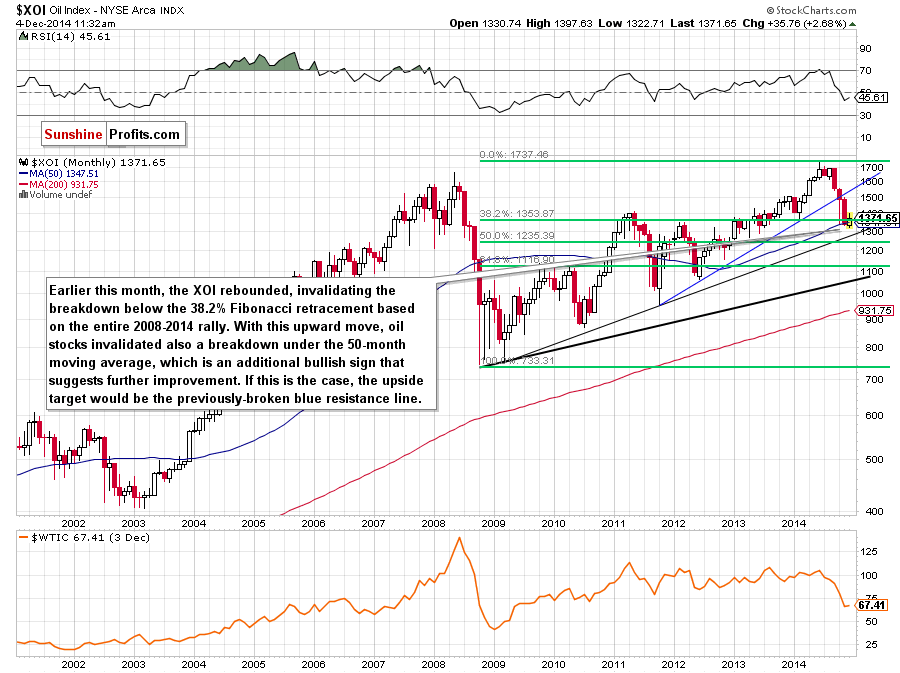
From the long-term perspective, we see that the XOI moved sharply lower in Nov, which resulted in a fresh multi-month low earlier this month. Despite this deterioration, the index rebounded, invalidating earlier breakdown below the 38.2% Fibonacci retracement (based on the entire 2008-2014 rally). With this upward move, oil stocks invalidated also the breakdown under the 50-month moving average, which is an additional bullish sign. At this point, it’s worth noting that we saw similar price action in Jun 2012. Back then, an invalidation of the above-mentioned moving average was followed by further increases. Taking these facts into account, it seems to us that the next move will be to the upside.
Will the medium-term chart confirm this scenario? Let’s check.
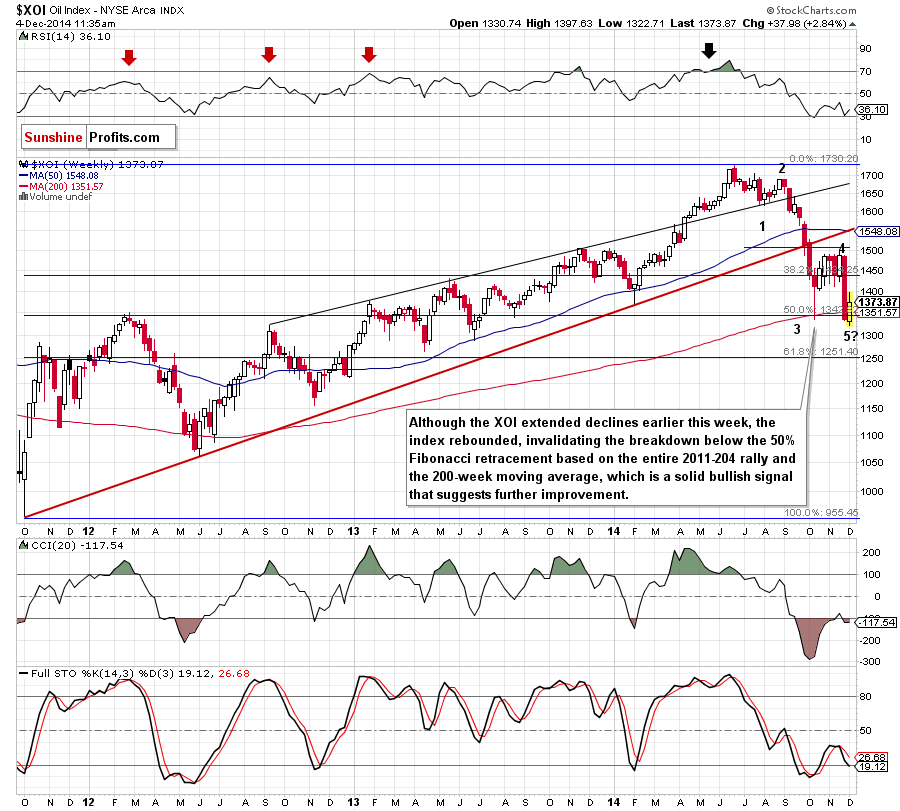
The first thing that catches the eye on the above chart is an invalidation of the breakdown below the 50% Fibonacci retracement on the 2011-2014 increase and the 200-week moving average. As you see on the weekly chart, similar price action in the previous month triggered a corrective move that took the XOI to the psychological barrier of 1,500. Taking into account the fact that history repeats itself, we think that we’ll see similar increase in the coming weeks.
Before we take a closer look at the very short-term picture, we would like to draw your attention to the Elliot waves. In our opinion, the recent downward move could be the last wave in this big multi-month correction. If this is the case, the probability of a rebound is even greater.
Having say that, let’s focus on the daily chart.
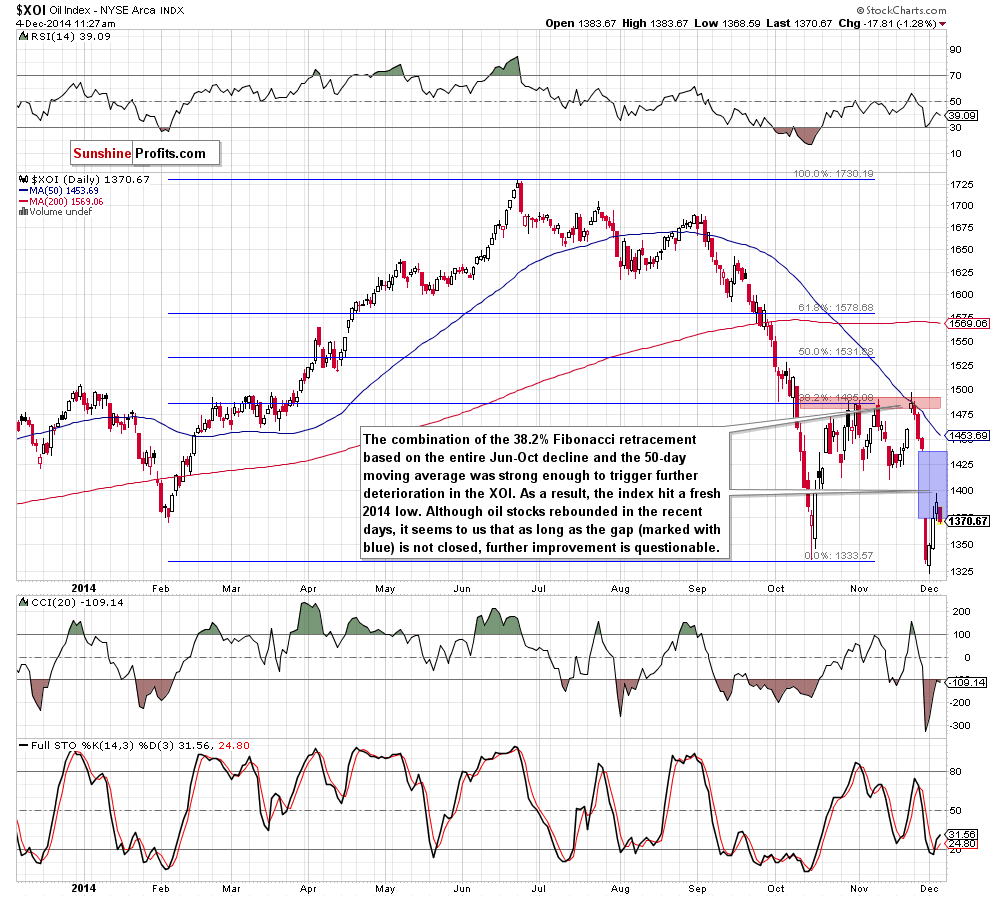
As you on the above chart, the combination of the 38.2% Fibonacci retracement based on the Jun-Oct decline and the 50-day moving average was strong enough to stop the rally and trigger a sharp decline in the XOI. As a result, the index hit a fresh multi-month low, but only slipped below the Oct low. Despite this drop, oil stocks rebounded sharply and climbed to the psychological barrier of 1,400, invalidating earlier breakdown. This is a strong bullish signal, but it seems to us that as long as this resistance is in play and the gap (marked in blue) is open, further improvement is questionable and going long is not justified from the risk/reward perspective.
Summing up, although oil stocks moved higher in recent days, the psychological barrier of 1,400 and the open gap still keep gains in check. Nevertheless, taking into account buy signals generated by the daily indicators and the long- medium-term pictures, it seems to us that oil bulls won’t give up and the next sizable move will be to the upside. In our opinion, the initial upside target would be around 1,500, where the last month’s high is.
Ratio Analysis
Today, we start this section by focusing on the oil stocks-to-oil ratio. What can we infer from the chart below?
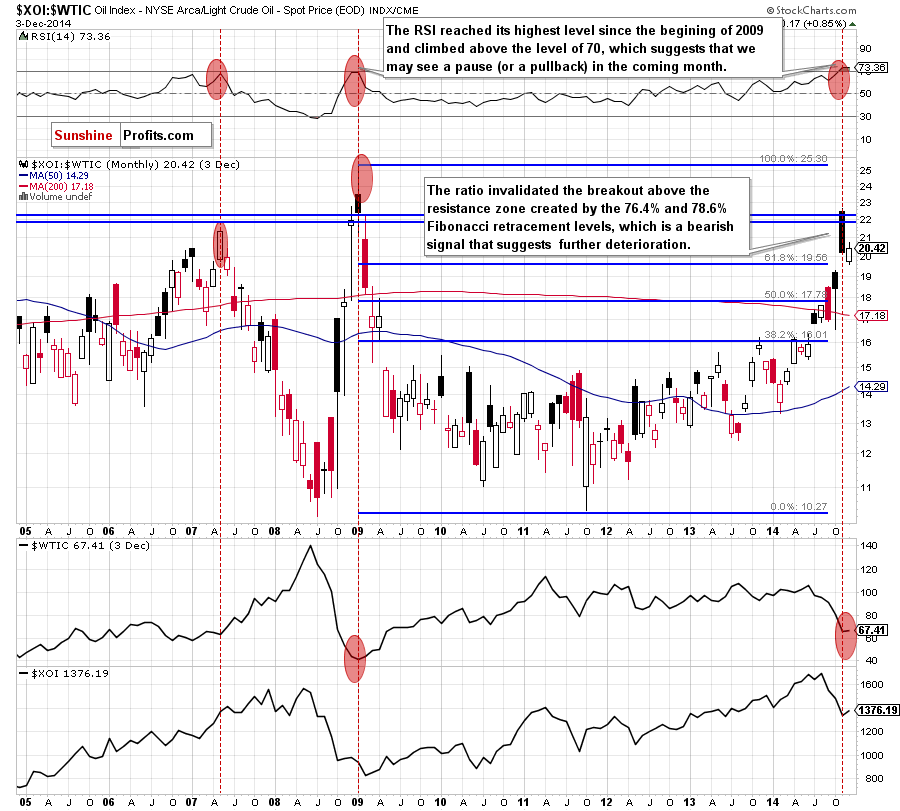
From the long-term perspective, we see that the ratio invalidated the breakdown above the resistance zone created by the 76.4% and 78.6% Fibonacci retracement levels. This is a bearish signal, which suggests further deterioration. What does it mean for crude oil? When you take a closer look at the above chart, you will see that may times in the past local tops in the ratio have corresponded to the crude oil’s lows. We saw such price actions many times in the previous years. Additionally, the RSI increased to its highest level since the beginning of 2009 and climbed above the 70 level, which suggests a pause or a pullback in the coming month. At this point, it’s worth noting that even lower readings of the indicator (in 2007 and 2009) preceded a sharp downward move in the ratio and an upward move in crude oil. Taking these facts into account, we think that we’ll see a corrective upward move in crude oil in the near future.
Can we infer something more from the weekly chart? Let’s find out.
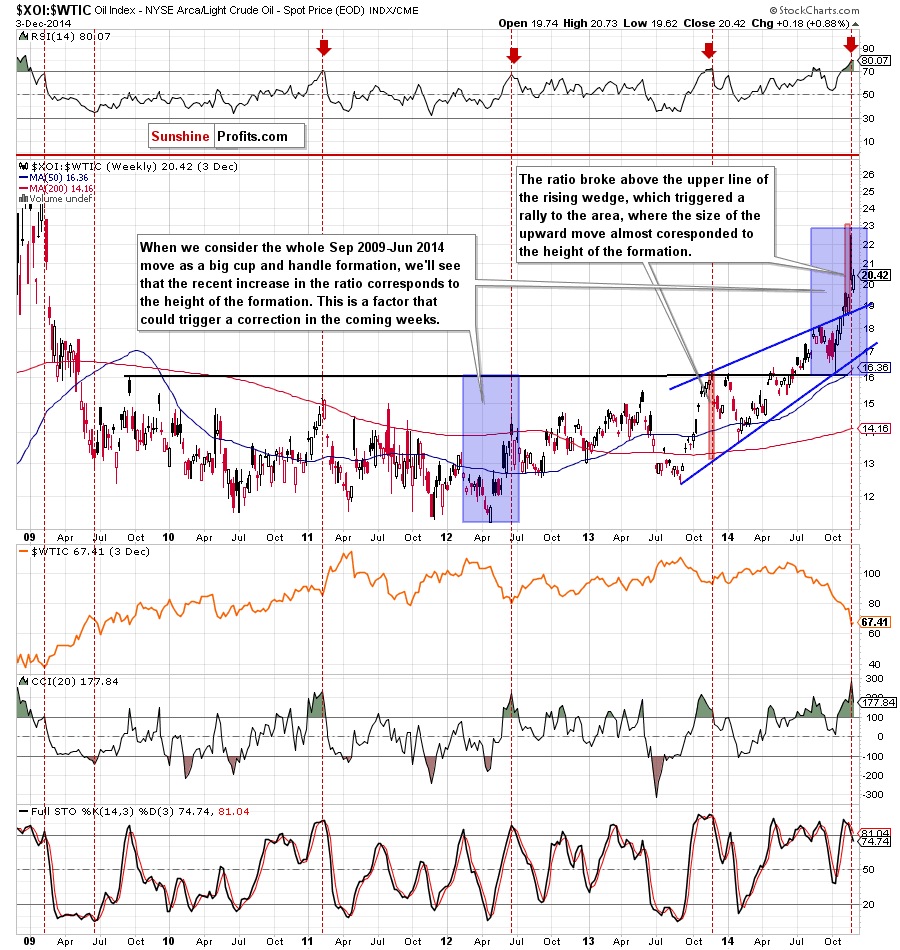
On the above chart, we see that the ratio reached the area where the size of the upward move corresponds to the height of two technical formations: the rising wedge and the cup and handle pattern. This is a factor that may reduce the selling pressure and trigger a correction in the coming weeks. On top of that, the RSI reached its highest level since 2009 (above the level of 80), while the CCI and Stochastic Oscillator are overbought (the latter generated a sell signal). All the above provide us with bearish implications and suggests that further deterioration in the ratio is just around the corner. If this is the case, higher crude oil’s prices should not surprise us in the coming weeks.
Having say that, let’s examine the relationship between gold and crude oil to check if it confirms or invalidates the conclusions of the above analysis of the oil-stocks-to-oil ratio.
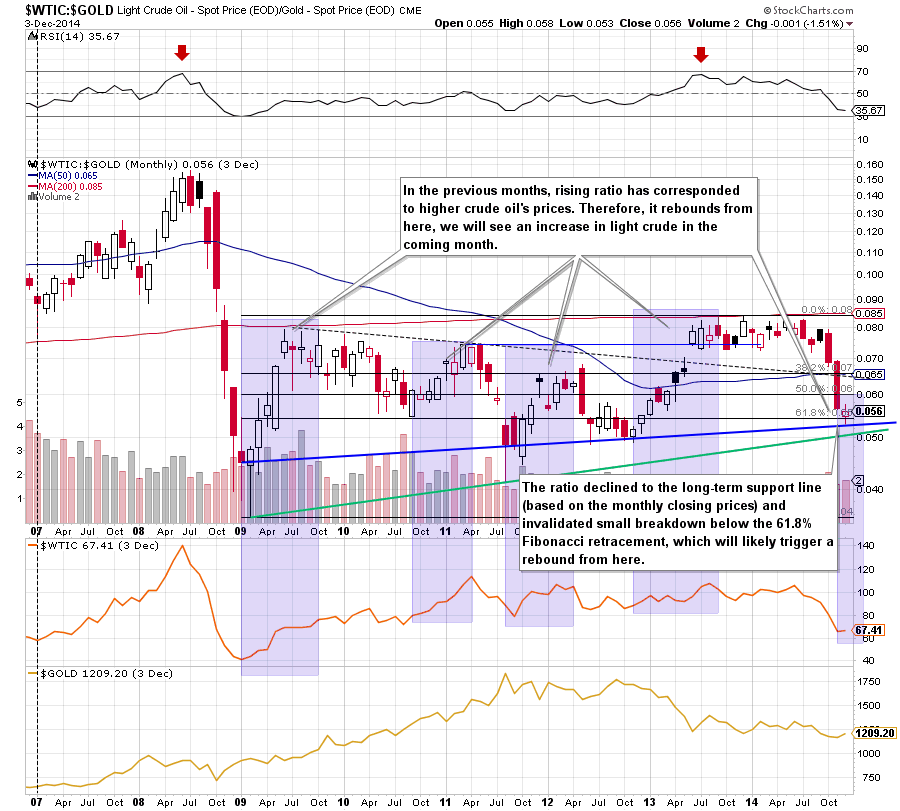
Looking at the long-term chart, we see that the ratio declined to the long-term support line based on the monthly closing values (marked with blue) and rebounded. With this upswing, the ratio invalidated a small breakdown below the 61.8% Fibonacci retracement, which is a bullish signal that suggests further improvement in the coming month. As you see on the above chart, in the previous years, rising ratio has corresponded to higher crude oil’s prices (we marked these periods of time with blue). Therefore, taking all the above facts into account, we think that we’ll see a similar price action in the coming weeks, which will translate to an upward move in the commodity.
What about gold? In the previous months both commodities have moved in the same direction (however, gold was much stronger that crude oil), which corresponded to declines in the ratio. If this positive correlation remains in place, we’ll likely see a rebound in both cases. Nevertheless, it’s worth noting that there were periods of time, when rising ratio has triggered downward moves in the case of gold (for example in 2011 and also in the previous year). Therefore, you should take a closer look at the current picture of this commodity (for example, by reading our daily Gold and Silver Trading Alerts) before making any investment decisions.
Can we infer something more from the reversal of this ratio? Let’s analyze the gold-to-oil ratio and find out.
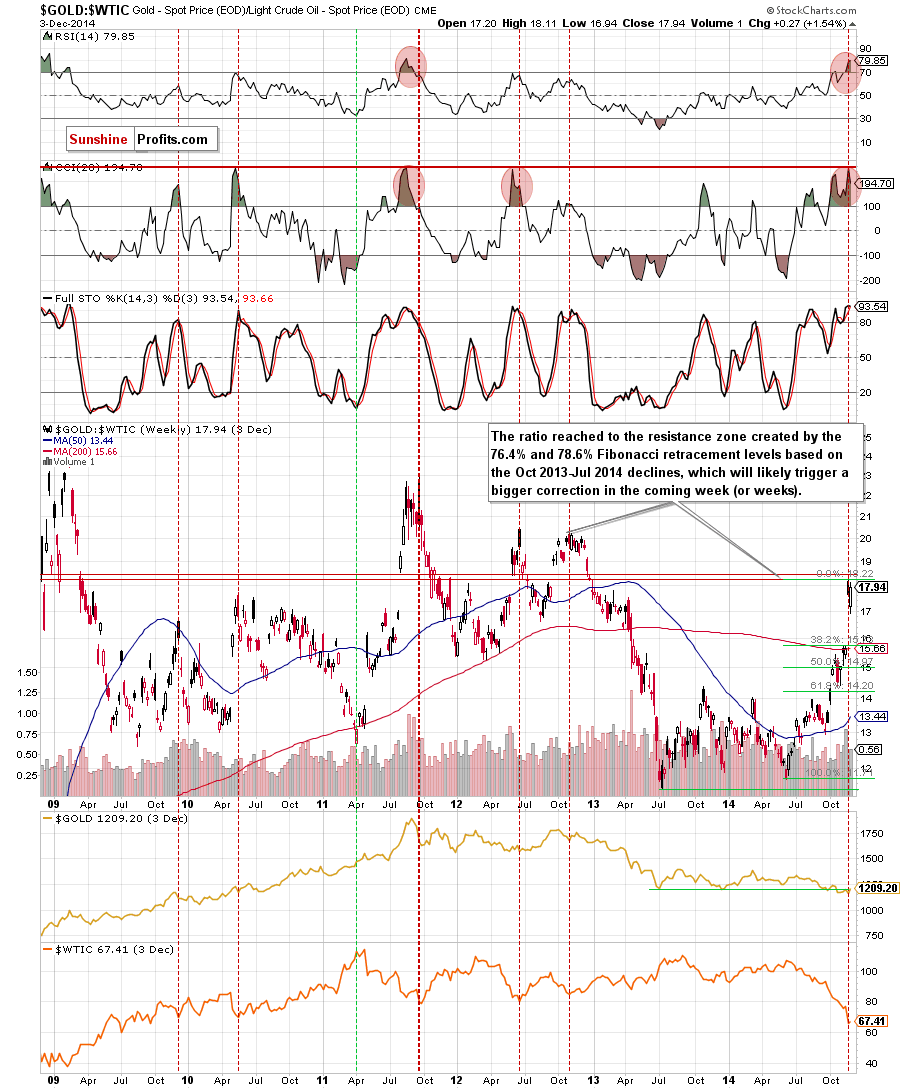
From this perspective, we see that the ratio reached the resistance zone created by the 76.4% and 78.6% Fibonacci retracement levels (based on the Oct 2013-Jul 2014 declines), which will likely stop further improvement and will trigger a bigger correction in the ratio in the coming week (or even weeks). As you see this scenario is currently reinforced by the position of the indicators: the RSI climbed to its highest level since 2011, while the CCI and Stochastic Oscillator are extremely overbought. In the previous years, similar (or even lower) readings of the indicators preceded tops in ratio and local bottoms in crude oil. Therefore, as we have pointed out before, it seems to us that the next move in the ratio will be to the downside, which will push crude oil higher.
Crude Oil - U.S. Dollar Link
Know the situation for the above ratios, let’s move on to the current situation in the USD Index as the U.S. dollar was one of the major forces, which affected the price of the commodity in recent weeks.
Quoting our last Oil Investment Update:
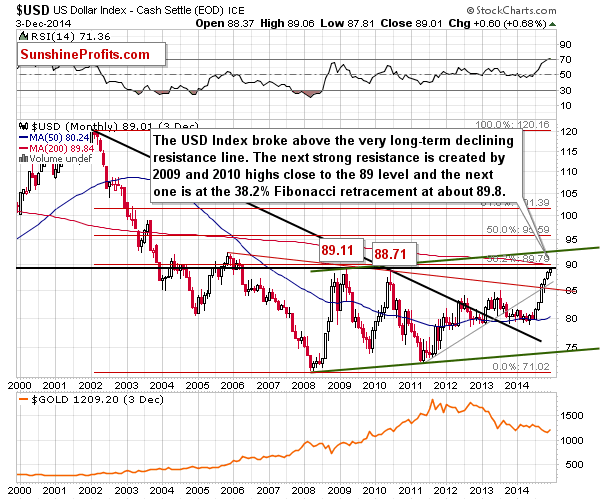
Looking at the above chart, we see that the USD Index moved higher in recent months, which resulted in a breakout above the long-term grey rising and red declining resistance lines. As you see, there is no strong resistance level until 88-89, which means that the USD Index has room for further gains. What does it mean for crude oil? Taking into account a negative correlation between the commodity and the U.S. currency that we noticed in recent weeks, it seems that light crude could move lower once again.
From today’s point of view, we see that although the negative correlation between the commodity and the U.S. currency resulted in a fresh multi-year low in crude oil, the USD Index reached the strong resistance area in the recent weeks. This means that if the index moves lower from here, we’ll see a rebound in crude oil as a weaker U.S. dollar makes the commodity less expensive for buyers in other currencies.
Scenarios
Just like a month ago, today’s Oil Investment Update includes scenarios of what could happen in the coming weeks. Naturally, we will continue to monitor the market in the coming days and if anything invalidates our long-term outlook we will send you an additional message.
- Bullish scenario
The solid support zone created by the Aug and Sep 2009 and the 61.8% Fibonacci retracement (based on the entire 2009-2011rally) will stop further deterioration, which will translate to higher crude oil’s prices. In this case, we’ll see a bigger corrective upward move from here to at least $77-$80, where the last week’s high and the psychological barrier are. - Bearish scenario
If the commodity extends losses and broke below the above-mentioned support zone, we could see a drop even to around $58.32-$60, where the Jul 2009 lows (in terms of intraday and weekly closing prices) are.
Summary
The overall situation in crude oil has deteriorated significantly as the commodity declined below the lower border of the declining trend channel (marked with red on the daily chart) and the 50% Fibonacci retracement (based on the entire 2009-2011 rally). Despite this deterioration, it seems to us that the solid support zone (created by the Aug and Sep 2009 lows and the 61.8% Fibonacci retracement based on the entire 2009-2011 rally) will at least pause further deterioration for longer. This scenario is currently supported by the current situation in the oil stocks-to-oil and the oil-to-gold ratios, which suggests that trend reversals in both cases is just around the corner, which should translate to higher oil prices – similarly to what we saw in the past. On top of that, the USD Index climbed to the strong resistance zone, which is another positive signal for crude oil. The last, but not least important factor, which suggests that the commodity could rebound in the near future is the positive correlation between light crude and oil stocks. As we have pointed out before, the recent downward move could be the last wave in the big multi-month correction, which means that the probability of a rebound in the XOI is even greater. Taking the above facts into account, we can assume that the bigger corrective upward move and a trend reversal is just around the corner.
Very short-term outlook: mixed with bullish bias
Short-term outlook: mixed
MT outlook: mixed
LT outlook: bullish
Trading position (our opinion): No positions are justified from the risk/reward perspective at the moment, however, if this week’s upward move won’t be followed by a fresh multi-year low and we’ll see a breakout above the 38.2% Fibonacci retracement (based on the recent downward move), we’ll consider opening long positions. Until this time, waiting on the sidelines for the confirmation that the final bottom is in is the best choice. We will keep you informed should anything change.
This completes this month’s Oil Investment Update. Our next Oil Investment Update is scheduled for Thursday, Jan 8, 2015. Oil Trading Alerts subscribers will additionally receive similar but shorter alerts on a daily basis (or more than once a day when the situation requires it). You – Oil Investment Updates subscribers – will receive short Investment Alert messages should the outlook for the medium or long term change before the next Update is posted.
Thank you.
Nadia Simmons
Forex & Oil Trading Strategist
Oil Investment Updates
Oil Trading Alerts

