

Without a doubt, Oct was the worst month for oil bulls since May 2012. In the previous month, the commodity lost over 11% as the combination of a stronger greenback, rising supplies and weaker demand weighted on the price. Additionally, the first days of the new month have been very negative for oil investors. After the breakdown below the psychologically important barrier of $80, oil bears pushed the price lower and light crude hit a four-year low of $75.84, breaking under long-term support lines. In this way, the commodity posted its sixth weekly loss in a row. At this point, some of you are probably wondering where the final bottom is. Before we try to answer this question, examining the world of charts, we would like to take a closer look at the fundamental factors that have influenced the price recently.
From today’s point of view, we can conclude that the combination of concerns over rising crude oil supplies, weakening global demand and a stronger greenback was the major driving force behind the recent moves in the commodity. These concerns have caused several investment banks to cut their oil price outlooks for the immediate future. For example, Goldman Sachs’ Brent forecast is now $85 a barrel (down from $100 a barrel previously) and its first-quarter forecast for the U.S. benchmark is $75 a barrel (down from $90). Additionally, in mid-Oct, the International Energy Agency in its monthly oil market report cut its forecast for 2014 oil-demand growth by 200,000 barrels a day from its September report to just 700,000 barrels a day. The IEA added also that the OPEC pumped more oil last month than it has in 13 months, while non-OPEC producers added 2.1 million barrels a day in the period, or more than 2% of global daily demand, which watered down the price of the commodity.
And speaking of OPEC… dark clouds gathered over crude oil as speculations that the cartel could not cut output at its next meeting in November to support prices (as it did in the past) have weighed on the price. Why market participants lost their faith in this solution? At the beginning of Oct, Saudi Arabia cut its November oil prices. The Kingdom lowered its selling price by $1 a barrel compared with the prior month for Arab Light crude being sold in Asia. Additionally, Saudi Arabia's oil company also lowered its prices for oil sold in Europe and the U.S. Later in the month, Iraq's State Oil Marketing Company cut the oil price of Basrah Light crude for Asian and European buyers by 65 cents to a discount of $2.50 a barrel below the Oman/Dubai benchmark for Asian customers and $4.75 below the Brent benchmark for European customers. In addition, Kuwait also cut official selling prices to Asian buyers in an effort to retain its market share, following similar moves from core OPEC members, which pushed the price lower as well. Although the price of light crude moved higher supported by news that Saudi Arabia cut crude oil production by about 328,000 barrels in September to a total of 9.36 million barrels a day, oil investors digested that the country's overall production grew from 9.597 million barrels a day in August to 9.7 million barrels a day last month, indicating that the market will remain amply supplied. As a result, crude oil slipped below $80 per barrel. Earlier this week, Saudi Arabia cut its prices for crude oil sold in December in the U.S., which resulted in a daily close below this psychologically important barrier from the first time since 2012. This move, in combination with news that the United Arab Emirates' state oil company had cut prices in all locations in October, sparked fears that that the Organization of the Petroleum Exporting Countries is unlikely to curtail production to reverse the market's slide. On top of that, the European Commission cut its forecast for euro zone economic growth to 0.8% this year from a 1.2% forecast made in the spring, while the 2015 growth forecast dipped to 1.1% from 1.7%. This decision, combined with soft U.S. data fueled worries that demand will remain soft while supply ample. In this environment, the price of light crude hit a four-year low of $75.84.
Will the market players be more likely to buy crude oil around $75 per barrel and will we see a rebound from here? Before we know the answer to this question, let‘s examine the technical picture of crude oil and find out what we can infer from charts (charts courtesy of http://stockcharts.com).
Crude Oil
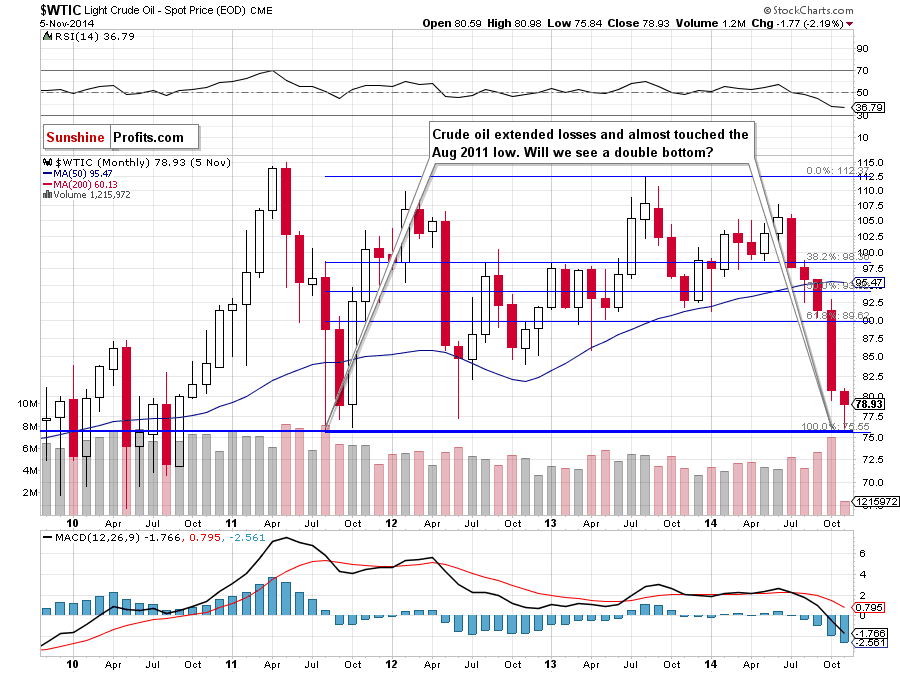
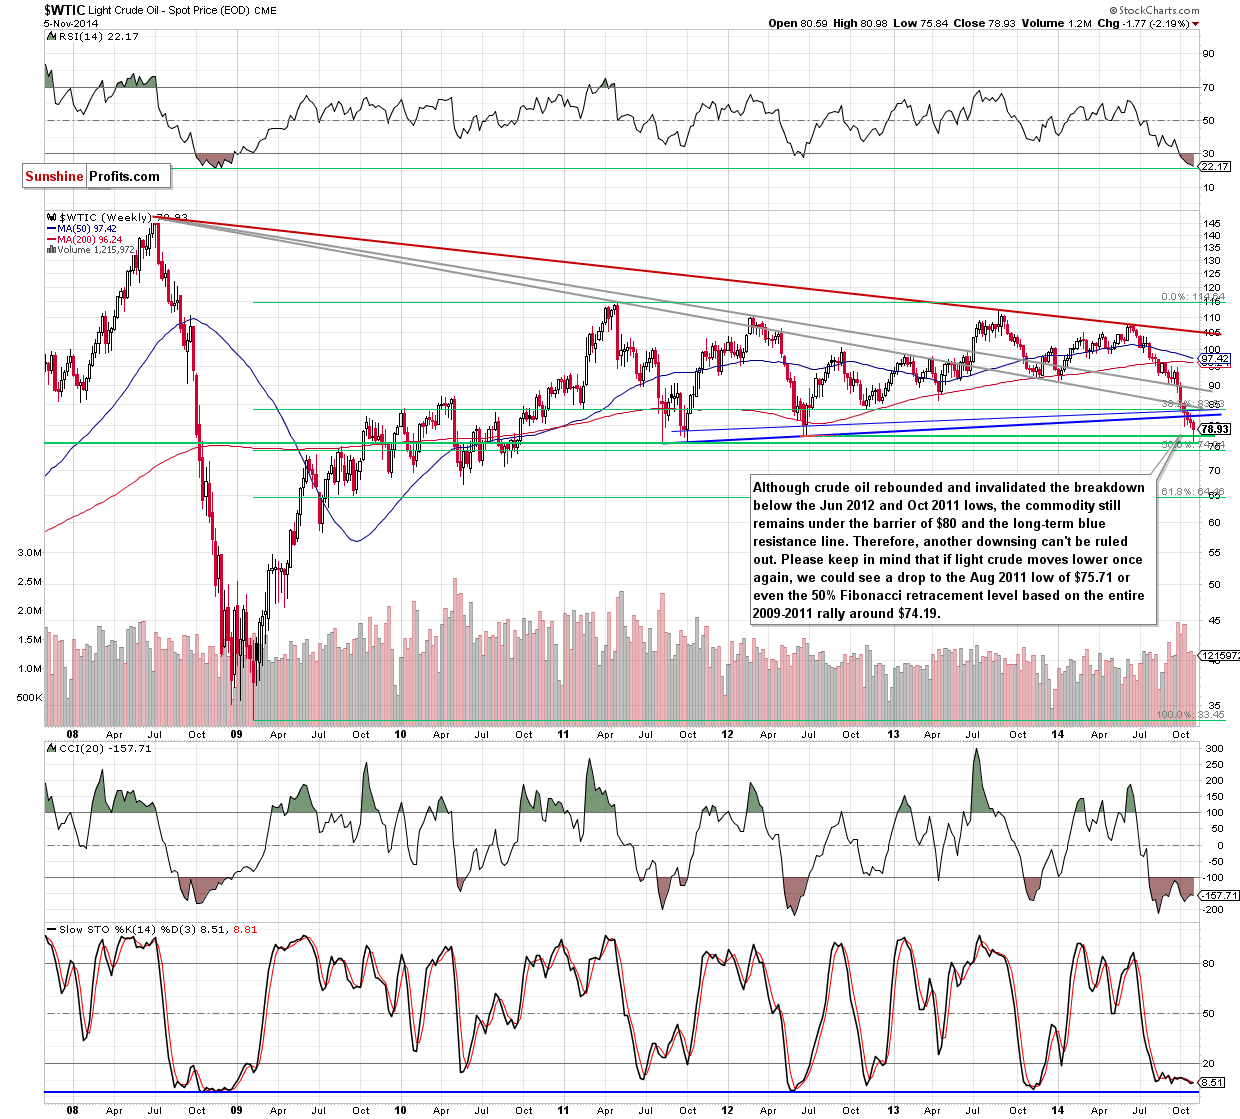
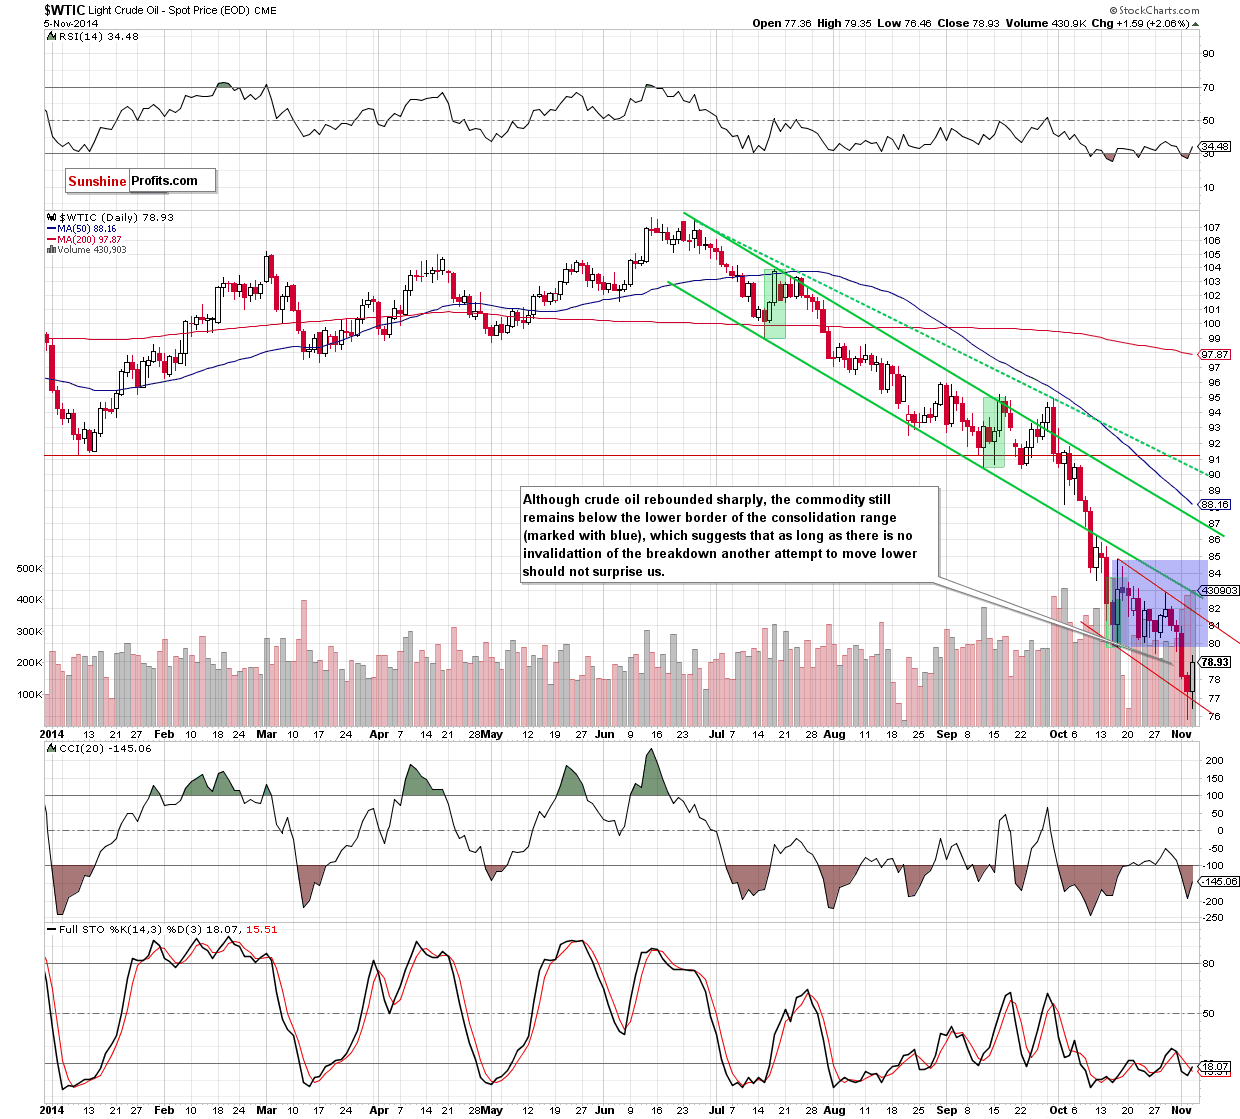
Looking at the above charts, we see that the situation in crude oil has deteriorated significantly since our last Oil Investment Update was posted. As you see on the long-term charts, a drop below the solid support zone created by the 61.8% Fibonacci retracement (based on the entire 20112013 rally), the long-term grey line and the Jan low triggered a sharp decline in the following weeks. With this downward move, the commodity reached the psychologically important barrier of $80 in the previous month. Although this key support level paused further deterioration for a while, oil bears didn’t give up and showed their claws at the beginning of the week, pushing the commodity lower. As a result, crude oil closed Monday’s session below $80 for the first time since the end of Jun 2012. On the following day, light crude hit a fresh multi-year low of $75.84, breaking below the Oct 2011 and Jun 2012 lows. Although crude oil invalidated the breakdown below these levels, the commodity still remains under the previous lows, the barrier of $80 and the long-term blue resistance line. Therefore, as long as there is no invalidation of the breakdown below these levels, another attempt to move lower should not surprise us. If this is the case, and light crude declines once again, we’ll see a test of the strength of Tuesday’s low in the coming days. What could happen if it doesn’t withstand the selling pressure? Taking into account the breakdown below the lower border of the consolidation (marked with blue on the daily chart), it seems that crude could drop even to around $75, where the size of the downward move will correspond to the height of the formation. At this point, it’s worth noting that below this level there is also the 50% Fibonacci retracement based on the entire 2009-2011 rally (at $74.19), which together create a solid support zone.
Summing up, although crude oil rebounded sharply yesterday, the commodity still remains below the solid resistance zone, which could trigger another downswing in the coming days. Nevertheless, taking into account the fact that the space for further declines seems limited, we think that a trend reversal is just around the corner.
Having discussed the situation in crude oil, let’s examine the NYSE Arca Oil Index (XOI) to find out what the current outlook for oil stocks is.
Oil Stocks
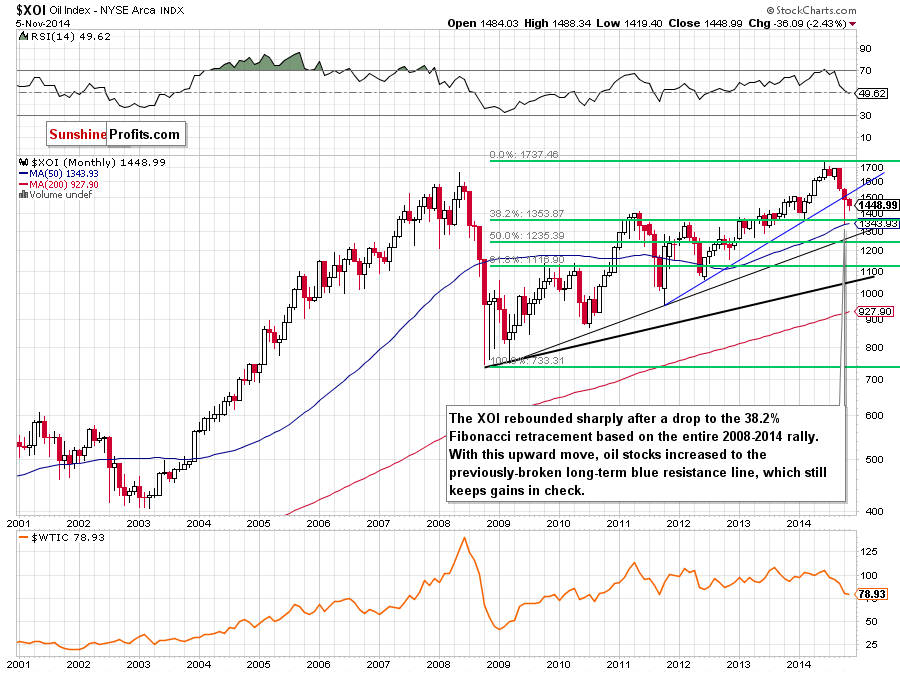
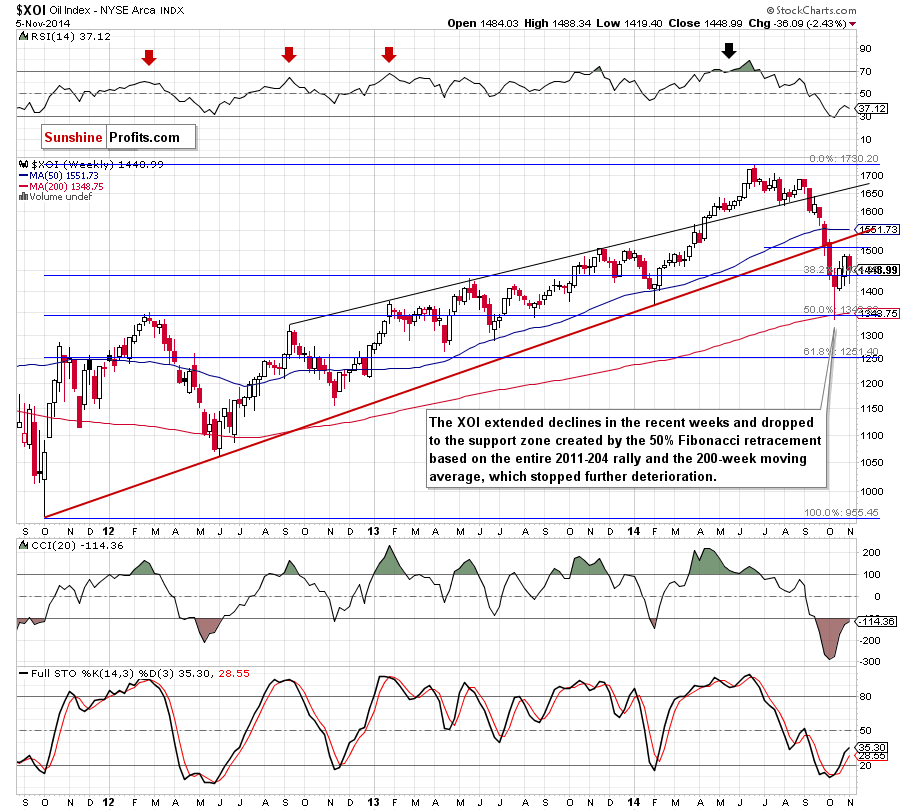
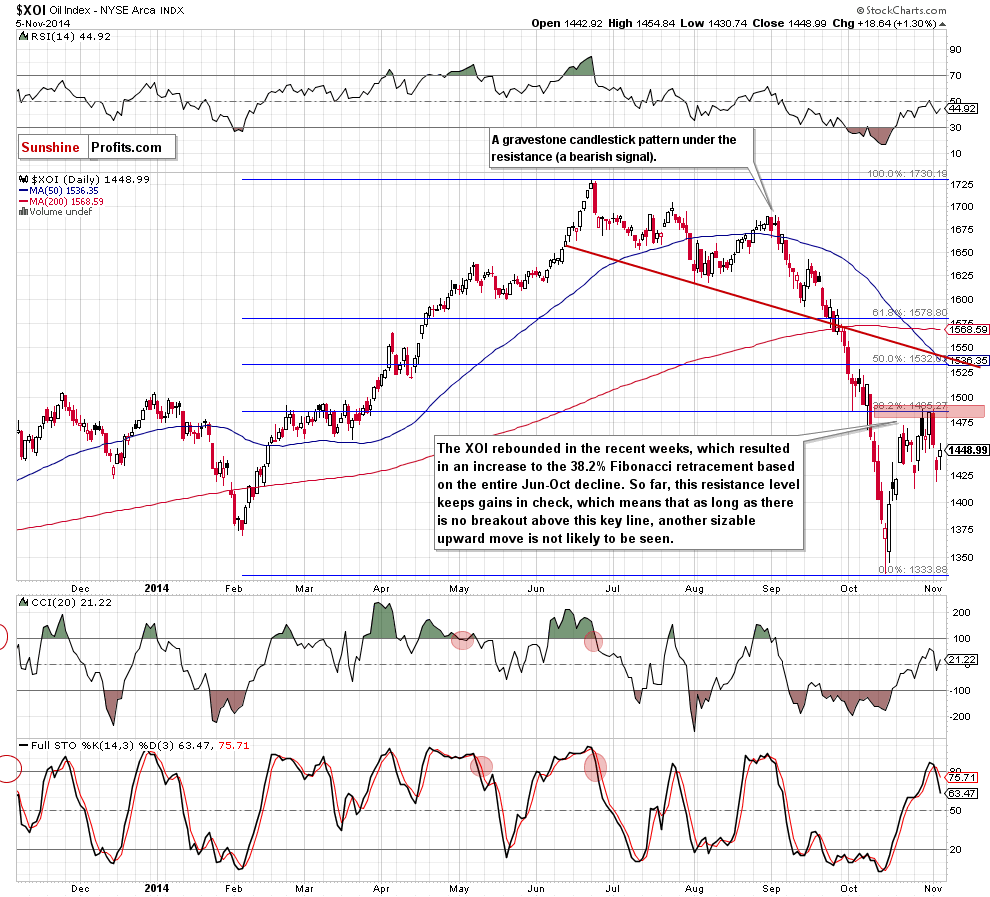
Looking at the above charts, we see that the breakdown below the long-term support line (based on the Oct 2011, Jun 2012 and Feb 2014 lows) triggered a sharp decline, which pushed oil stocks not only below the psychological barrier of 1.500, but also under 1.400. In this way, the index hit a multi-month low of 1.335 and dropped to the solid support zone. As you see, the combination of the 38.2% Fibonacci retracement based on the entire 2008-2014 rally (marked on the monthly chart), the 50% Fibonacci retracement based on the 2011-2014 increase and the 200-week moving average triggered a sharp rebound in the recent weeks. With this upward move the XOI climbed to the 38.2% Fibonacci retracement based on the Jun-Oct decline. At this point, it’s worth noting that the daily Stochastic Oscillator generated a sell signal, which could result in another pullback in the coming days. If this is the case, the initial downside target would be around 1.412, where the Oct 27 low is.
Summing up, although oil stocks moved lower in recent days, it seems to us that the next sizable move will be to the upside. In our opinion, the rally will accelerate after a breakout above the 38.2% Fibonacci retracement and the upside target would be around 1.530, where the previously-broken long-term blue resistance line, the 50% Fibonacci retracement and the 50-days moving average are.
Ratio Analysis
Today, we start this section by focusing on the oil stocks-to-oil ratio. What can we infer from the chart below?
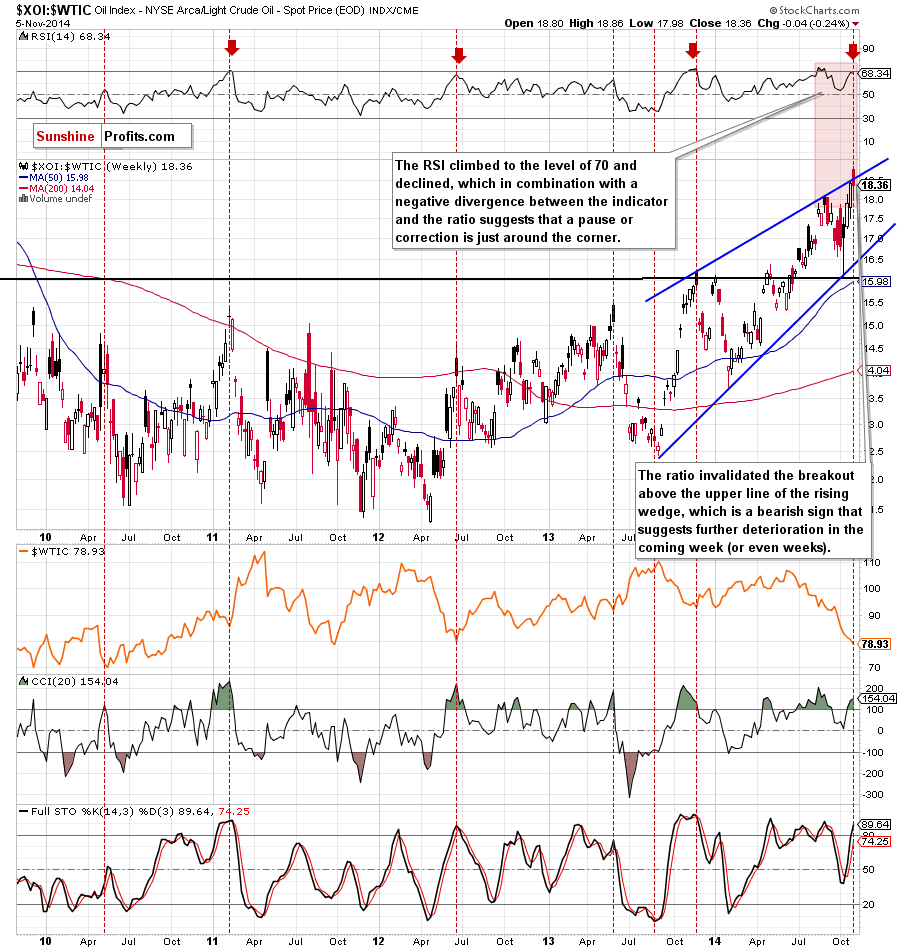
The first thing that catches the eye on the above chart is an invalidation of the breakdown above the upper line of the rising wedge. As you know, this is a strong bearish signal, which suggests further deterioration in the coming weeks. If this is the case, and we’ll see a corrective move from here, the initial downside target will be the lower border of the formation. What does it mean for crude oil? When you take a closer look at the above chart, you will see that may times in the past local tops in the ratio have corresponded to the crude oil’s lows. We saw such price actions in May 2010, Feb 2011, Jun 2012, May and Nov 2013. Additionally, the RSI climbed to the 70 level and declined – similarly to what we saw in the previous years. Back then, such a high reading on the RSI preceded a move down in the ratio and an upward move in crude oil. Taking these facts into account, and combining it with a negative divergence between the indicator and the ratio, we think that history will repeat itself once again and we’ll see a corrective upward move in crude oil in the near future. When we factor in the position of the CCI, we clearly see that the indicator is overbought (and there is also a negative divergence), which is another bearish signal for the ratio.
Having say that, let’s examine the relationship between the general stock market and crude oil to check if it confirms or invalidates the conclusions of the above analysis of the oil-stocks-to-oil ratio.
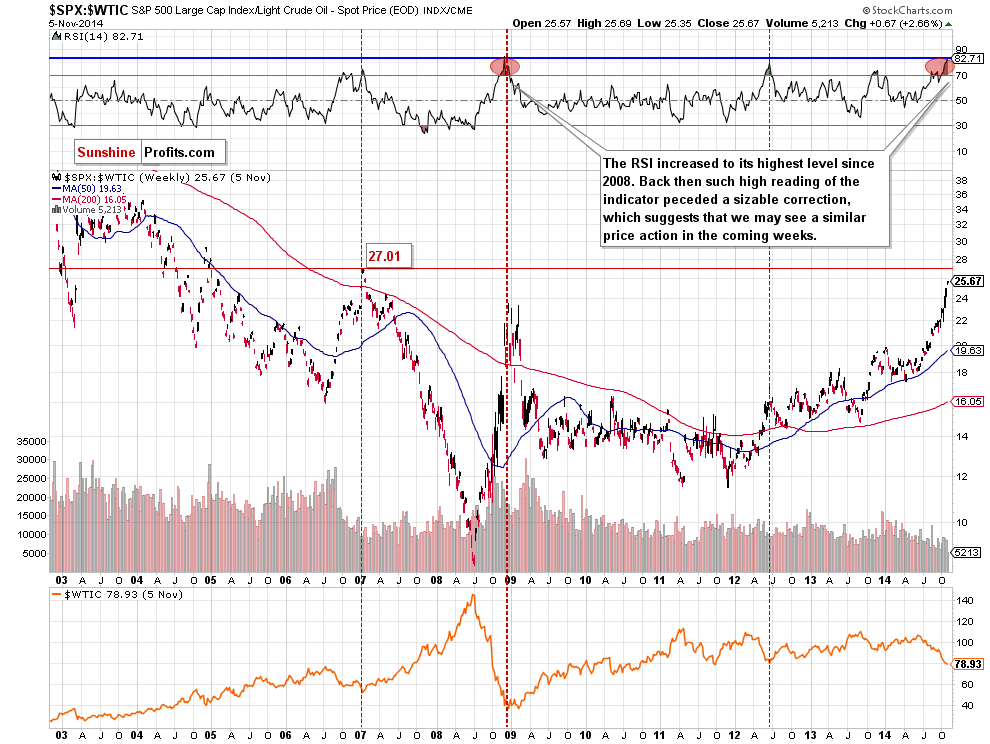
From this perspective, we see that similarly to what we saw in the case of the oil-stocks-to-oil ratio, there is a strong negative correlation between the ratio and the price of light crude. When we go back to 2007, we clearly see that the annual low in crude oil was preceded by the ratio’s 2007 high. We could see this strong relationship also in 2009, when the annual low in crude oil corresponded to the ratio’s 2009 high (marked with a red ellipse). We noticed similar price action also in Jun 2012 and Dec 2013. In all these cases, declines in the ratio triggered increases in light crude. As you see on the above chart, the space for further declines seems limited as the resistance level created by the 2007 high is close. Additionally, the RSI has reached its highest level since 2009. Back then, similar reading of the indicator triggered heavily declines in the ratio, which led to higher oil prices. Taking the above into account, we think that a trend reversal in the ratio is just around the corner and we will likely see improvement in crude oil.
Non-USD Crude Oil Price
Know the situation for the above ratios, let’s move on to the non-USD (WTIC:UDN ratio) chart of crude oil. As a reminder, UDN is the symbol for the PowerShares DB US Dollar Index Bearish Fund, which moves in the exact opposite direction to the USD Index. Since the USD Index is a weighted average of the dollar's exchange rates with world's most important currencies, the WTIC:UDN ratio displays the value of crude oil priced in "other currencies".
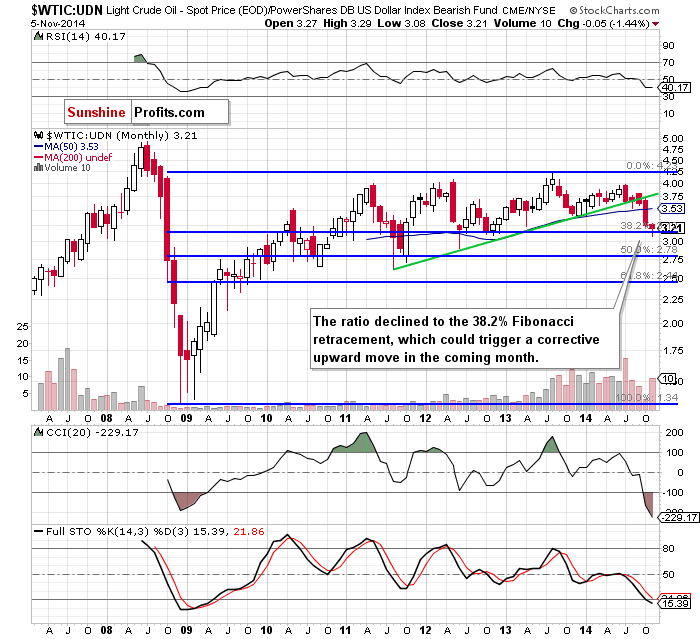
The above chart clearly shows that the recent declines took the ratio to slightly below the 38.2% Fibonacci retracement based on the entire 2008-2013 rally. As you see, this solid support stopped further deterioration (at least at the moment when these words are written) and triggered an upswing earlier this month, which invalidated the above-mentioned small breakdown. This is a positive signal (in our opinion, it would be even more bullish if the ratio closes the month above 3.15), which suggests that we could see a trend reversal in the coming month. If this is the case, we should also see a similar price action in the commodity.
Crude Oil - U.S. Dollar Link
Finishing today’s Oil Investment Update, we decided to comment the current situation in the USD Index as the U.S. dollar was one of the major forces, which affected the price of the commodity in recent weeks.
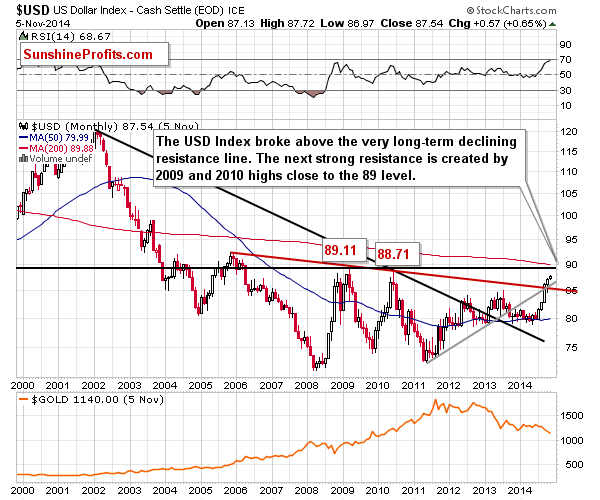
Looking at the above chart, we see that the USD Index moved higher in recent months, which resulted in a breakout above the long-term grey rising and red declining resistance lines. As you see, there is no strong resistance level until 88-89, which means that the USD Index has room for further gains. What does it mean for crude oil? Taking into account a negative correlation between the commodity and the U.S. currency that we noticed in recent weeks, it seems that light crude could move lower once again. Nevertheless, we should keep in mind that there were periods of time when crude oil managed to rally even though the USD Index didn’t decline. Therefore, even if the USD Index moves higher, crude oil could show strength – similarly to what we saw in May, the first part of Jun and also in Sep.
Will we see such price action in the near future? To have a more complete picture of the situation, we decided to take a closer look at the ratio between crude oil and the USD Index.
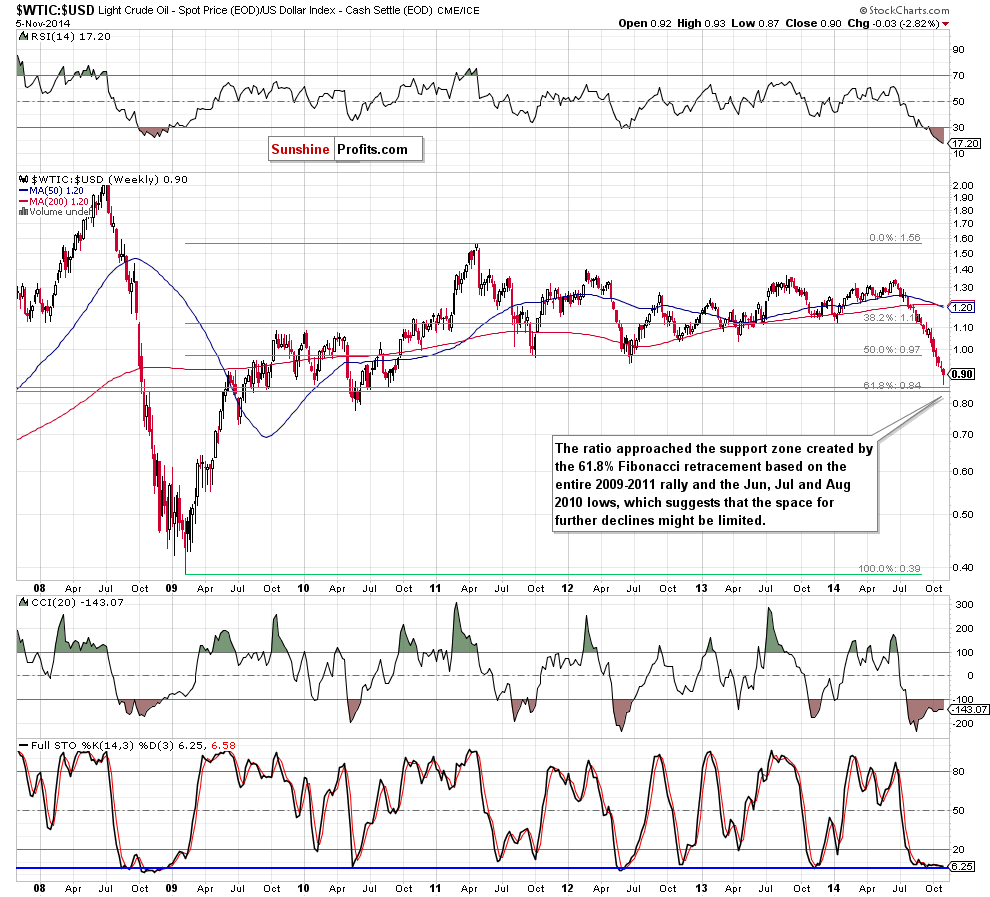
Looking at the above chart, we see that the ratio extended losses (which corresponded to lower prices of crude oil) and broke below Jun 2012 low. In our opinion, even if the ratio moved lower from here, the space for further declines seems limited as the support zone created by the 61.8% Fibonacci retracement based on the entire 2009-2011 rally and the Jun, Jul and Aug 2010 lows is quite close. In other words, if this area withstands the selling pressure and the ratio rebounds in the coming week, we’ll likely see a similar price acion in crude oil.
Scenarios
Just like a month ago, today’s Oil Investment Update includes scenarios of what could happen in the coming weeks. Naturally, we will continue to monitor the market in the coming days and if anything invalidates our long-term outlook we will send you an additional message.
- Bullish scenario
Even if crude oil moves little lower from the current levels, it seems that the support zone created by the Aug 2011 low and the 50% Fibonacci retracement based on the entire 2009-2011 rally (at $74.19) will stop further deterioration. If this is the case, we’ll see a bigger corrective upward move from there (to at least $85) and an invalidation of the breakdown below the barrier of $80 and the long-term resistance lines in the coming weeks. - Bearish scenario
If the commodity extends losses and broke below the above-mentioned support zone, we could see a drop even to $70-$70.76, where the next psychological barrier and the Aug 2010 low are.
Summary
The overall situation in crude oil has deteriorated significantly as the commodity declined below the long-term support lines and the psychologically important barrier of $80. Despite this deterioration, the space for further declines seems limited as the solid support zone (created by the Aug 2011 low and the 50% Fibonacci retracement based on the entire 2009-2011 rally) is quite close. Additionally, the current situation in the oil stocks-to-oil and stocks-to-oil ratios suggests that trend reversals in both cases is just around the corner, which should translate to higher oil prices – similarly to what we saw in the past. On top of that, the WTIC:UDN invalidated small breakdown below the 38.2% Fibonacci retracement based on the entire 2008-2013 rally, which is another positive signal for crude oil. The last, but not least important factor, which suggests that the commodity could rebound in the near future is limited space for further declines seen on the oil-to-dollar ratio chart. Taking the above facts into account, we can assume that the final bottom of the current correction is just around the corner.
Very short-term outlook: bearish
Short-term outlook: mixed with bearish bias
MT outlook: mixed
LT outlook: bullish
Trading position (our opinion): In our opinion, long positions with a buy limit order at $75.82 and a stop-loss at $73.47 are justified from the risk/reward perspective.
This completes this month’s Oil Investment Update. Our next Oil Investment Update is scheduled for Thursday, Dec 4, 2014. Oil Trading Alerts subscribers will additionally receive similar but shorter alerts on a daily basis (or more than once a day when the situation requires it). You – Oil Investment Updates subscribers – will receive short Investment Alert messages should the outlook for the medium or long term change before the next Update is posted.
Thank you.
Nadia Simmons
Forex & Oil Trading Strategist
Oil Investment Updates
Oil Trading Alerts

