

- Crude Oil
- Oil Stocks
- Crude Oil - Oil Stocks Link
- Ratio Analysis
- Non-USD Crude Oil Price
- Scenarios
- Summary
Without a doubt, July was the worst month for crude oil since the beginning of the year. It spent months climbing slowly from the January low of $91.24 to the 2014 high of $107.68 and then the commodity gave up over 60% of earlier gains in just seven weeks. The latest round of selling triggered a sharp decline below the long- and medium-term support lines, the 200-day moving average and the psychological barrier of $100, which turned the medium- and the short-term outlook to bearish. In the recent days, crude oil reached a very important support zone created by the March low and the 61.8% Fibonacci retracement and you’re probably wondering where the commodity will head next: north or south?
In the previous months, the major driving force behind crude oil’s gains have been geopolitical concerns over the situation in Iraq, Libya and Ukraine, which could disrupt production. Nevertheless, it seems that investors shifted their attention from concerns about ongoing violence in these countries to worries about swelling crude oil supplies, which resulted in a drop to a fresh six-month low of $97. Although supplies typically drop at this time of year as refineries run at high rates before entering seasonal maintenance in the fall, the busy summer-driving season is coming to an end on Labor Day, and product markets are already well-supplied. Therefore, it seems that oil investors are less concerned about a large supply interruption. Does it mean that the commodity will extend declines in the coming weeks? Before we try to answer this question, let’s jump to the world of charts and check what the current technical situation in the oil market is.
Crude Oil
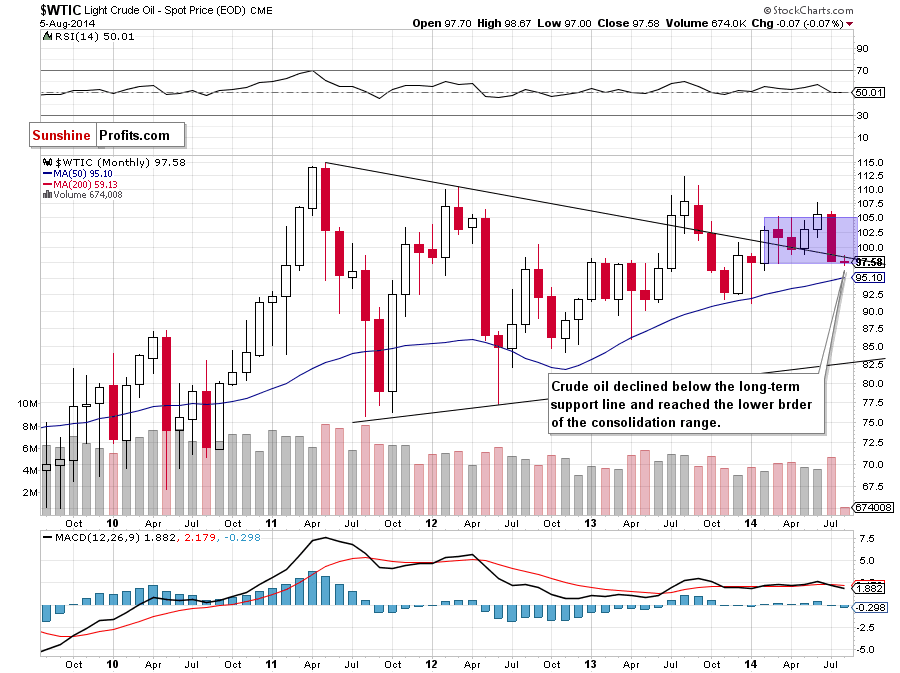
Let’s start this month‘s Oil Investment Update’s technical part with a closer look at the monthly chart of light crude (charts courtesy by http://stockcharts.com).
In our previous Oil Investment Update, we wrote the following:
(..) the commodity reversed, invalidating earlier breakout. (…) this strong bearish signal triggered further deterioration (…) and, from this perspective, it looks that light crude will find the next support around $101.60, where the May low is.
Looking at the monthly chart, we see that crude oil reached the above-mentioned support level, but as it turned out it didn’t withstand the selling pressure and the commodity declined under the long-term declining support line. With this downward move light crude also slipped below the lower border of the consolidation created by the March low. So far, this breakdown is barely visible from this perspective, but such drop may trigger further deterioration – especially if oil bulls do not invalidate the breakdown below the long-term support/resistance line. If this is the case, crude oil will test the strength of the 50-month moving average (currently at $95.10). As you see on the above chart, several times in the past (for example in Apr 2013 or Jan 2014) this moving average stopped further declines, therefore, if history repeats itself, we may see similar price action in the coming month (or months). Nevertheless, if oil bulls manage to push the price above the key resistance line in the coming weeks, the commodity will rebound and erase at least 38.2% of the entire recent decline, which may translate to an increase to around $101.
Will the medium-term picture give us more clues where the commodity head next? Let’s zoom in on our picture and find out.
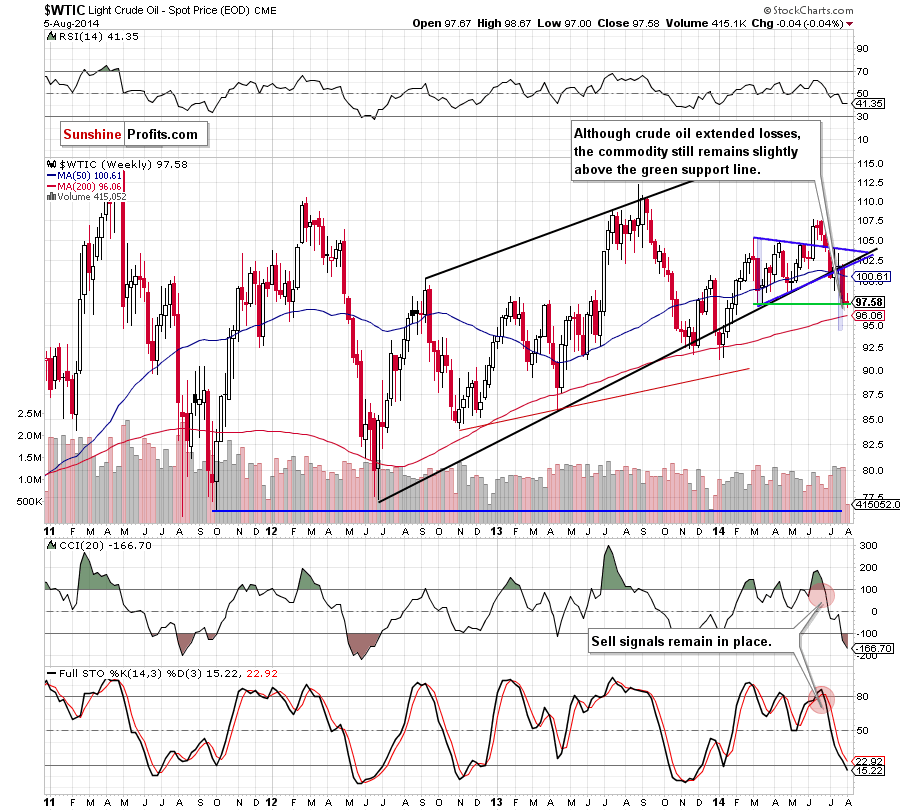
From this perspective, we see that crude oil re-tested the strength of the support level (marked with green) based on the March low. As you see, although there was another drop below it, the commodity moved up and still remains above the green support line. What’s next? If this support level holds, we’ll see a rebound from here in the coming week and the initial upside target will be around $98.74, where the April low is. If it’s broken, the next resistance would be the June low (at $99) or even the previously-broken psychological barrier of $100. Nevertheless, we should keep in mind that sell signals remain in place (despite the fact that the CCI and Stochastic Oscillator are oversold), which suggests that even if we’ll see a short-term improvement, the commodity will likely test the strength of the 200-week moving average (currently at $96.06) – similarly to what we saw several times in the past (for example in April, November 2013 and also at the beginning of the year).
Now, let’s check the short-term outlook.
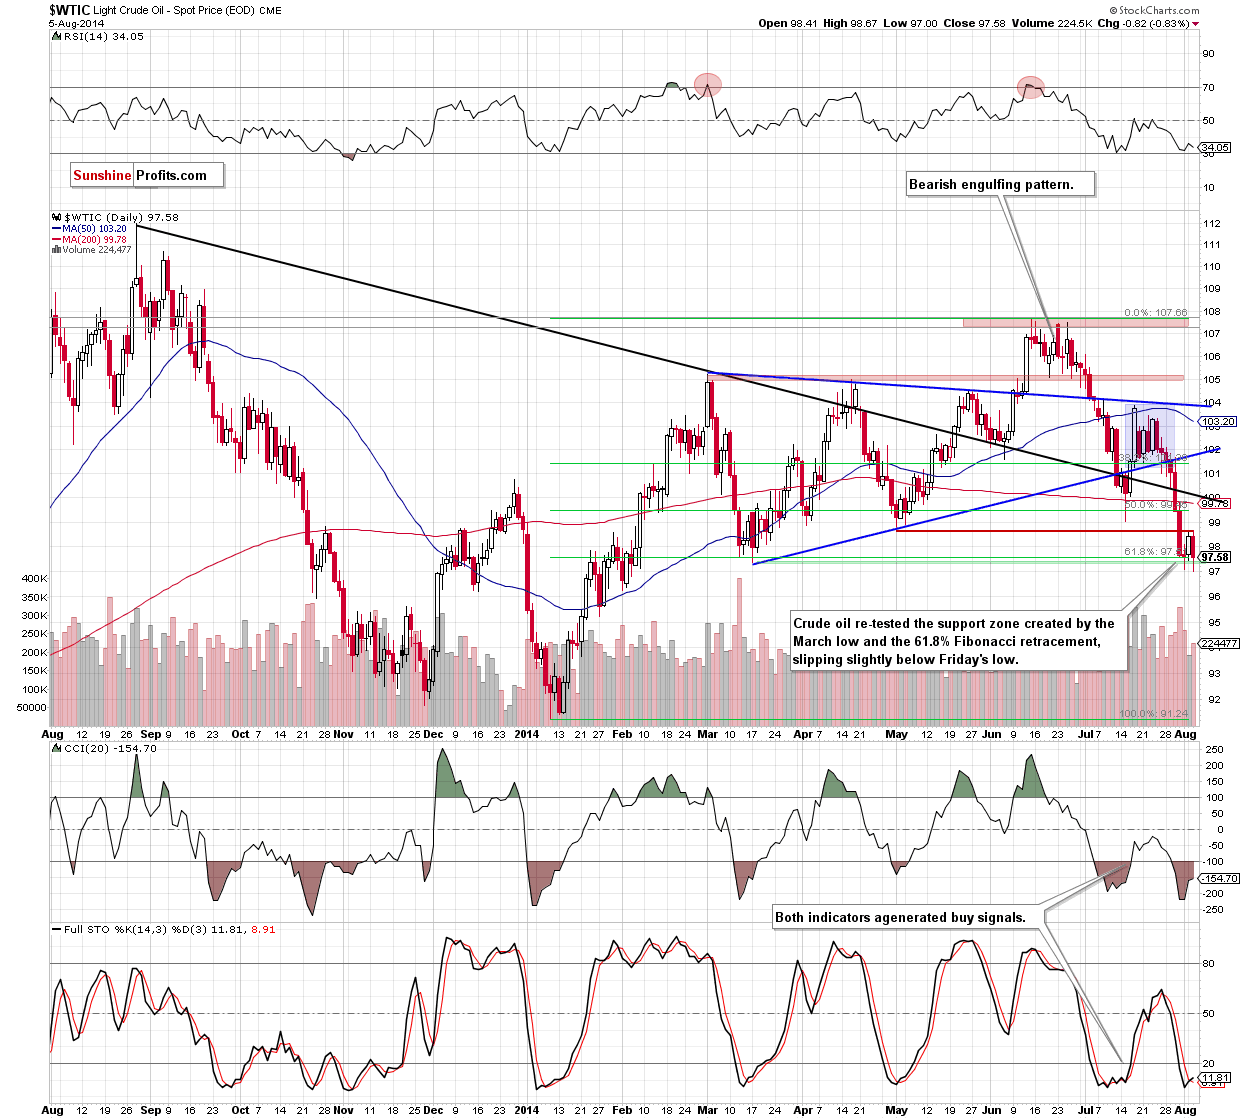
Looking at the daily chart, we see that the situation has deteriorated significantly as crude oil declined (and confirmed the breakdown) not only below the lower border of the medium-term triangle (marked with blue), but also under the long-term black support line, the 200-day moving average and the psychological barrier of $100. With this downward move the commodity reached the March low and the 61.8% Fibonacci retracement based on the entire Jan-June rally. On Monday, this support area encourages oil bulls to push the buy button and we saw a corrective upswing to the nearest resistance. As it turned out, it was strong enough to trigger another downswing, which took the commodity to a fresh six-month low of $97. In our opinion, Monday’s move looks as a verification of the breakdown below the May low, which is a bearish signal that could trigger further declines – especially if light crude closes the next day below the green support zone marked on the daily chart. In this case, the current downward move will deepen and we may see a drop even to around $94.76-$95.21, where the strong support zone (created by the 76.4% and 78.6% Fibonacci retracements based on the entire 2014 rally and the Jan. 27 bottom) is. Nevertheless, we should keep in mind that the CCI and Stochastic Oscillator are oversold (while the RSI still remains above the level of 30 – despite yesterday’s drop) and there are positive divergences between them and the price, which suggests that a pause or corrective upswing are just around the corner.
Summing up, the situation from the long-, medium- and short-term perspective has deteriorated as crude oil declined (and confirmed the breakdown) not only below the lower border of the medium-term triangle (marked with blue), but also under the long-term black support line, the 200-day moving average and the psychological barrier of $100. As we have pointed out before, with this downward move light crude also dropped below the long-term support line and the lower border of the consolidation marked on the monthly chart, reaching a very important support zone created by the March low and the 61.8% Fibonacci retracement based on the entire Jan-June rally. If this area holds, we’ll see a corrective upswing from here to at least $101, where the 38.2% Fibonacci retracement based on the entire recent decline is. On the other hand, if oil bears manage to push the commodity below the key support zone, we’ll likely see a test of the strength of the 200-week moving average (currently at $96.06) or even a drop to around $94.76-$95.21, where the strong support zone (created by the 76.4% and 78.6% Fibonacci retracements based on the entire 2014 rally and the Jan. 27 bottom and supported by the 50-month moving average) is.
Having discussed the situation in crude oil, let’s examine the NYSE Arca Oil Index (XOI) to find out what the current outlook for oil stocks is.
Oil Stocks
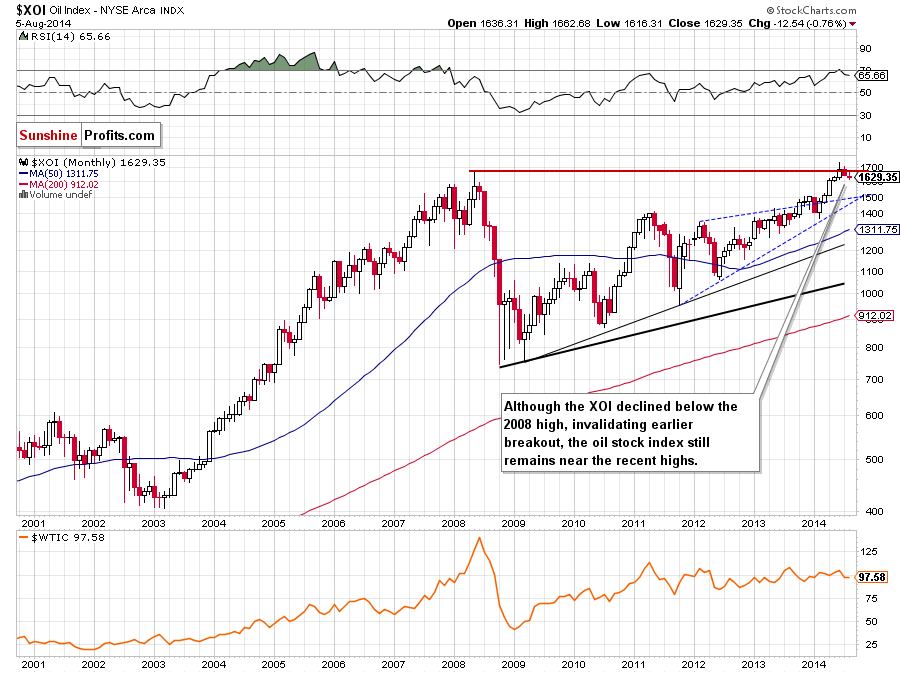
Let’s begin with the long-term chart.
In our last Oil Investment Update, we wrote the following:
(…) we should keep in mind that the RSI is still overbought, which suggests that a pause or a correction (if the indicator generates a sell signal) in the coming month should not surprise us.
As you see on the monthly chart, the situation developed in line with the above-mentioned scenario as the RSI generated a sell signal. This bearish event triggered a downward move, which took the XOI below the 2008 high. Although an invalidation of the breakout is a strong bearish sign (which usually translates to further deterioration), we should keep in mind that the current correction is still shallow and the oil stock index remains quite near the recent highs. Therefore, we think that it’s worth focus on the medium-term changes and look for more clues about future moves on the weekly chart. So, let’s zoom in on our picture and move on to it.
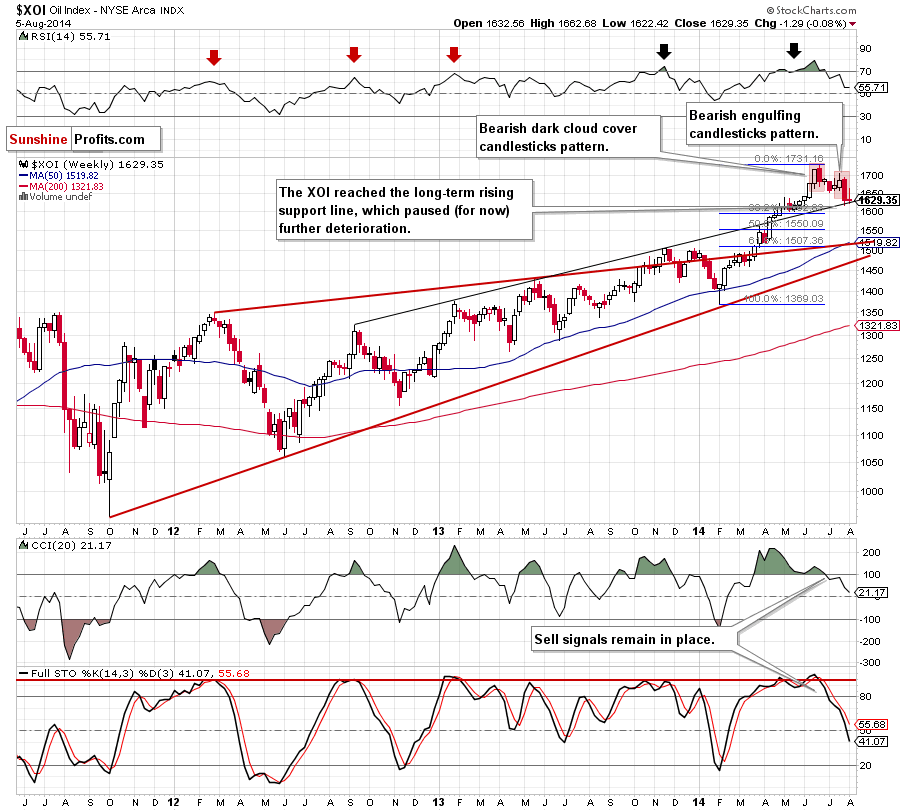
The XOI declined sharply and reached the long-term support/resistance line (marked with black) in the previous week. Because of this downswing, recent candlesticks formed a bearish engulfing pattern, which serves as the nearest medium-term resistance at the moment (around 1,695-1,704). At this point, it’s worth noting that above this area is also another bearish candlesticks formation – a dark cloud cover, which reinforces the resistance level created by the 2014 high. What’s next? If the long-term support/resistance line withstand the selling pressure, we’ll see a corrective upswing from here and an attempt to break above the nearest resistance. However, if it is broken, we’ll see further deterioration and a test of the strength of the psychological barrier of 1,600 in the coming weeks. Please note that this area is reinforced by the 38.2% Fibonacci retracement based on the entire Feb-June rally, which may pause declines. Nevertheless, if it’s broken the next support will be 50% Fibonacci retracement at 1,550.
Having discussed the medium-term outlook, let’s turn to the daily chart.
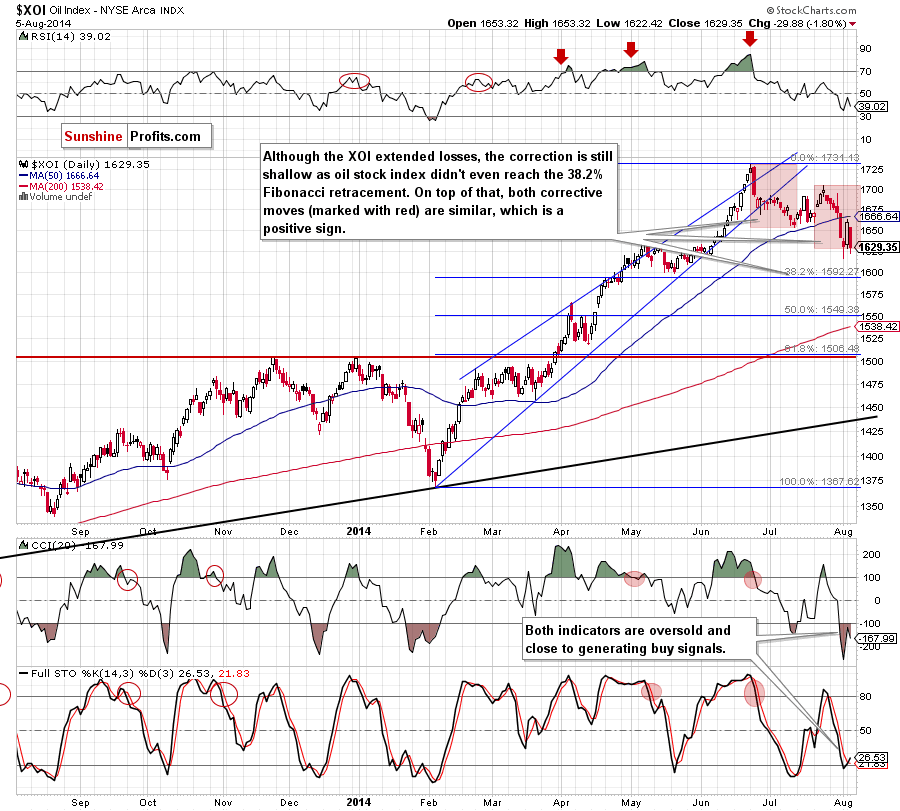
From this perspective, we see that the XOI accelerated declines after a drop below the 50-day moving average, which resulted in a drop to the lowest level since early June. As you see on the above chart, although the oil index rebounded sharply at the beginning of the week, this improvement was only temporarily and the XOI erased all gains yesterday, which suggest that Monday’s upswing was a verification of the breakdown below the 50-day moving average. If this is the case, it will be a bearish signal that could trigger further deterioration and a drop to the 38.2% Fibonacci retracement based on the entire Feb-June rally. Please not that this area is reinforced by the bottom of the correction that we saw in May and the psychological barrier of 1,600, which is slightly above this level. Before we summarize the current situation in the oil stock index we would like to draw your attention to the position of the indicators. As you can see the CCI and Stochastic Oscillator are oversold (additionally the latter generated a buy signal), which suggests that a pause or corrective upswing are just around the corner.
Summing up, the long-term outlook for oil stocks has deteriorated as the XOI invalidated the breakout above the 2008 high, which triggered a correction to the long-term black support line. As we have pointed out before, if it holds the selling pressure, we’ll see a corrective upswing from here and (at least) an attempt to come back above the 50-day moving average. This short-term improvement is currently reinforced by a depth of the correction (which is still very shallow) and the position of the indicators, which suggests that a pause or corrective upswing are just around the corner.
Crude Oil - Oil Stocks Link
Having discussed the current situation in crude oil and the oil stock index, let’s comment on the relationship between them.
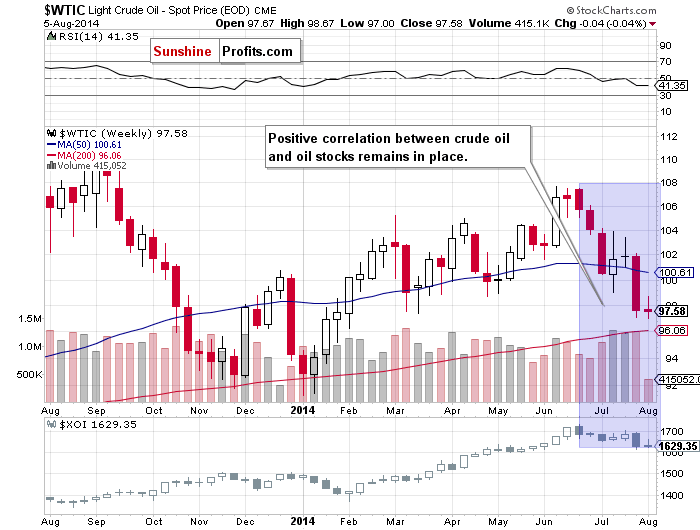
When we take a look at the weekly chart and compare the price action in both cases, we see that crude oil and oil stocks still moves in the same direction. As you already know from the analysis discussed above, the oil stocks didn’t even correct 38.2% of the entire rally that we saw since February, while crude oil tested the strength of the 61.8% Fibonacci retracement based on this year’s increase, which clearly shows that the XOI is stronger than WTIC and it seems better upside potential.
Ratio Analysis
Today, we start this section by focusing on the oil-stocks-to-oil ratio. What impact could it have on future oil moves? Let’s check.
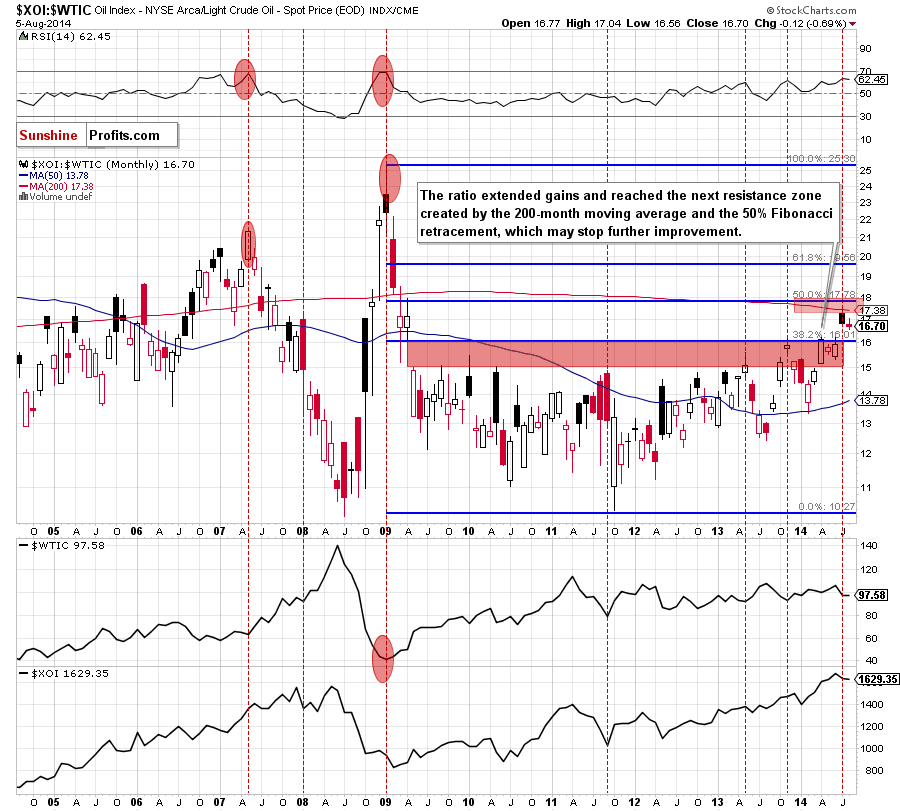
From this perspective, we see that the ratio succesfully broke above the 38.2% Fibonacci retracement, closing the gap that we saw in 2009. This strong bullish signal triggered further improvement and the ratio extended gains in the previous month. With this upswing, the ratio reached the resistance zone created by the 200-month moving average and the 50% Fibonacci retracement. As you see on the above chart, this strong resistance paused further improvement, which means that if the local top is already in, we may see a correction from here to the previous highs. What does it mean for crude oil? Many times in the past, the local top in the ratio have corresponded to the local botom in the commodity. We saw such situation in Jan. 2009, Sept. 2011, May 2013 and Nov. 2013. Therefore, we believe that if history repeats itself once again, we may see a similar situation in the coming month.
Will the medium-term picture give us more clues? Let’s check.
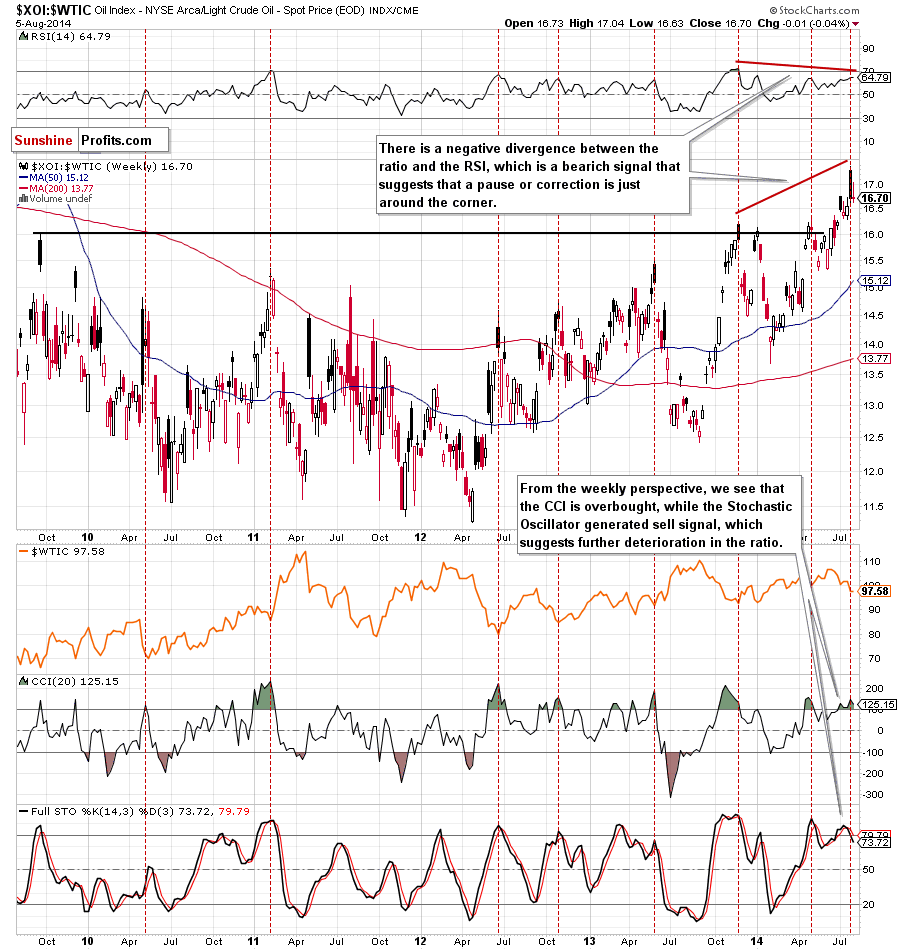
The first thing that catches the eye on the above chart is a strong negative divergence between the RSI and the ratio. When we take a closer look at the chart, we notice that there was a similar situation between the June 2012 and May 2013 highs. Back then, such strong negative divergence preceded a sharp decline in the ratio, which translate to higher values of crude oil. Therefore, as we mentioned earlier, if history repeats itself once again, we may see a bottom of the correction in crude oil in the near future. Please note that the current position of the CCI and Stochastic Oscillator (they are both overbought and the latter generated a sell signal) also reinforced the above-mentioned bearish scenario for the ratio and bullish for crude oil.
Once we know the above, let’s look for further clues about future crude oil moves on the charts below. At the beginning, let’s examine the stocks-to-oil ratio.
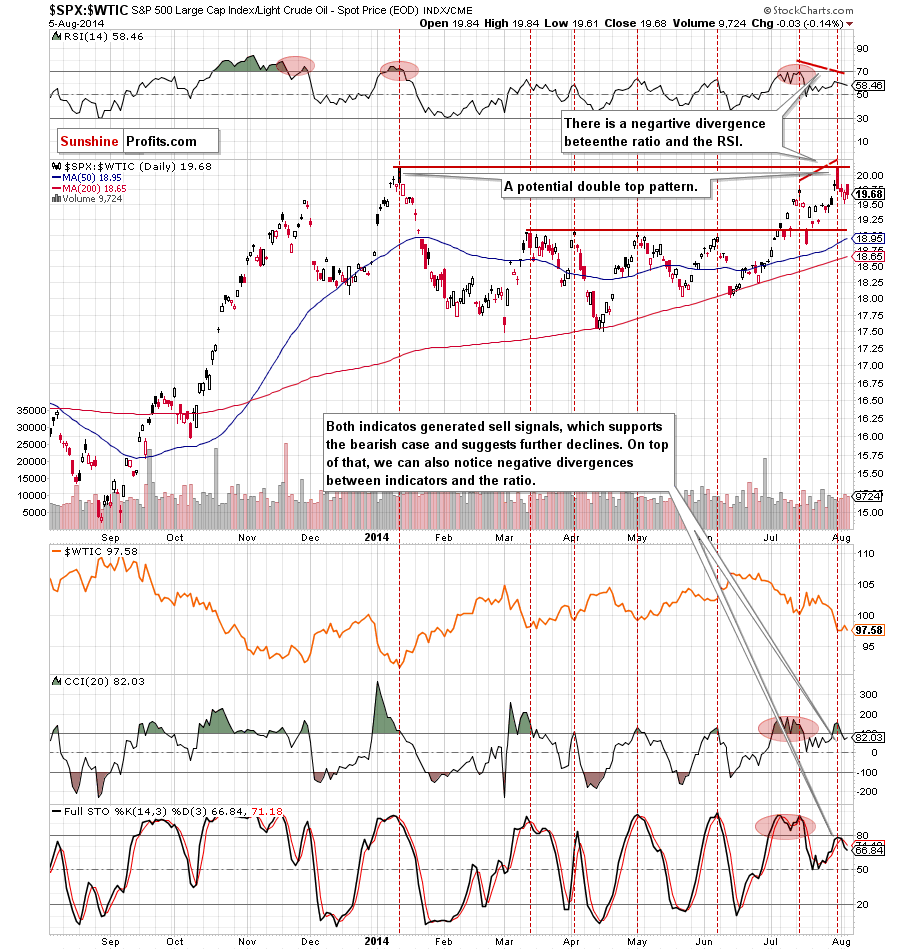
As you see on the above charts, the ratio reached the next resistance level based on the Jan. high and declined slightly in the recent days. When we take a closer look at the daily chart, we see that every high in the ratio corresponded to the bottom of the correction in crude oil. Therefore, if history repeat itself once again and the ratio reverses, we’ll likely see another move lower in the ratio and rebound in the commodity. Nevertheless, if the ratio breaks above the resistance zone, it will be a strong bullish signal that will trigger further improvement in the ratio and further deterioration in light crude. Therefore, in our opinion it’s worth to keep an eye on the above chart in the coming days, because we’ll likely receive a valuable clue where the commodity head next.
Non-USD Crude Oil Price
Once we know the above, let’s take a look at the non-USD (WTIC:UDN ratio) chart of crude oil. As a reminder, UDN is the symbol for the PowerShares DB US Dollar Index Bearish Fund, which moves in the exact opposite direction to the USD Index. Since the USD Index is a weighted average of the dollar's exchange rates with world's most important currencies, the WTIC:UDN ratio displays the value of crude oil priced in "other currencies".
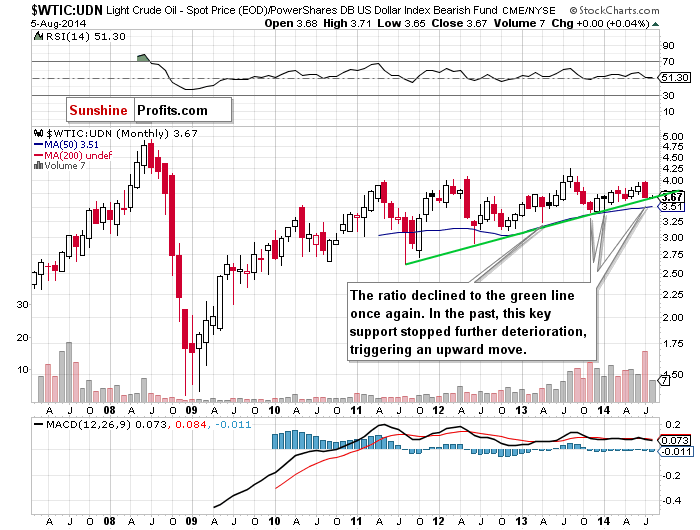
From the monthly perspective, we see that the ratio reached the key support line once again. As you see on the above chart, many times in the past this green line stopped further declines, triggering an upward move. We saw such price action in June 2012, April, November and December 2013 and also at the beginning of the year. Therefore, if history repeats itself once again (which is more likely than not) we’ll see a rebound from here in the coming month, which will also correspond to higher values of crude oil priced in U.S. dollars.
Can we infer something more from the weekly chart?
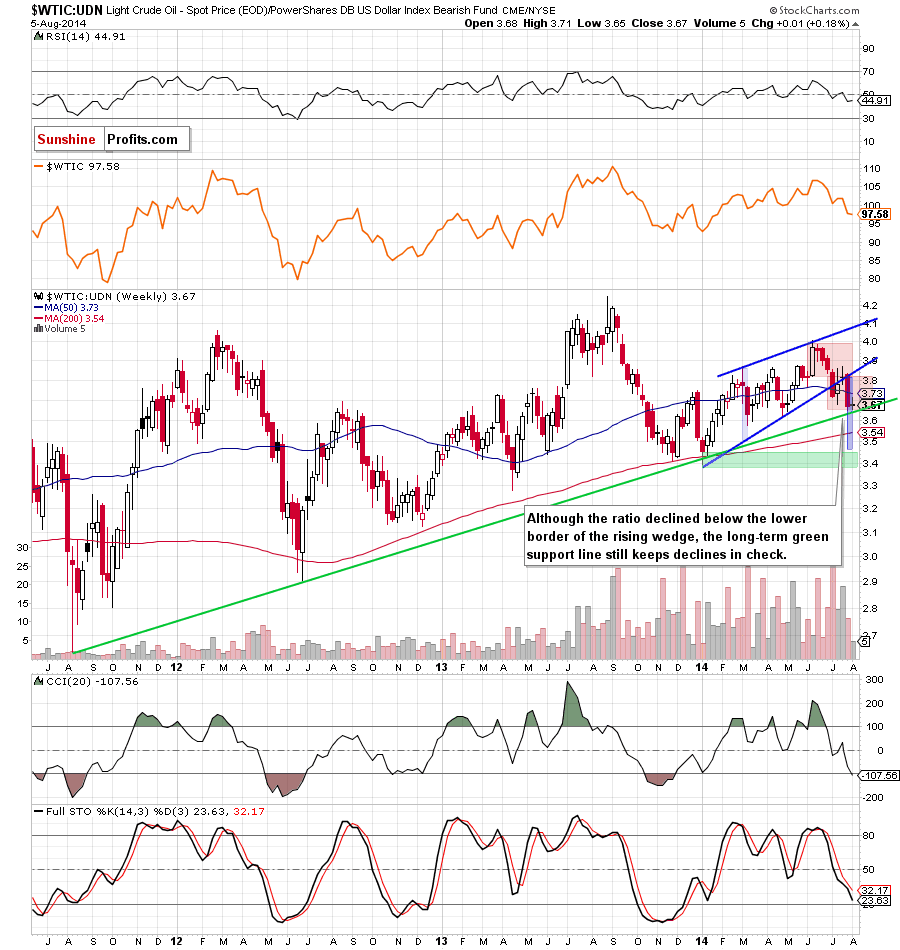
Looking at the above chart, we see that the ratio declined below the medium-term rising blue support line (the lower border of the rising wedge), which triggered a sharp decline to the long-term green support line. At this point, it’s worth noting that with this downswing, the ratio also broke below the lower border of the consolidation (marked with red). As you see on the weekly chart, the recent downward move took the ratio to its downside target (which corresponds to the height of the consolidation), which will likely reduce the selling pressure in the coming week (or weeks). Therefore, it seems to us that the major support line will withstand the selling pressure and we’ll see a corrective upswing and an attempt to come back to the rising wedge. Nevertheless, we should keep an eye on this ratio (as sell signals remain in place), because a breakdown below the long-term green support line would be a very bearish signal that could trigger a sharp decline in the commodity.
Before, we summarize this month’s Oil Investment Update, let’s take a closer look at the USO ETF (a proxy for crude oil). What can infer from its charts?
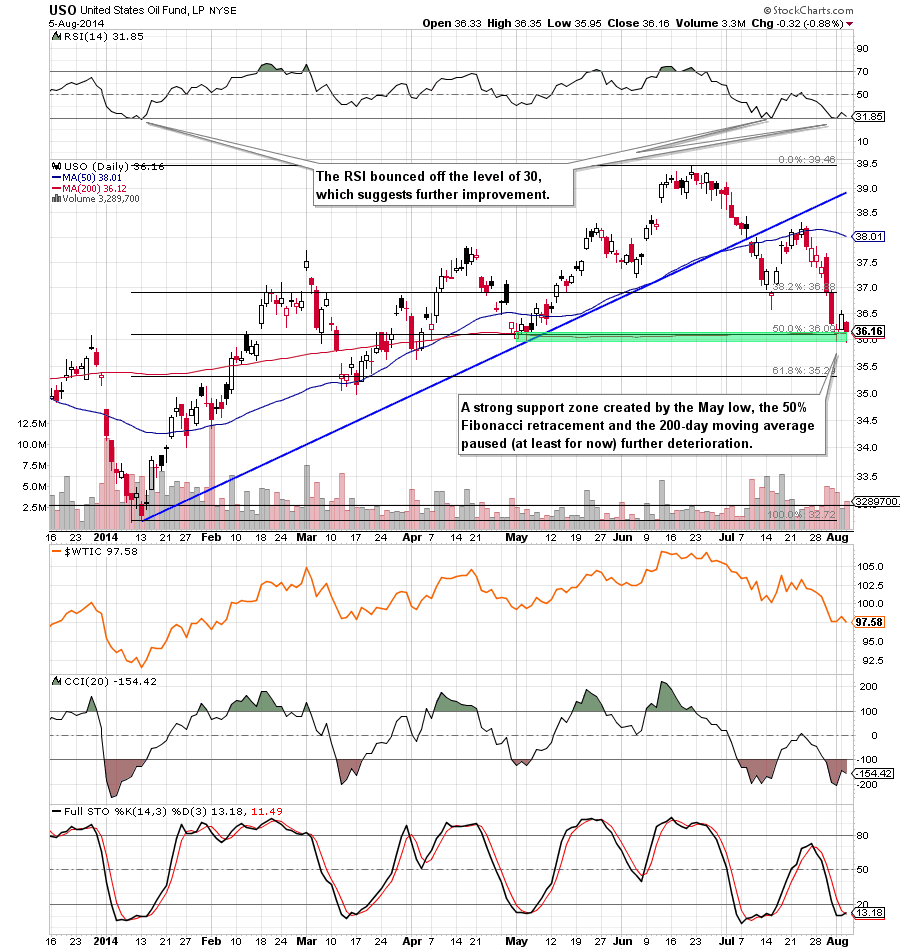
Looking at the above chart, we see that the USO ETF reached a strong support zone (created by the May low and the 50% Fibonacci retracement based on the entire 2014 rally), which corresponds to a drop to the green support zone in the case of crude oil. This situation clearly shows that light crude is weaker than the ETF. Therefore, if we see a corrective upswing on the above chart, it seems to us that crude oil will do the same (even if the size of the upswing will be smaller). Please note that there are positive divergences between the indicators and the ETF, which suggests that a pause or change the current short-term trend is just around the corner.
Scenarios
Just like a month ago, today’s Oil Investment Update includes scenarios of what could happen in the coming weeks. Naturally, we will continue to monitor the market in the coming days and if anything invalidates our long-term outlook we will send you an additional message.
- Bullish scenario
If the support zone created by the March low and the 61.8% Fibonacci retracement based on the entire Jan-June rally withstand the selling pressure, we’ll see a corrective upswing from here to at least $101, where the 38.2% Fibonacci retracement based on the entire recent decline is. Please note that this scenario will be even more likely, if oil bulls manage to invalidate the breakdown below the long-term support/resistance line marked on the monthly chart. - Bearish scenario
If the commodity extends losses and closes below the above-mentioned support area, we will see further deterioration and a test of the strength of the 200-week moving average (currently at $96.06) or even a drop to around $94.76-$95.21, where the strong support zone (created by the 76.4% and 78.6% Fibonacci retracements based on the entire 2014 rally and the Jan. 27 bottom and supported by the 50-month moving average) is.
Summary
The situation from the long-, medium- and short-term perspective has deteriorated as crude oil declined (and confirmed the breakdown) not only below the lower border of the medium-term triangle (marked with blue), but also under the long-term black support line, the 200-day moving average and the psychological barrier of $100. As we have pointed out before, with this downward move light crude also dropped below the long-term support line and the lower border of the consolidation marked on the monthly chart, reaching a very important support zone created by the March low and the 61.8% Fibonacci retracement based on the entire Jan-June rally. Will it withstand the selling pressure?
The current strong negative divergence seen in the oil-stocks-to-oil ratio suggests that if history form 2012/2013 repeats itself once again (as a reminder, back then, such strong negative divergence preceded a sharp decline in the ratio, which translates to higher values of crude oil), we will likely see a bottom of the correction in crude oil in the near future. In our opinion, this scenario will be even more likely if the stocks-to-oil ratio delines from its current position (and best if invalidates the breakout above the horizontal support line), while the WTIC:UDN ratio bounces off the major green support line and the strong support zone marked on the USO ETF chart holds. Nevertheless, we should keep in mind that as long as the current position of the medium-term indicators (in the case of crude oil, the oil-to-gold ratio and the WTIC:UDN ratio) supports oil bears, another attempt to move lower can’t be ruled out.
Very short-term outlook: mixed
Short-term outlook: mixed
MT outlook: mixed
LT outlook: bullish
Trading position (our opinion): If one wants to hold their long position for months, it doesn't seem that the current move lower needs to be really concerning - even if oil drops to $94 or so. In other cases, it seems to us that waiting on the sidelines until the situation becomes clearer is a good idea (which is also our preferred approach at this time).
This completes this month’s Oil Investment Update. Our next Oil Investment Update is scheduled for Thursday, September 4, 2014. Oil Trading Alerts subscribers will additionally receive similar but shorter alerts on a daily basis (or more than once a day when the situation requires it). You – Oil Investment Updates subscribers – will receive short Investment Alert messages should the outlook for the medium or long term change before the next Update is posted.
Thank you.
Nadia Simmons
Forex & Oil Trading Strategist
Oil Investment Updates
Oil Trading Alerts

