

- Crude Oil
- Oil Stocks
- Crude Oil - Oil Stocks Link
- Ratio Analysis
- Non-USD Crude Oil Price
- Scenarios
- Summary
The end of the first half of the year, the second quarter and June are behind us. The confluence of these events has encouraged many analysts to summarize. Without a doubt, it was a good time for crude oil. Since the beginning of the year, light crude climbed from the Jan. low of $91.24 to a nine-month high of $107.68 in the previous month. During that period of time, the commodity erased almost 80% of the Aug.-Jan. decline and reached the strong resistance zone created by the long-term declining resistance line and important Fibonacci retracement levels. From the technical point of view, there are many signs that the price of light crude will not move higher from here, but what about fundamental factors? Will they confirm the bearish scenario?
As is well known, a breakout of military activity anywhere in the world almost always tends to be bullish to the oil market – especially if it appears in an oil producer country. In April, the major fundamental factor, which pushed the price mostly was conflict between Russia (the world's second-largest exporter) and Ukraine. Although these tensions also influenced the price in May, their impact was much smaller as the Ukrainian elections passed without serious incident. From today’s point of view, we can say that even the geopolitical risk surrounding Ukraine appeared, it was not strong enough to push the commodity above the March high. However, conflict in a large oil producer is a different matter. What do we mean? Of course the recent situation in Iraq - the seventh-largest oil producer in the world last year and OPEC's second-most-important producer country. As a reminder, Iraq produced 3.6 million barrels a day, its highest level since before the U.S.-led invasion in 2003. Therefore, deteriorating situation in this country was the major factor that has driven crude oil higher in the previous month.
Because of the Iraqi crisis, where militants from the Islamic State in Iraq and Syria seized the northern cities, the price of crude oil climbed above the previous 2014 high. Although the Islamic State in Iraq and Syria (ISIS) offensive has been largely confined to the north and western parts of Iraq - far from the epicenter of the country's oil production in the south - fears that the conflict could spread and militants could seize control of pipelines and other oil supply chain infrastructure pushed crude oil to its highest level since September and the commodity hit a nine-month high of $107.68. Despite this improvement, light crude reversed after U.S. President Barack Obama said he won't sent troops to Iraq. Additionally, in the following days, investors figured out that active oilfields remain far south from the insurgency and disruption fears are overdone, which encouraged them to lock in gains and resulted in further declines. On top of that, at the beginning of the week, Iraqi security forces have launched a counterattack against the Sunni militant insurgency, with reports that tanks and armored vehicles were pushing through to retake cities. Therefore, it seems that the impact of the Iraq violence on the price could be short-lived (at least as long as oil production is not threatened) - especially when we take into account the fact that U.S. oil production is booming and most of that oil cannot be exported under current law.
And speaking of the export… at the end of the previous month, crude oil moved higher as news that the U.S. government has allowed some exports of a form of ultra light oil supported the price. Although the U.S. has had a ban on crude-oil exports since the 1970s, the Commerce Department gave Pioneer Natural Resources Co. and Enterprise Products Partners LP permission to ship a type of ultra light oil known as condensate to foreign buyers yesterday. This news fueled expectations that the federal government is open to more broadly relaxing the export ban and pushed the price of light crude above $107 per barrel once again. But what happened that the price of crude oil declined in the recent days?
The first bearish factor that pushed the price lower was the U.S. Energy Information Administration report, which showed that crude stockpiles rose in the week ended June 20, defying expectations for a decline. Additionally, disappointing U.S. gross domestic product data in combination with U.S. consumer spending and weekly jobless claims numbers triggered a sharp decline. Although the Thomson Reuters/University of Michigan consumer sentiment index increased, investors didn’t get rid of concerns over the outlook for the wider economic recovery – especially after soft regional manufacturing data (the Chicago purchasing managers’ index slumped to a three-month low), which offset upbeat housing data and fueled worries that yesterday’s jobs report may be weaker-than-expected, which could encourage monetary authorities to leave interest rates low for longer than once thought. However, as it turned out the U.S. Department of Labor reported that non-farm payrolls rose by 288,000 in June, beating expectations for an increase of 212,000, while the unemployment rate dropped to 6.1% from 6.3% in May. Although these stronger-than-expected employment data indicated growing demand for petroleum products, crude oil didn’t increase sharply, instead, we noticed a 0.14% loss and a daily close slightly above $104 per barrel. What happened?
When you take a closer look at the charts, you we’ll see that the commodity declined to its lowest levels since June 10. Why? Because the price of light crude declined on expectations that halted Libyan exports could resume, increasing global oil supplies. Strikes and armed occupations at fields and ports since the fall of leader Moammar Gadhafi have cut Libyan production to around a fifth of its normal output of about 1.5 million barrels a day, keeping U.S. and global prices higher. Meanwhile, yesterday, oil officials said that Libya's National Oil Co. may formally lift a ban on exports from two eastern oil terminals (which account for nearly half of Libya's export capacity) as early as later Thursday.
What impact could it have on the oil market? If we see such action, a resumption of Libyan exports would reduce concerns that an insurgency in Iraq could lead to supply disruptions there and will likely push the price of light crude lower. However, we should keep in mind that some previous pledges to let Libyan exports restart haven't been respected or were followed by new interruptions. Therefore, we think that as long as we do not see shipments from these ports, we should still keep an eye on the current situation in Iraq – especially when we factor in a top U.S. general commentary that Iraq's military is incapable of mounting an offensive against Sunni militants who have seized large sections of the country.
Crude Oil
Let’s start this month‘s Oil Investment Update’s technical part with a closer look at the monthly chart of light crude (charts courtesy by http://stockcharts.com).
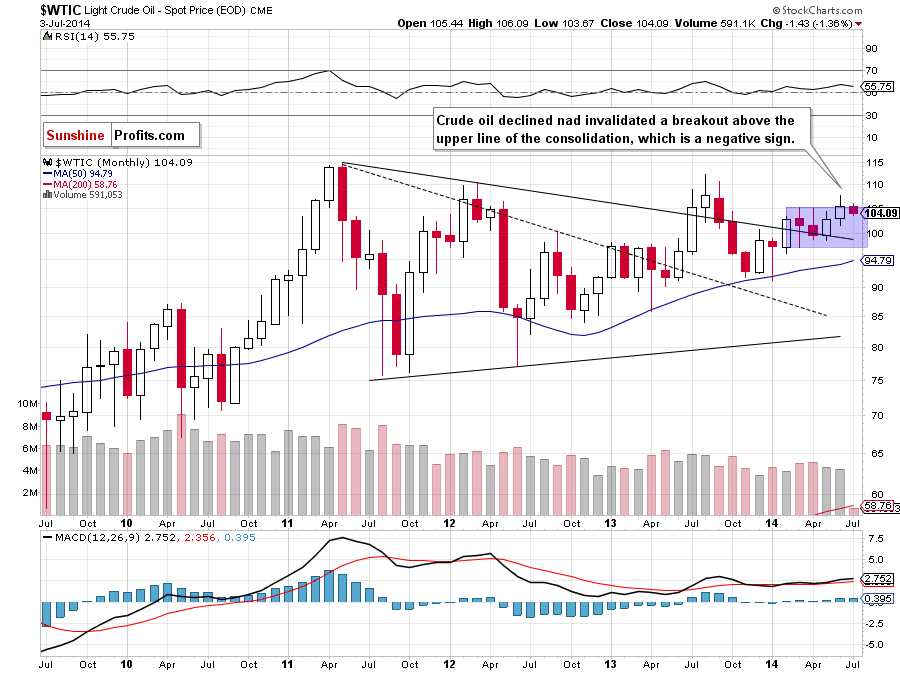
On the monthly chart, we see that although crude oil climbed above the upper line of the consolidation (created by the March high of $105.22) in the previous month, the commodity reversed, invalidating earlier breakout. As you see on the above chart, this strong bearish signal triggered further deterioration earlier this month and, from this perspective, it looks that light crude will find the next support around $101.60, where the May low is.
Are there any strong medium-term lines that could stop oil bears? Let’s zoom in on our picture and find out.
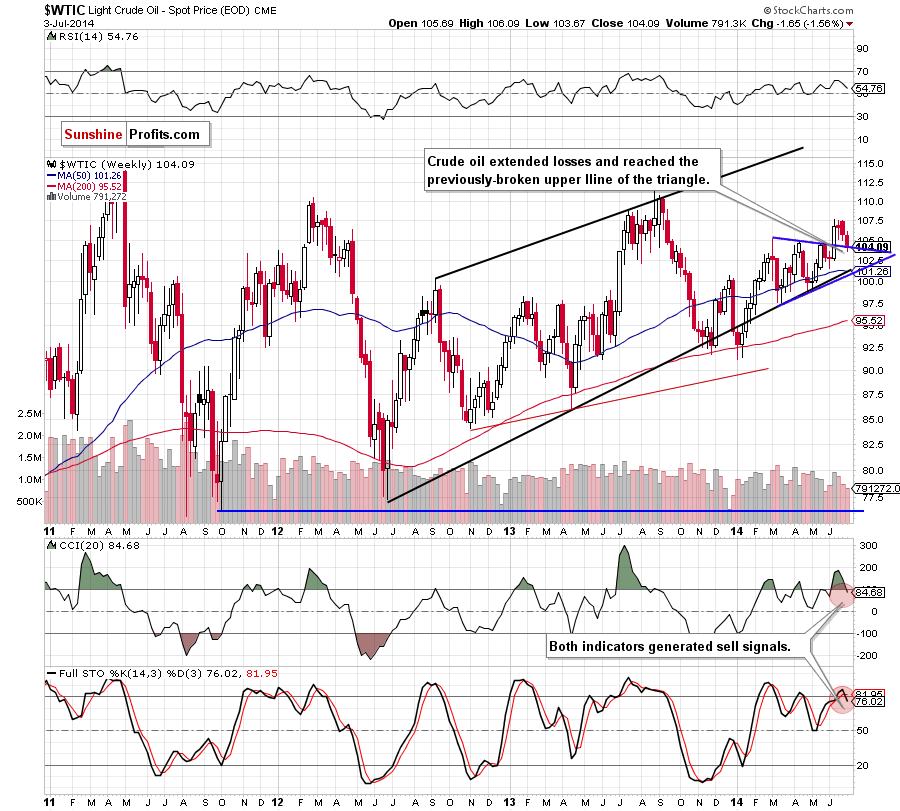
From this perspective, we see that crude oil reversed after an increase to a nine-month high of $107.68, declining to the previously-broken upper line of the blue triangle. If this support line withstand the selling pressure, we’ll see a rebound from here and a corrective upswing to the recent highs. However, if it is broken, crude oil will extend the current correction and the initial downside target will be around $101.60, where the June low is. At this point it’s worth noting that slightly below this level is a strong support zone created by the 50-week moving average (currently at $101.26) and the lower line of the trend channel (and lower border of the blue triangle). Please note that the position of the indicators supports the bearish scenario at the moment as sell signals remain in place.
Now, let’s check the short-term outlook.
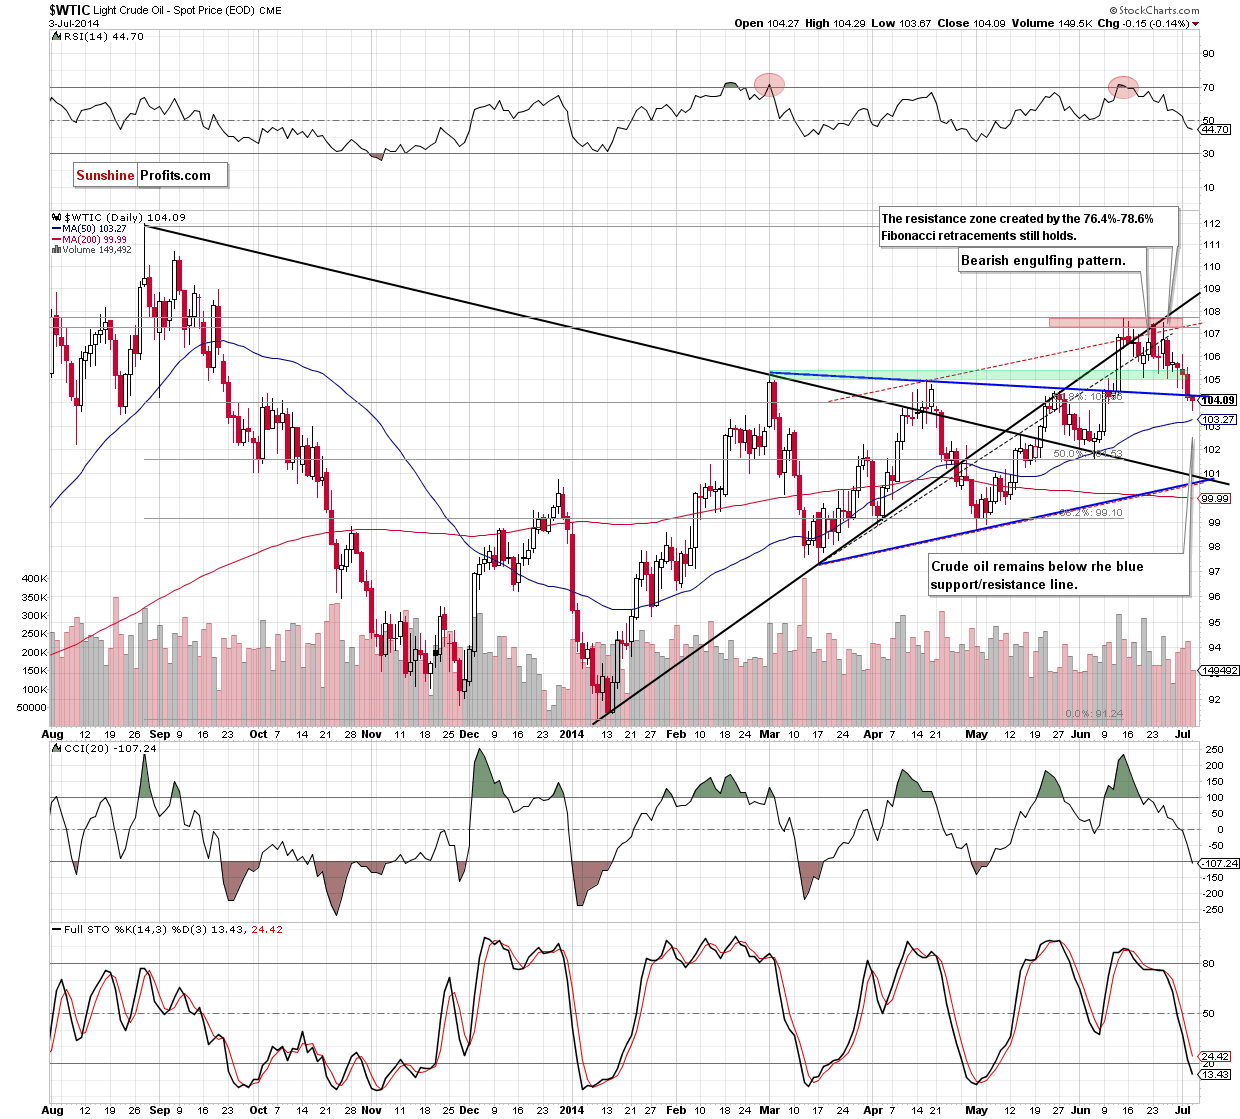
As you see on the daily chart, crude oil declined below the green support zone earlier this week, which triggered a downswing below the medium-term blue line (the upper line of the triangle that we saw on the weekly chart). Although this is a strong bearish signal, so far, the breakdown is not confirmed. On one hand, if oil bulls do not invalidate it and crude oil moves lower, the initial downside target will be the 50-day moving average (currently at $103.27). At this point, it’s worth noting that this area is supported by the 50% Fibonacci retracement (based on the Apr.-June rally). Therefore, if it holds, we’ll likely see an attempt to move above the blue resistance line. However, if it is broken, the next target for oil bears will be around $102.14, where the 61.8% Fibonacci retracement is. Please keep in mind that sell signals generated by the indicators remain in place, supporting the bearish case at the moment.
Summing up, looking at the above charts, we see that the situation from the long-, medium- and short-term perspective has deteriorated as crude oil reversed and declined, invalidating a breakout above the previous (March and April) highs. With this downward move, the commodity declined slightly below the medium-term support line (the upper line of the triangle), but as we have pointed out before, the breakdown is not confirmed (even from the daily perspective). Therefore, we think that crude oil reached the crossroads. If we see an invalidation of the breakdown, the next short-term move will be to the upside and crude oil may increase to around $107 once again. However, the current position of the medium- and short-term indicators suggests further deterioration and lower values of light crude. If this is the case, it seems to us that the commodity will drop to around $102.14, where the 61.8% Fibonacci retracement is or even to the medium-term downside target - the June low of $101.60.
Having discussed the situation in crude oil, let’s examine the NYSE Arca Oil Index (XOI) to find out what the current outlook for oil stocks is.
Oil Stocks
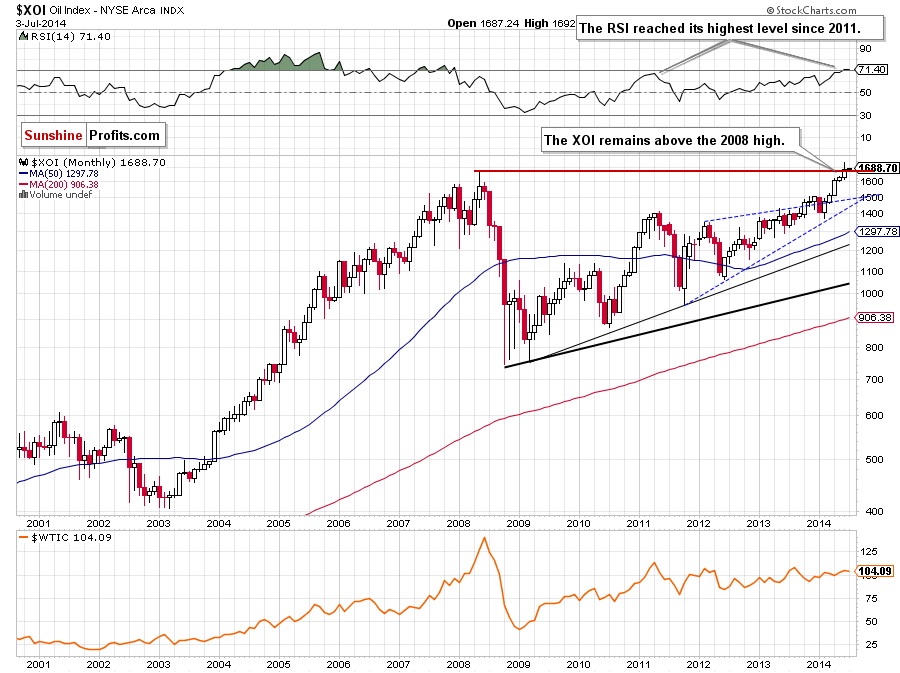
Let’s begin with the long-term chart.
In our last Oil Investment Update, we wrote the following:
(…) the XOI remains between the May high of 1,638 and the May low of 1,599. If the oil stock index moves higher from here, the upside target will be the 2008 high of 1,663.
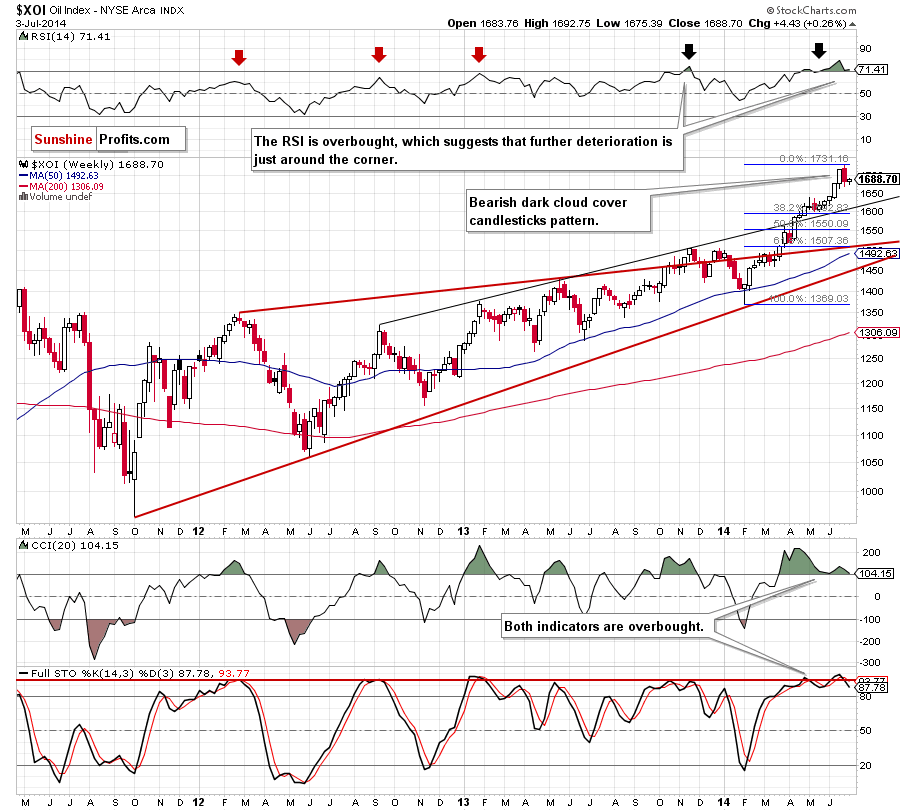
As you see on the above chart, the situation developed in tune with the above-mentioned scenario and the XOI climbed above its upside target, hitting a 6-year high of 1,730 in the previous month. From this perspective, we see that although the oil stock index gave us some gains, it still remains above the 2008 high, which is a positive signal. Therefore, we think that as long as there is no an invalidation of the breakout above this resistance, another attempt to move higher can’t be ruled out. Nevertheless, we should keep in mind that the RSI is still overbought, which suggests that a pause or a correction (if the indicator generates a sell signal) in the coming month should not surprise us.
Will the medium-term chart give us any interesting clues about future moves? Let’s zoom in on our picture and move on to the weekly chart.
Looking at the above chart, we see that the XOI reversed in the previous week, which resulted in a bearish dark cloud cover candlestick pattern. Although this formation is not a serious threat to the uptrend, we think that its combination with an invalidation of the breakout above the psychological barrier of 1,700 and current position of the indicators prescribe caution before making investment decisions. As you see on the weekly chart, there are negative divergence between the CCI and the XOI. On top of that, we noticed similar situation in the RSI, while the indicator stays above the level of 70. In our opinion, all the above suggests that we will likely see another downswing and a re-test of the strength of the previously-broken upper line of the rising trend channel (currently around the key level of 1,600) in the coming weeks. Nevertheless, we should keep in mind that before we see such price action, oil bears will have to push the XOI below the 2008 high of 1,663.
Having discussed the medium-term outlook, let’s turn to the daily chart.
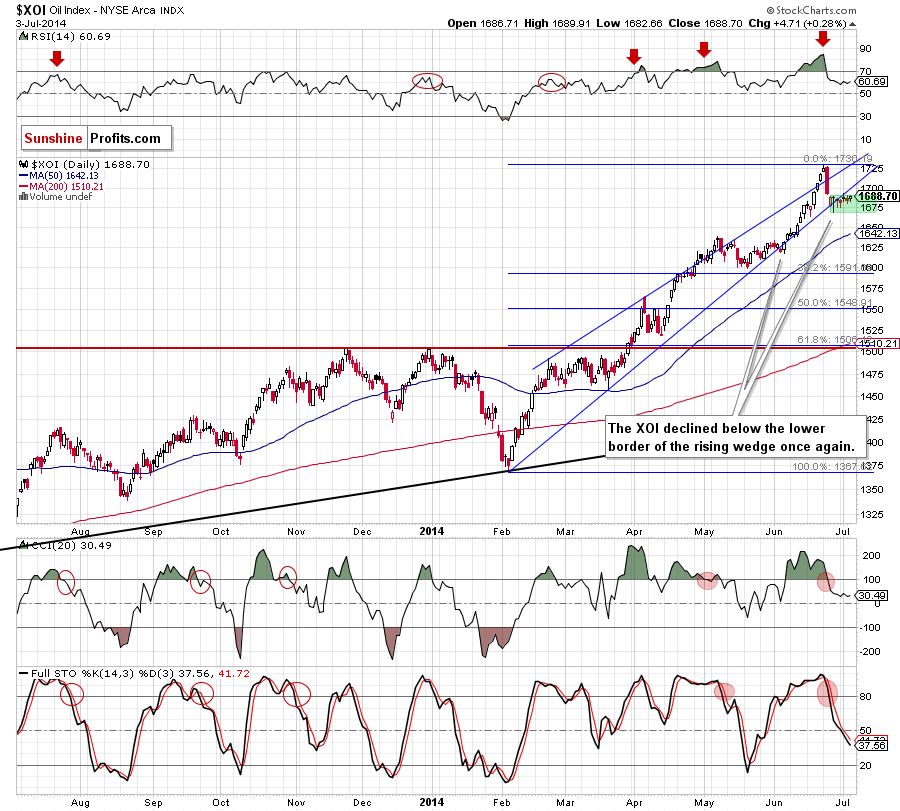
From this perspective, we see that the XOI declined below the lower border of the rising wedge at the end of the previous month. Although this was a strong bearish signal, the oil stock index didn’t decline sharply, instead, we noticed a consolidation between the June 26 high and low. At the beginning of the week, oil bulls tried to invalidate the breakdown, but they fail. Despite this defeat, the XOI is still quite strong, therefore, it seems to us that we’ll see another sizable downward move only if it breaks below the lower border of the consolidation. Please note that the current position of the indicators suggests further deterioration as sell signals remain in place. If this is the case and we’ll see a breakdown, the initial downside target will be around 1591-1600, where the support zone (created by the 38.2% Fibonacci retracement and the psychological barrier) is. Nevertheless, we should keep in mind that as long as the oil stock index is trading around the upper line of the consolidation, another attempt to invalidate the breakdown and come back to the rising wedge can’t be ruled out.
Summing up, the long-term outlook for oil stocks is still bullish as the XOI still remains above the 2008 high. Although from the weekly perspective we don’t see any important technical resistance levels that could stop rally in the near future (except the June high), the combination of a bearish dark cloud cover candlestick pattern, an invalidation of the breakout above the psychological barrier of 1,700 and current position of the indicators suggests that correction in the coming week (or weeks) should not surprise us. In our opinion, if the XOI drops below the 2008 high, the current correction will accelerate and the next downside target will be around 1591-1600, where the support zone (created by the 38.2% Fibonacci retracement and the psychological barrier) is.
Crude Oil - Oil Stocks Link
Having discussed the current situation in crude oil and the oil stock index, let’s comment on the relationship between them.
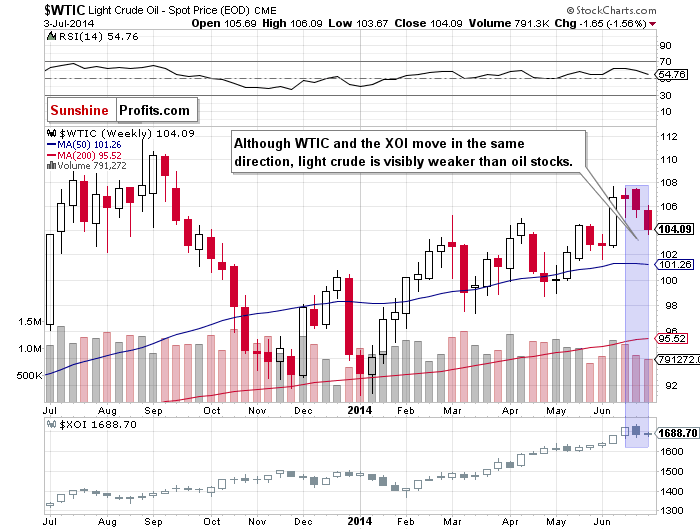
When we take a look at the weekly chart and compare the price action in both cases, we see that although crude oil and oil stocks have moved in the same direction recently, the XOI is visibly stronger than WTIC. This discrepancy is particularly evident this week as the oil stock index remains above last week’s low, while crude oil hit a fresh two-week low. On top of that, oil stocks are trading above the 2008 high, which clearly shows that they still have a better upside potential than the commodity itself.
Ratio Analysis
Today, we start this section by focusing on the oil-to-oil-stocks ratio. What impact could it have on future oil moves? Let’s examine the medium-term picture.
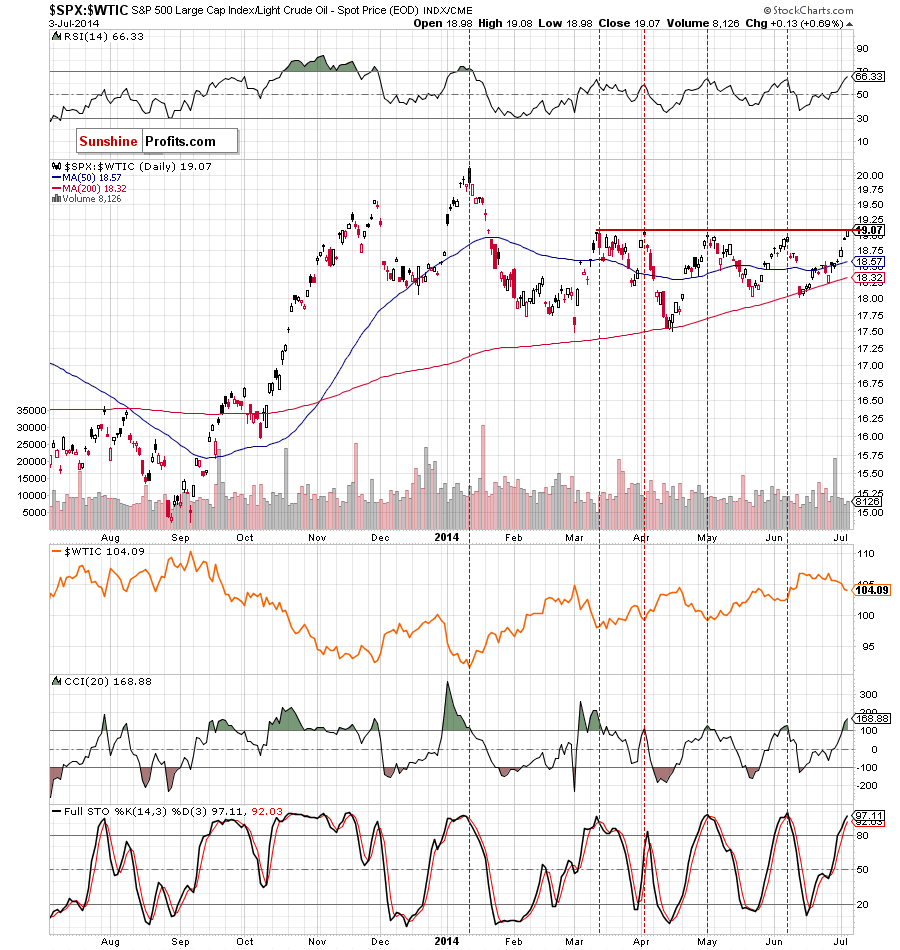
Looking ath the above chart, we see that the ratio remains in a consolidation – slightly above the strong support line created by the Jan., Apr., May and June lows. In rcent weeks, lower values of the ratio triggered a downward move in crude oil, therefore, we think that if this correlation remains in place, we’ll see another re-test of the strength of the support line in the ratio and lower values of the commodity. However, from this perspective, it seems that the space for futher declines might be limited. If the support withstand the selling pressure, we’ll see another rebound in the ratio and an increase to the upper line of the formation, which will likely have a positive impact on light crude – similarly to what we noticed in all previous cases.
What can we infer from the very short-term chart?
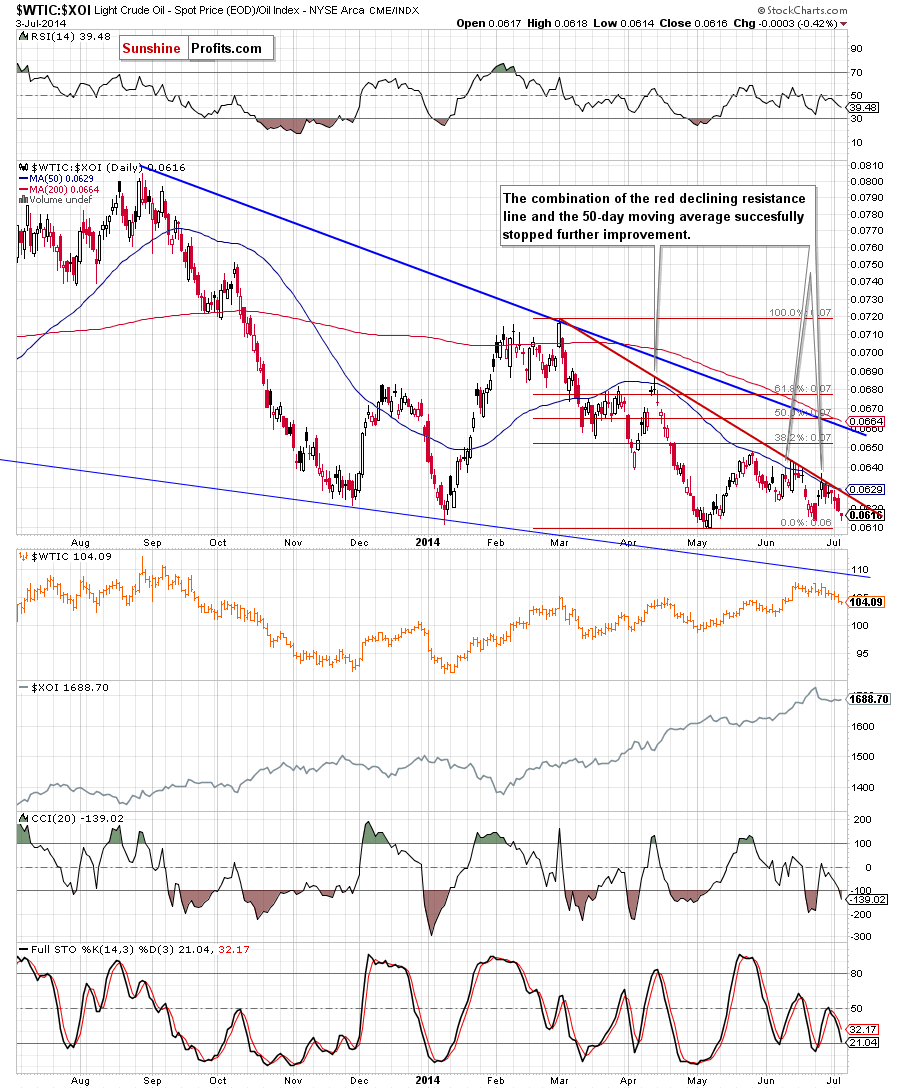
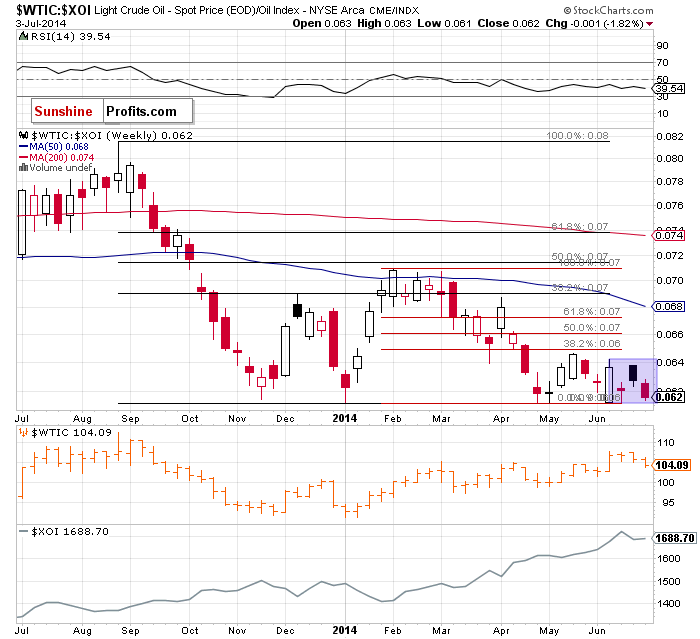
As you see on the above chart, at the end of the previous month, the ratio reversed after an increase to the red declining resistance line (we saw similar price action also in mid-June and in mid-April) and declined, reaching the June low. Taking into account the fact that this line still keeps gains in check, we think that as long as the ratio remains below it we’ll not see another sizable upward move in crude oil. As we mentioned earlier, it seems to us that the space for further declines might be limited, however, if the ratio delines below the nearest strong support zone, it will be a very strong bearish signal that will likely trigger a decline to the blue support line (the lower border of the declining wedge), which succesfully stoppedfurther deterioration at the beginning of the year. If this is the case, we’ll also see lower values of the commodity.
Once we know the above, let’s look for some clues about future crude oil moves on the charts below. At the beginning, let’s examine the oil-to-gold-ratio from the medium-term perspective.
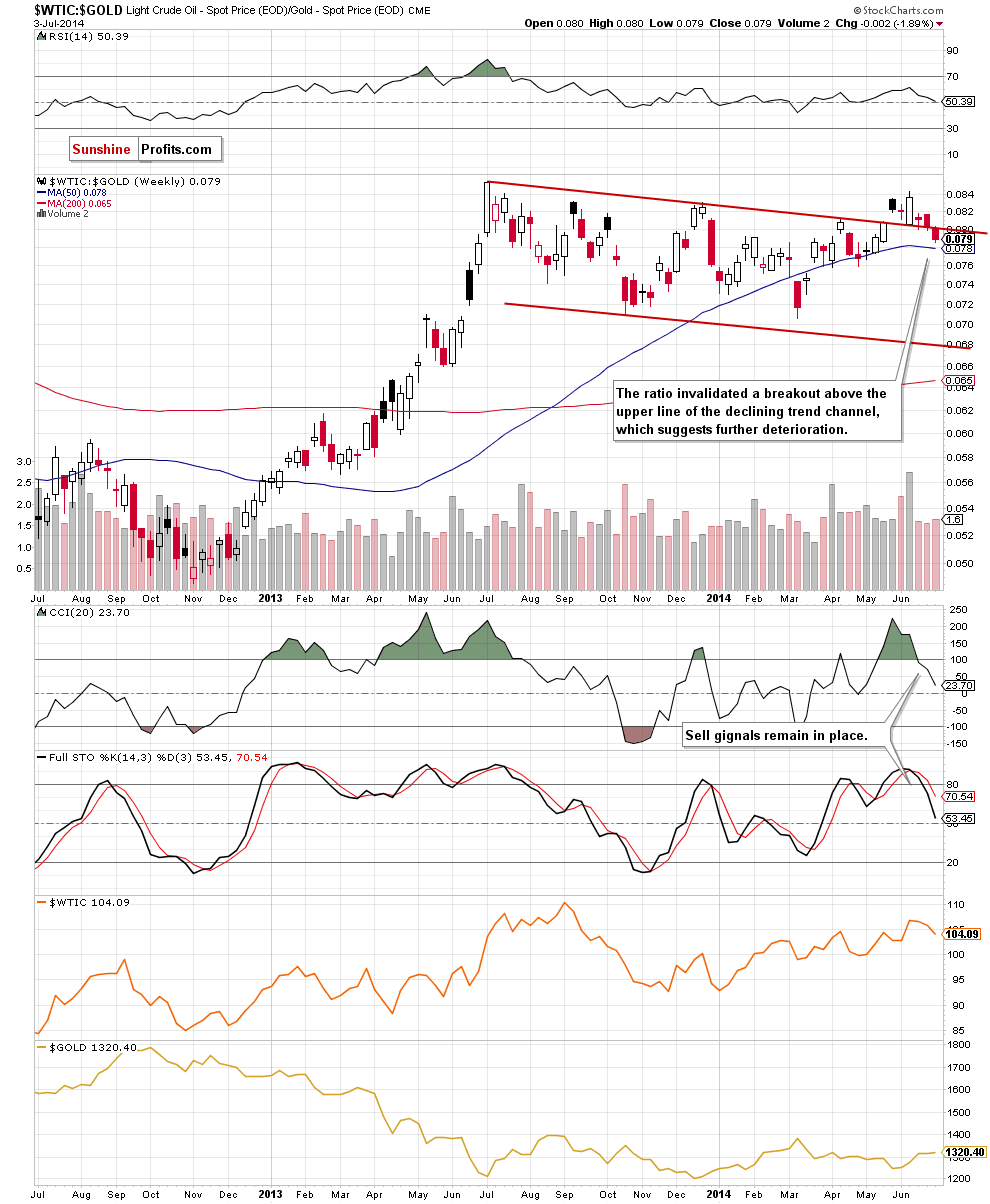
Looking at the above chart, we see that the ratio broke above the upper line of the declining trend channel, which resulted in an increase in crude oil. Despite this improvement, the ratio reversed and decline, invalidating the breakout earlier this week. This is a strong bearish signal, which suggests further deterioration in the ratio. If this is the case, we’ll also see lower values of crude oil in the coming week. As you see on the weekly chart, the initial downside target for oil bears will be the 50-week moving average. If it holds, we’ll likely see a corrective upswing in both cases (the ratio and light crude). However, if it is broken, we’ll see further deterioration and the ratio will likely drop to April’s low, which should also trigger a bigger correction in crude oil. Please note that the CCI and Stochastic Oscillator generated sell signals, which supports the bearish scenario at the moment.
What can we infer from the daily chart?
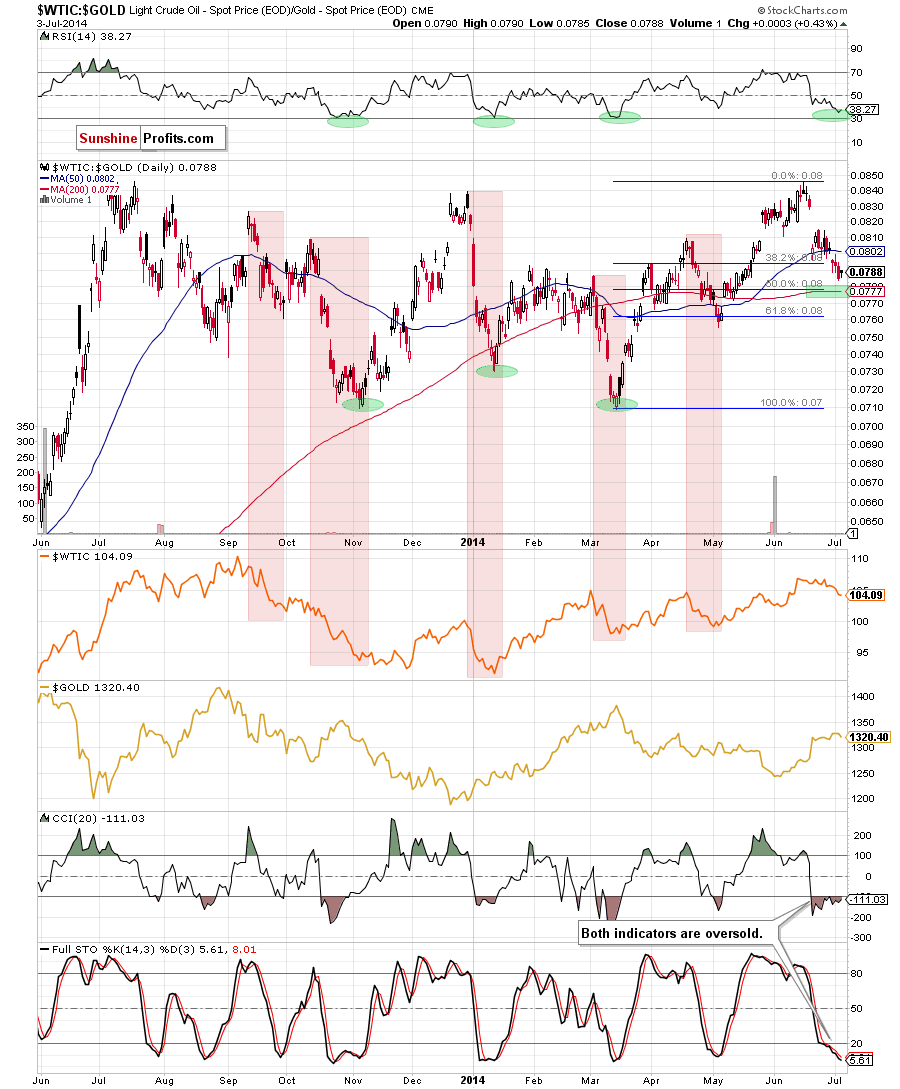
From this perspective, we see that the ratio declined below the 50-day moving average, which tiggered a downswing below the 38.2% Fibonacci retracement based on the entire March-June rally. With thos drop, the ratio approached the support zone created by the next Fibonacci retracement and the 200-day moving average. Therefore, similarly to what we wrote discussing the medium-term picture, if this area holds, we’ll see a corrective upswing to at least the prviously-broken 50-day moving average. However, if the ratio extend declines, we’ll see a drop to the 61.8% Fibonacci retracement or even to the May low. Looking at the current position of the indicators, we see that the CCI and Stochastic Oscillator are overbought, which suggests that the space for further declines might be limited – especially if the indicators generate buy signals.
Once we know the situations in the oil-to-gold ratio, let’s take a closer look at another interesting ratio, which can give us interesting tips and examine the stocks-to-oil ratio.
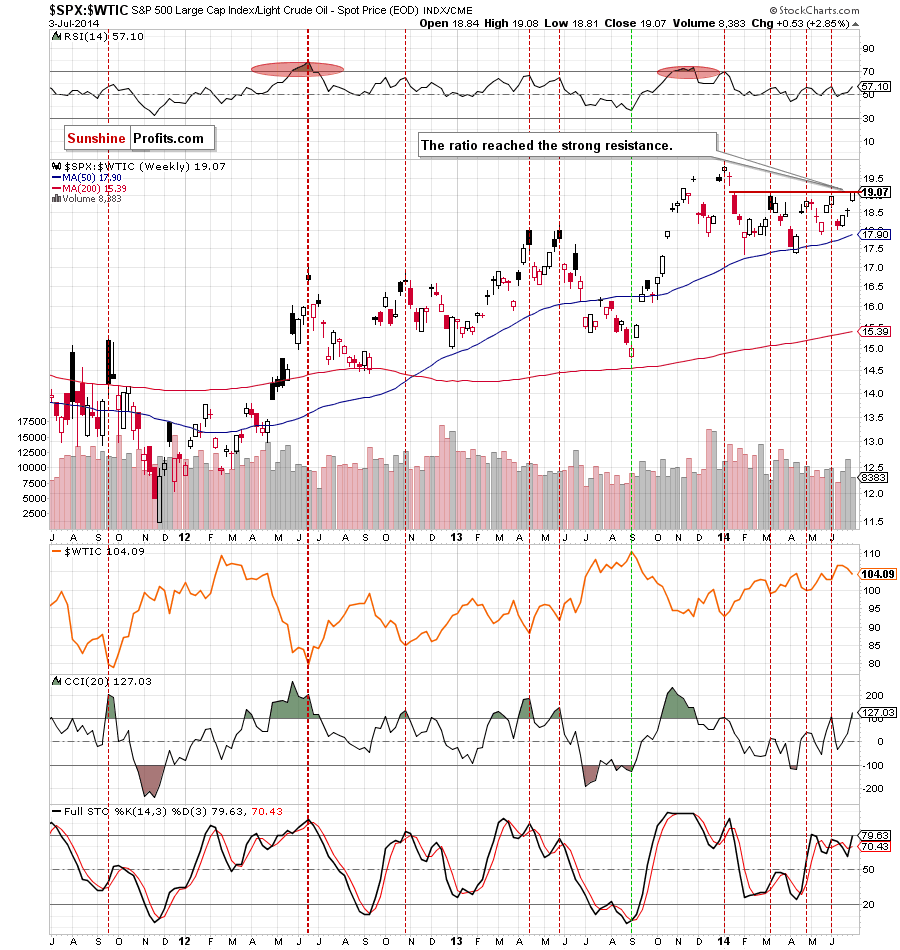
As you see on the above charts, the ratio reached the strong resistance based on the previous highs. When we take a closer look at both charts, we see that there were similar price actions in March, April and June and all attempts to move higher failed, which resulted in a correction. What interesting, every high in the ratio corresponded to the bottom of the correction in crude oil. Therefore, if history repeat itself once again and the ratio reverses, we’ll likely see another move lower in the ratio and rebound in the commodity. Nevertheless, if the ratio breaks above the resistance zone, it will be a strong bullish signal that will trigger an increase to around Jan. high in the ratio and further deterioration in light crude. Therefore, in our opinion it’s worth to keep an eye on the above charts in the coming days, because we’ll likely receive a valuable clue where the commodity head next.
Non-USD Crude Oil Price
Once we know the situation in both ratios and its implications for crude oil, let’s take a look at the non-USD (WTIC:UDN ratio) chart of crude oil. As a reminder, UDN is the symbol for the PowerShares DB US Dollar Index Bearish Fund, which moves in the exact opposite direction to the USD Index. Since the USD Index is a weighted average of the dollar's exchange rates with world's most important currencies, the WTIC:UDN ratio displays the value of crude oil priced in "other currencies".
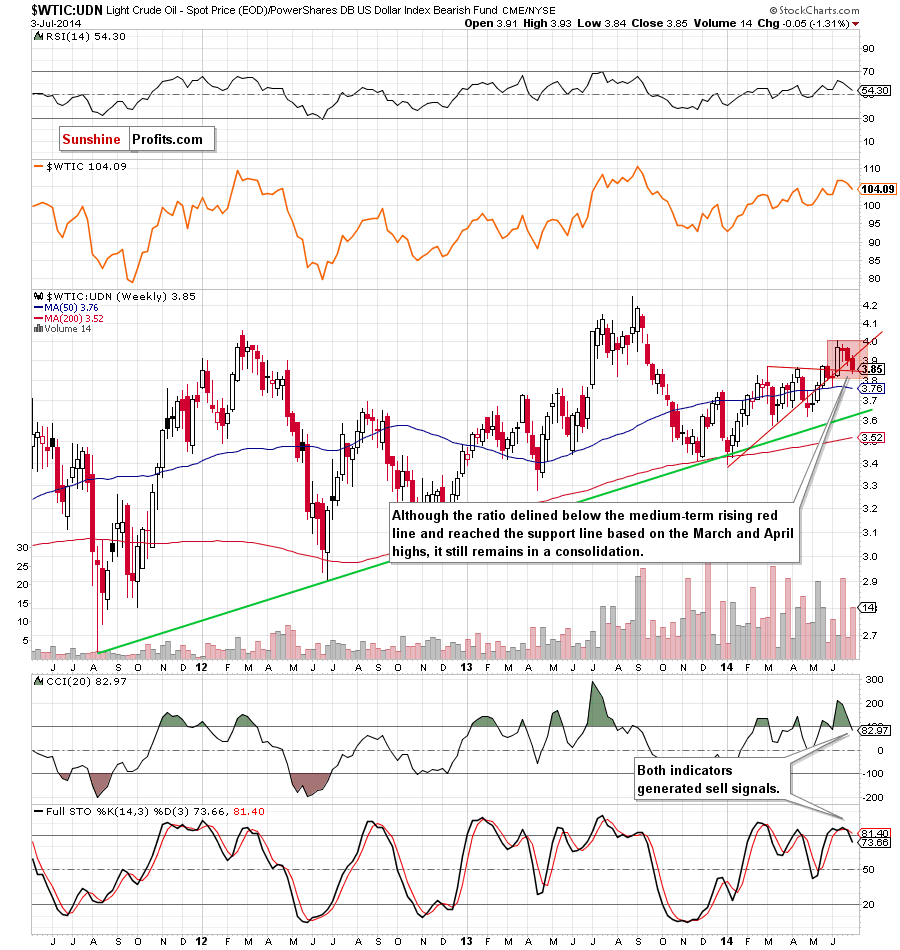
Looking at the above chart, we see that the ratio reversed from the June high and declined below the medium-term rising red support line. This drop triggered further deterioration and crude oil extended losses, reaching the support line based on the March and April highs. If this line withstand the selling pressure, will see a corrective upswing to the nearest resistance line. However, if it is broken, the ratio will decline to at least 3.76-3.77, where the 50-week moving average and the June low are. At this point, it’s worth noting that if we see a breakdown, the ratio will also drop below the lower border of the consolidation (marked with red), which may trigger a downswing to around 3.63, where the size of the downswing will correspond to the height of the formation (please note that this area is currently supported by the long-term green support line). From this perspective, we see that the CCI and Stochastic Oscillator generated sell signals, which supports the bearish scenario.
Scenarios
Just like a month ago, today’s Oil Investment Update includes scenarios of what could happen in the coming weeks. Naturally, we will continue to monitor the market in the coming days and if anything invalidates our long-term outlook we will send you an additional message.
- Bullish scenario
If oil bulls manage to invalidate a small breakdown below the blue medium-term support line (the upper line of the triangle), we’ll see a rebound from here, which will likely trigger further improvement and a comeback to around recent highs, where the long-term declining line (based on the 2008 and 2013 highs) and strong resistance zone (created by the 76.4% and 78.6% Fibonacci retracement levels) are. If this area is broken, it will be a strong bullish signal and crude oil may increase to around $109.85 (the 88.6% Fibonacci retracement) or even to the 2013 high of $112. - Bearish scenario
If the commodity extends losses and closed this week below the above-mentioned support line, we will see further deterioration and a drop to around $101.26-$101.60, where the strong support zone created by the June low, the 50-week moving average and the lower line of the trend channel (and lower border of the blue triangle) is. If this important area is broken, crude oil will accelerate the current correction and we’ll see a decline to the April low of $98.74 or even to the March low of $97.37.
Summary
The situation in the long-term deteriorated slightly as crude oil invalidated a breakout above the previous highs. From the medium-term perspective this move resulted in a drop to slightly below the blue support line (the upper line of the triangle). As we have pointed out before, the breakdown is barely visible on the weekly chart and unconfirmed on the daily chart. In our opinion, this is the key support line at the moment, because a confirmation or an invalidation of the breakdown will trigger another sizable move. If the commodity goes north, we’ll see a comeback to around the 2014 high and if light crude goes south, we could see a drop to the very important medium-term support area. So, where the commodity head next?
The current situation in the oil-to-oil-stocks ratio suggests that the space for further declines might be limited shortly as the strong support area is very close. In all previous cases, it withstood the selling pressure and we saw a rebound, which had a positive impact on crude oil. Therefore, if history repeats itself, we may see a corrective upswing in the coming week (or weeks). This scenario will be even more likely if the oil-to-gold ratio bounces off the support zone (created by the 50% Fibonacci retracement and the 200-day moving average) and the stocks-to-oil ratio delines below the resistance zone, which succesfully stopped further improement in the previos months. Nevertheless, we should keep in mind that the current position of the medium-term indicators (in the case of crude oil, the oil-to-gold ratio and the WTIC:UDN ratio) supports further deterioration (even if we see a short-term improvement).
Very short-term outlook: bearish
Short-term outlook: bearish
MT outlook: mixed
LT outlook: bullish
Trading position (our opinion): If one wants to hold your long position for months, it doesn't seem that the current move lower needs to be really concerning - even if oil drops to $94 or so. In other cases, it seems to us that waiting on the sidelines until the situation becomes clearer is a good idea (which is also our preferred approach at this time).
This completes this month’s Oil Investment Update. Our next Oil Investment Update is scheduled for Wednesday, August 6, 2014. Oil Trading Alerts subscribers will additionally receive similar but shorter alerts on a daily basis (or more than once a day when the situation requires it). You – Oil Investment Updates subscribers – will receive short Investment Alert messages should the outlook for the medium or long term change before the next Update is posted.
Thank you.
Nadia Simmons
Forex & Oil Trading Strategist
Oil Investment Updates
Oil Trading Alerts

