
- Crude Oil
- Oil Stocks
- Crude Oil - Oil Stocks Link
- Ratio Analysis
- Non-USD Crude Oil Price
- Oil Stocks – Stocks Link
- Scenarios
- Summary
May was another good month for oil bulls. During that time, crude oil gained 3.20%, came back above the long- and medium-term resistance lines and climbed to its highest level since mid-April, hitting a five-week high of $104.50. However, at the end of the month, light crude gave up some gains and declined below the resistance zone, which resulted in a verification of the breakdown and a drop below $103 per barrel. The first day of the new month was also positive for oil bears. Which fundamental factors have been driving prices higher in recent weeks?
In our previous Oil Investment Update, we wrote the following:
(…) it seems that there were three major fundamental factors that have affected the price mostly: tensions between Russia and Ukraine (and also sanctions imposed on Russia), doubts over the oil export from Libya and domestic crude oil inventories.
Did they also influence the price in May? Of course they did. Firstly, as long as there were concerns that Ukraine was descending into civil war, the price of light crude extended gains on every news, which could trigger more sanctions against Russia, affecting Russian oil shipments. However, crude oil reversed and eased off a five-week high on May 26, after the Ukrainian elections passed without serious incident, easing concerns over a disruption to supplies from the region. In this way, crude oil lost its major ally, which drove the price higher in the previous weeks.
And what about doubts over the oil export from Libya? Although news that French and Algerian oil companies were evacuating employees out of the country supported the commodity for a very short-term period of time, it seems that the recent reports from the county could have a more significant impact on light crude in the near future. As a reminder, yesterday, the price of the commodity was weighed down by reports that Libyan production was at 156,000 b/d, up from 155,00 b/d a day earlier and that the Hariga oil export terminal could reopen within two days. On top of that, on Sunday, Iraq's oil ministry said that country's crude exports last month averaged 2.582 million b/d with all the supplies sent from Iraq's southern terminals. The May figure was 73,000 b/d higher than the April total of 2.509 million b/d.
Taking these signs of rising supplies and combining them with the current level of crude oil inventories , it seems that the commodity may lose another fundamental factor, that kept declines in check.
And speaking of the oil inventories… In the latest weekly report, the U.S. Energy Information Administration showed that crude oil inventories rose by 1.657 million barrels last week (and remain not far from the record high of 399.4 million barrels reached in the week ended April 25), while analysts had expected crude inventories to rise by 483,000 barrels. Although it was a strong bearish factor, this bigger-than-expected build in crude oil stocks was overshadowed by bullish gasoline figures. Gasoline supplies declined by 1.803 million barrels last week, contrary to expectations of a 283,000-barrel increase.
Despite rising domestic supplies, U.S. crude oil ended the month up 3%, as traders focused on falling inventories in Cushing, Oklahoma, which stood at 21.7 million barrels as of May 23, the lowest level since 2008. Please note that inventories in Cushing have fallen 16 out of the last 17 weeks and are down more than 20 million barrels since late January, when a new pipeline opened to ship oil out of storage to refineries along the Gulf Coast. In this way, Cushing supplies reached operational minimum capacity, meaning that oil cannot be easily pumped out of storage. Therefore, it seems that supplies in Oklahoma will remain in focus in the coming weeks, and could overshadow bearish reports from the EIA.
Crude Oil
Once we know the major fundamental factors that affected the price of crude oil, let’s move on to the technical part of this month‘s Oil Investment Update and take a look at the charts from different time horizons to have a more complete picture of the current situation in the oil market.
Let’s start with a look at the monthly chart of light crude (charts courtesy by http://stockcharts.com).
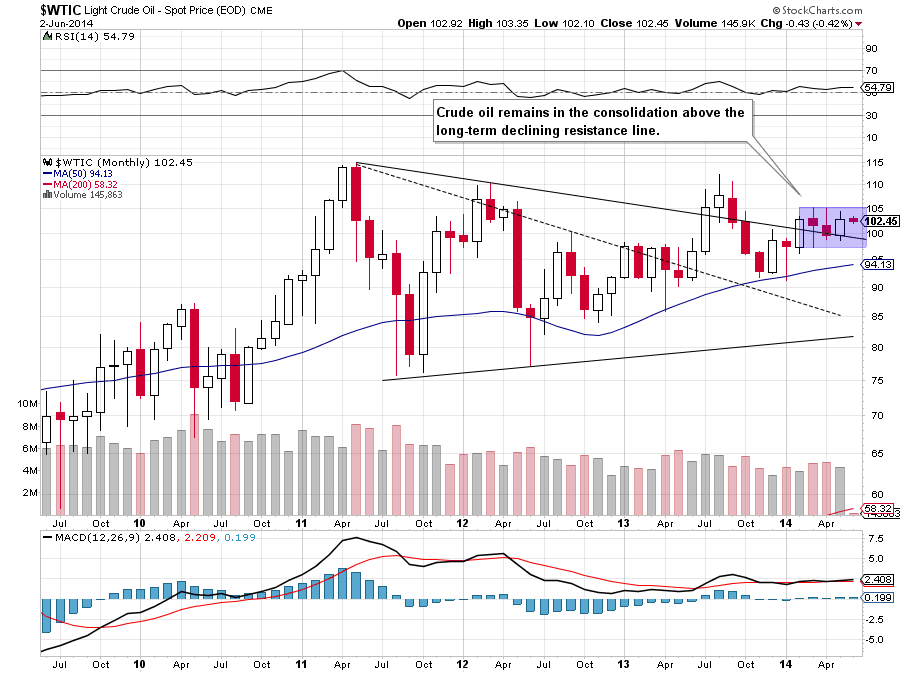
On the above chart, we see that crude oil remains in a consolidation around the long-term black declining line. Although we saw three attempts to move lower, they all failed and the commodity still remains above its major support. Does it mean that the situation is bullish? At the first glance, the answer is yes. However, we should keep in mind that although oil bears failed, their opponents didn’t manage to push light crude above the upper line of the consolidation (created by the March high of $105.22). Therefore, in our opinion, as long as there is no breakout above this line (or breakdown below the March low of $97.37) another sizable long-term move is not likely to be seen.
Will the medium-term chart give us any interesting clues about future moves? Let’s zoom in on our picture and find out.
In our previous Oil Investment Update, we wrote the following:
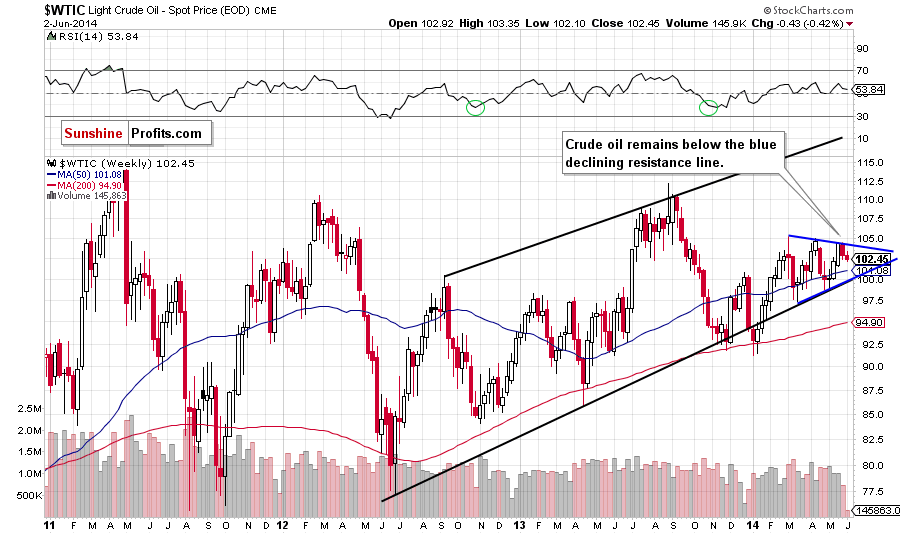
(…) If history repeats itself and the lower line of the trend channel holds, we may see an upward move in the coming weeks (similar to the March-April rally) and the upside target would be around $105.
Looking at the above chart, we see that oil bulls almost realized the above-mentioned scenario, hitting the May high of $104.50. With this upswing, the commodity reached the declining resistance line based on the previous highs (marked with blue). As you see on the weekly chart, this line is also the upper border of the triangle. Therefore, we think that another meaningful move will appear only if crude oil breaks above the upper or the lower line of this formation. So far, the proximity to the blue resistance line has supported oil bears, and it’s seems quite likely that it will continue to be supportive for them in the coming weeks. If this is the case, we’ll see futher deterioration and the initial downside target will be the 50-week moving average (currently at $101.08). However, taking into account price moves that we saw earlier this year, we think that crude oil will re-test the strength of the lower line of the trend channel (around the psychological barrier of $100 at the moment when these words are written) once again.
Please keep in mind that if this area is broken, we will see further deterioration and the initial downside target will be the March low of $97.37. If the commodity drops under this support level, the next stop may be the 200-week moving average (currently at $94.90).
Now, let’s check the short-term outlook.
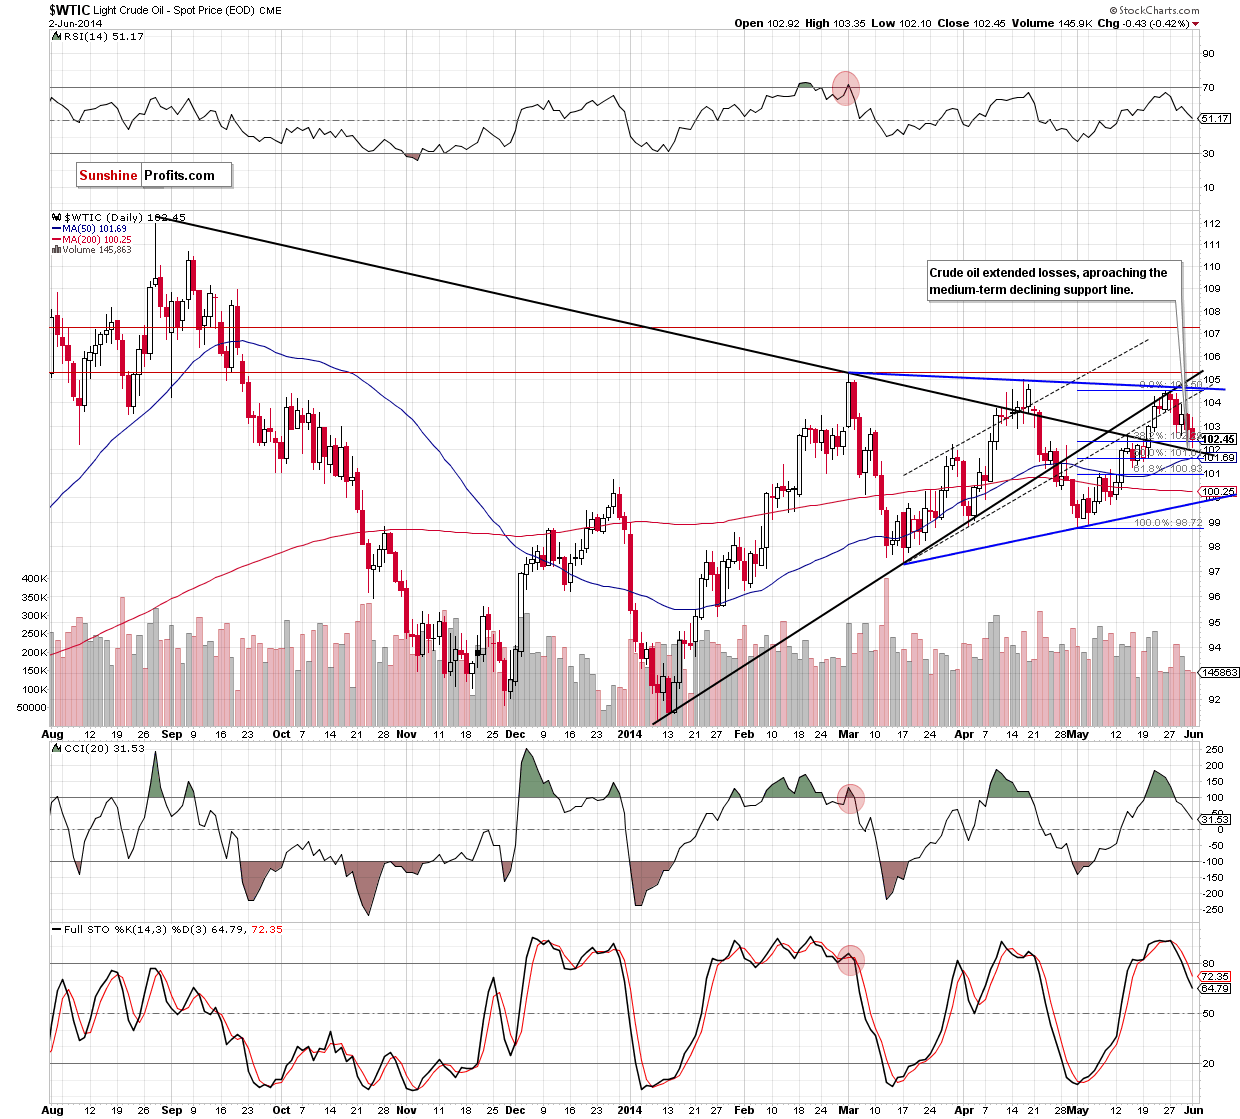
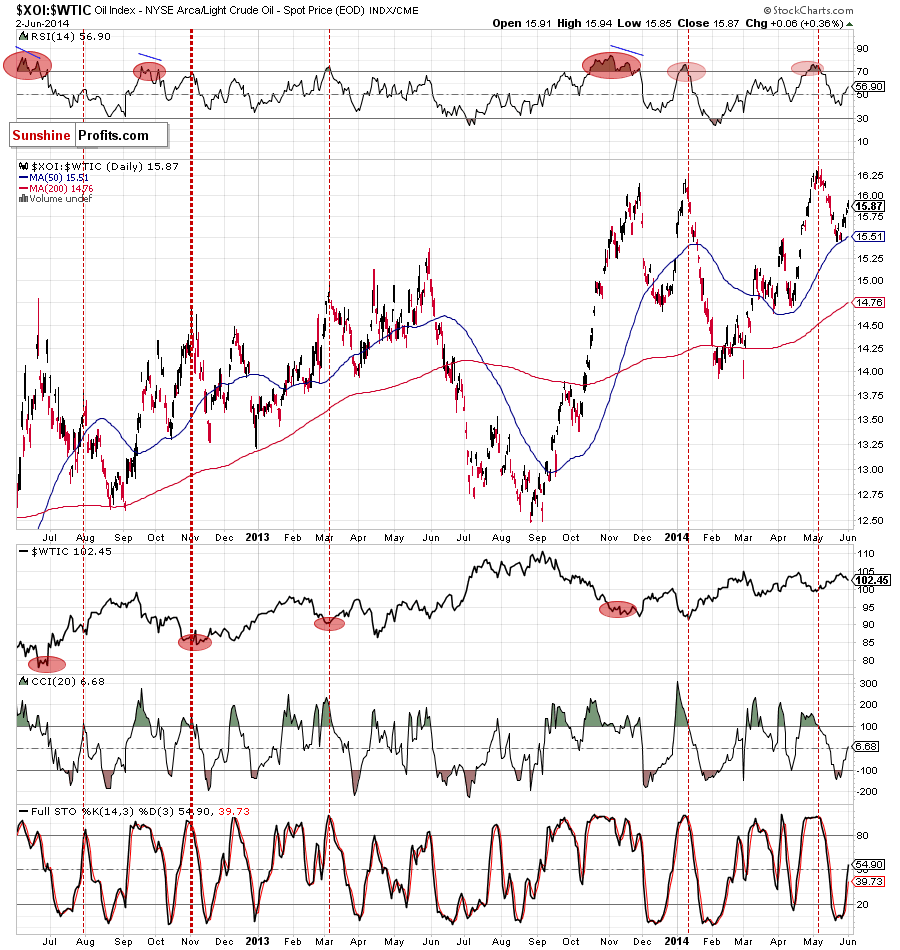
From the short-term perspective, we see that the rally that we saw in May took the commodity not only to the blue declining resistance line based on the previous highs, but also to the black medium-term rising resistance line. The combination of these resistance lines and the proximity to the April high was strong enough to trigger a correction at the beginning of the previous week. So far, crude oil erased around 40% of earlier upward move, declining slightly below the38.2% Fibonacci retracement level. As you see on the above chart, light crude reached the previously-broken black medium-term declining line. Taking into account the importance of this line, we should consider two scenarios. On one hand, if this strong support encourages oil investors to push the buy button, we may see a corrective upswing to around $103.56, where the Friday high is. On the other hand, if it is broken, we will see a drop to around $101.62-$101.69, where the next Fibonacci retracement and the 50-day moving average are. Please keep in mind that sell signals generated by the CCI and Stochastic Oscillator are still in play, supporting the bearish case.
Summing up, looking at the above charts, we see that the situation from the long-term perspective is unclear and doesn’t have a meaningful impact on the medium-term moves. It seems to us that we might see some support around the declining long-term line (currently at $99.55) if crude oil extends losses below the lower border of the medium-term blue triangle (marked on the weekly chart). However, taking into account the fact that light crude is currently higher, in our opinion, the key line is the previously-broken black medium-term declining line (marked on the daily chart). The reason? If we’ll see a rebound from here, it may trigger further improvement and a comeback to the blue medium-term line (the upper border of the triangle). On the other hand, if it is broken, we think that crude oil will extend losses not only to the 50-day moving average, but also test the strength of the 200-day moving average, which currently is slightly above the psychological barrier of $100 and the lower border of the medium-term triangle.
Having discussed the current outlook for crude oil, let’s examine the NYSE Arca Oil Index (XOI) to find out what the current outlook for oil stocks is.
Oil Stocks
Let’s begin with the long-term chart.
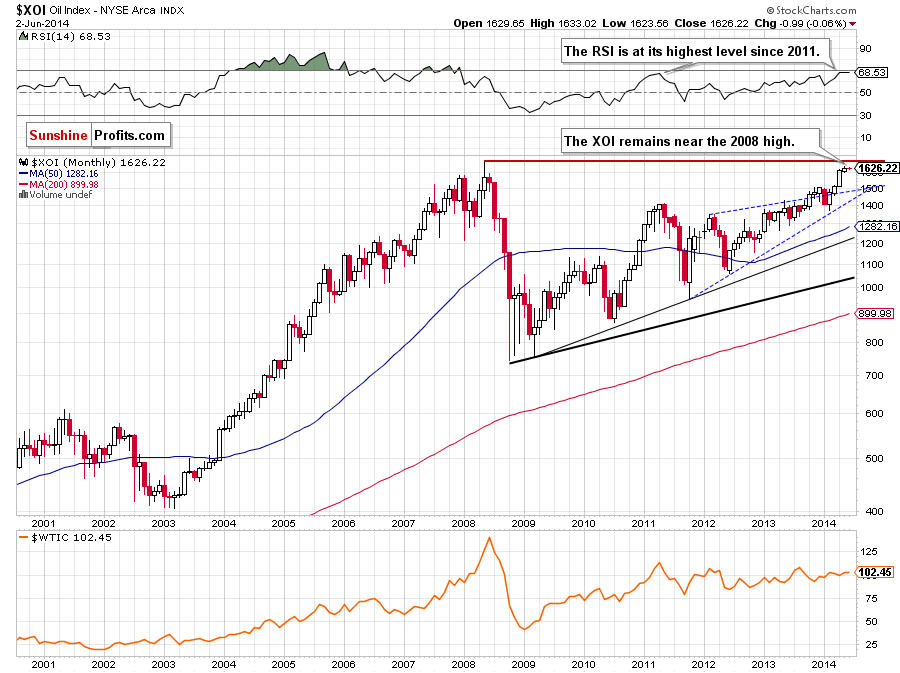
From this perspective, we see that the situation hasn’t changed much since our previous Oil Investment Update was posted as the XOI remains between the May high of 1,638 and the May low of 1,599. If the oil stock index moves higher from here, the upside target will be the 2008 high of 1,663. However, taking into account the fact that the RSI is at its highest level since 2011, it seems to us that a pause or pullback is likely to be seen.
Will the medium-term chart confirm this scenario? Let’s zoom in on our picture and move on to the weekly chart.
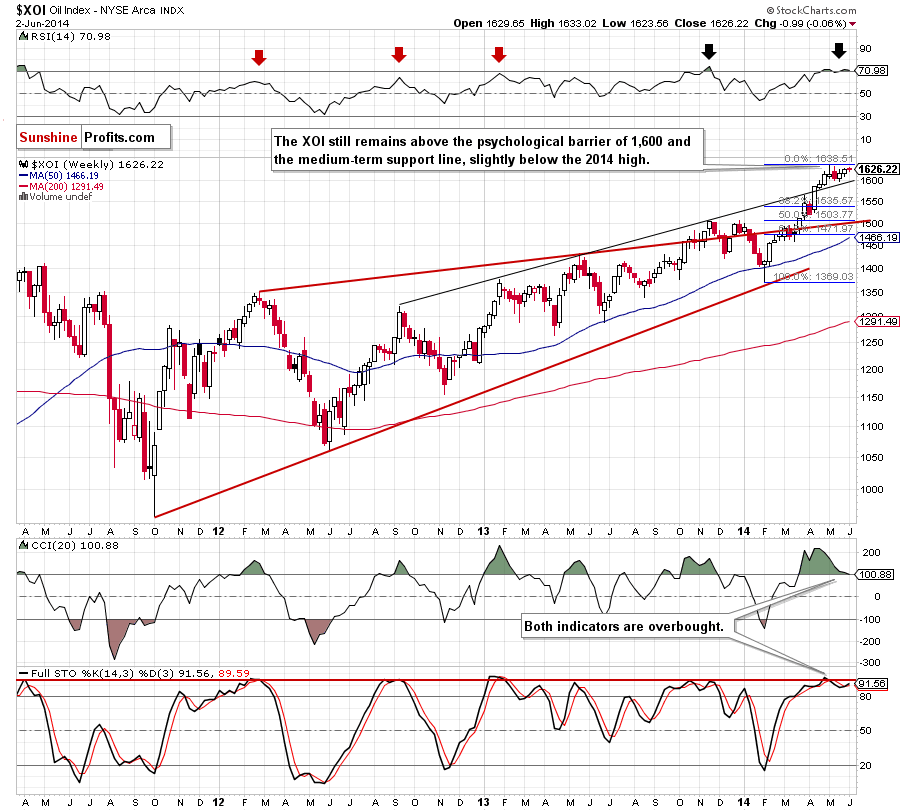
Quoting our previous Oil Investment Update:
(…) we don’t see any important technical resistance levels that could stop rally in the near future. However, when we take a closer look at the position of the indicators, the situation is not as bullish as it seems at the first glance. (…) there is a negative divergence between the CCI and the XOI, which is the first bearish signal. Additionally, the Stochastic Oscillator is at its highest level since the beginning of 2013, while the RSI broke above the level of 70. (…) similar circumstances predicted the trend reversal in the previous years (for example, in Sept. 2012, Jan. 2013 and also in Nov. 2013). Therefore, we think that if history repeat itself once again, we will likely see a correction in the coming week (or weeks).
As you see on the above chart, we noticed such price action in the first half of May as the XOI corrected, declining to the psychological barrier of 1,600. Despite this deterioration, this strong support encouraged investors to push the buy button, which resulted in an upward move that erased almost all losses and took back the oil stock index to slightly below the May high. What’s next? As we have pointed out before, from this perspective, we don’t see any important technical resistance levels that could stop rally in the near future. However, similarly to what we saw a month ago, a negative divergence between the CCI and the XOI remains in place, while the RSI came back above the level of 70. In our opinion, all the above suggests that we will likely see another downward move and a re-test of the strength of the key level of 1,600 in the coming weeks.
Having discussed the medium-term outlook, let’s turn to the daily chart.
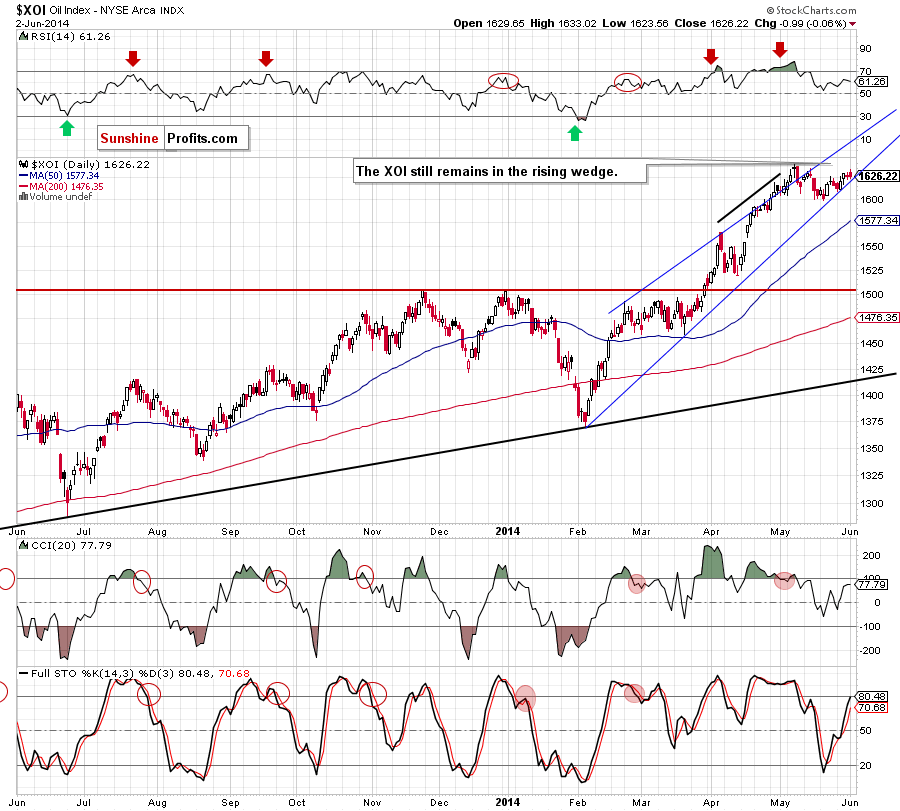
In our previous commentary on oil stocks, we wrote the following:
(…) the RSI climbed to its highest level since the beginning of the previous month. Back then, even lower value of the indicator triggered a correction in the XOI (please note that we saw similar situations in October, November and also in December ). Additionally, the CCI and Stochastic Oscillator are overbought, which suggests that a correction is just around the corner.
Looking at the above chart, we see that all the above-mentioned bearish factors was strong enough to trigger a correction in the following days. As we mentioned earlier, the correction took the oil stock index to the psychological barrier of 1,600. From this perspective, we see that another supportive technical factor, which pushed the XOI higher was the lower border of the rising wedge (in our last Oil Investment Update we called this formation the rising trend channel, but taking into account the fact that both border lines are getting close to each other, the current definition seems to be more appropriate). At the end of the previous month, this line successfully stopped further deterioration and still serves as major short-term support.
As you see on the daily chart, the XOI declined and reached this line yesterday. If it holds, we will likely see an attempt to break above the May high. However, if it is broken, we’ll see a pullback to at least the key level of 1,600. If this area withstand the selling pressure, we’ll see a comeback to the lower border of the rising wedge, but if oil bears push the XOI lower, the next downside target will be the 50-day moving average (currently at 1,580).
Summing up, similarly to what we wrote in the case of crude oil, the long-term outlook is mixed as the XOI remains between last month’s high and low. From the short-term perspective, the situation is quite bullish as we don’t see any important technical resistance levels that could stop rally in the near future. However, the current position of the indicators suggests that correction is just around the corner, which should raise the attention of oil stocks holders – especially if oil stocks drop below the lower border of the rising wedge marked on the daily chart.
Crude Oil - Oil Stocks Link
Having discussed the current situation in crude oil and the oil stock index, let’s comment on the relationship between them.
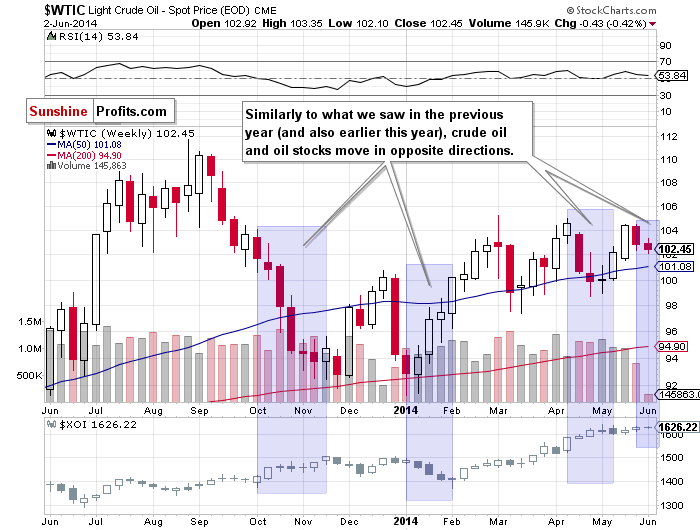
When we take a look at the weekly chart and compare the price action in both cases, we see that although there was a week when crude oil and oil stocks moved higher together, the overall relation between them is negative. As you see on the above chart, in the previous two weeks light crude declined, while the XOI erased earlier losses, which suggests that oil stocks have a better upside potential. Additionally, thanks to this negative relation between light crude and the XOI, we can infer interesting clues from the analysis of the ratio.
Ratio Analysis
Today, we start this section by focusing on the oil-stocks-to-oil ratio. What impact could it have on future oil moves? Let’s examine the medium-term picture.
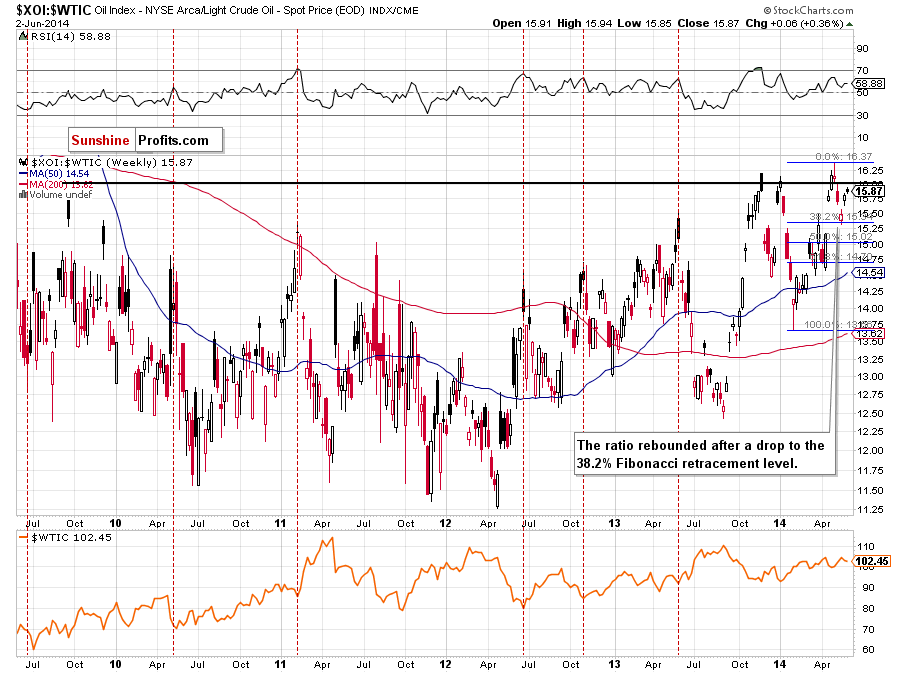
The first thing that catches the eye on the above chart is an invalidation of the breakout above the horizontal resistance line. This strong bearish signal, triggered a decline, which took the ratio to the 38.2% Fibonacci retracement level based on the Feb.-May rally. What happened with crude oil at that time? Similarly to what we saw in the recent years, the commodity moved higher. Taking this strong negative correlation between the ratio and the price of light crude into account, it seems to us that further improvement, will trigger lower values of crude oil. Nevertheless, we should keep in mind that the space for further growth in the ratio may be limited by the May high (which corresponds to the May low in the case of light crude). If we see such price action, it will likely mean that the bottom (not necessarily the final bottom) in light crude is in. On the other hand, if the ratio breaks above the May high, crude oil will extends losses and we’ll see the commodity below the key level of $100.
And what is the short-term picture of the ratio?
From this point of view, we see that the ratio bounced off the 50-day moving average and approached the gap that we noticed in mid-May. If this resistance holds, we may see a pullback in the ratio and a rebound in crude oil. However, if it is close, the next upside target will be the May high, which (as we mentioned earlier) corresponds to the last month’s low in light crude. Please note that the current position of the indicators supports the bullish case, indicating that lower values of crude oil in the coming days are more likely than not.
Having discussed the above, let’s take a closer look at the oil-to-oil-stocks ratio. Will we get any interesting clues when look at this relationship from this perspective? Will anything become clearer?
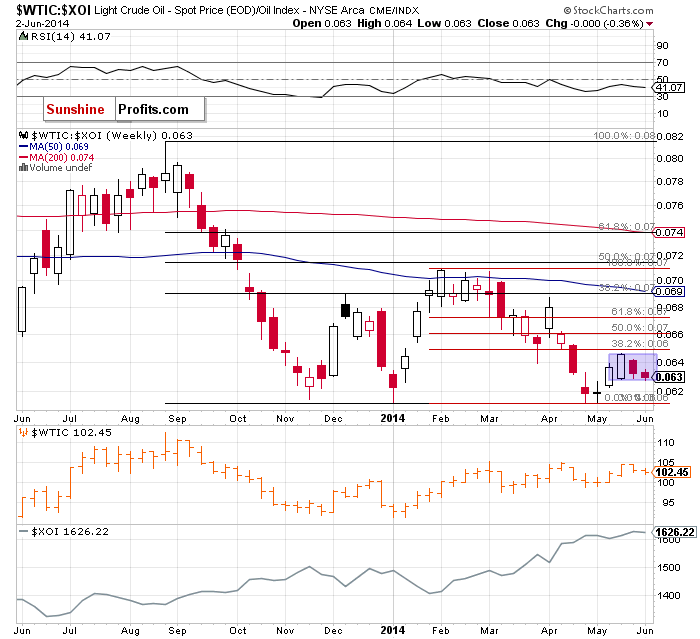
From the weekly perspective, the situatioin is a bit unclear as the ratio remains in a consolidation. Nevertheless, we clearly see that slightly above the upper border of the formation is the 38.2% Fibonacci retracement, which serves as the nearest resistance. Therefore, in our opinion, even if the ratio rebounds, the space for further growth might be limited. On top of that, the ratio is currently slightly above the lowe border of the consolidation, which suggests that if this support is broken, we’ll see another test of the strength of strong support level based on the Jan., Apr. and May lows. What does it mean for crude oil? If we see further deterioration in the ratio, we belive that light crude also move lower and declined to around $100, which corresponds to the above-mentioned support level in the ratio.
Can we infer something more from the daily chart?
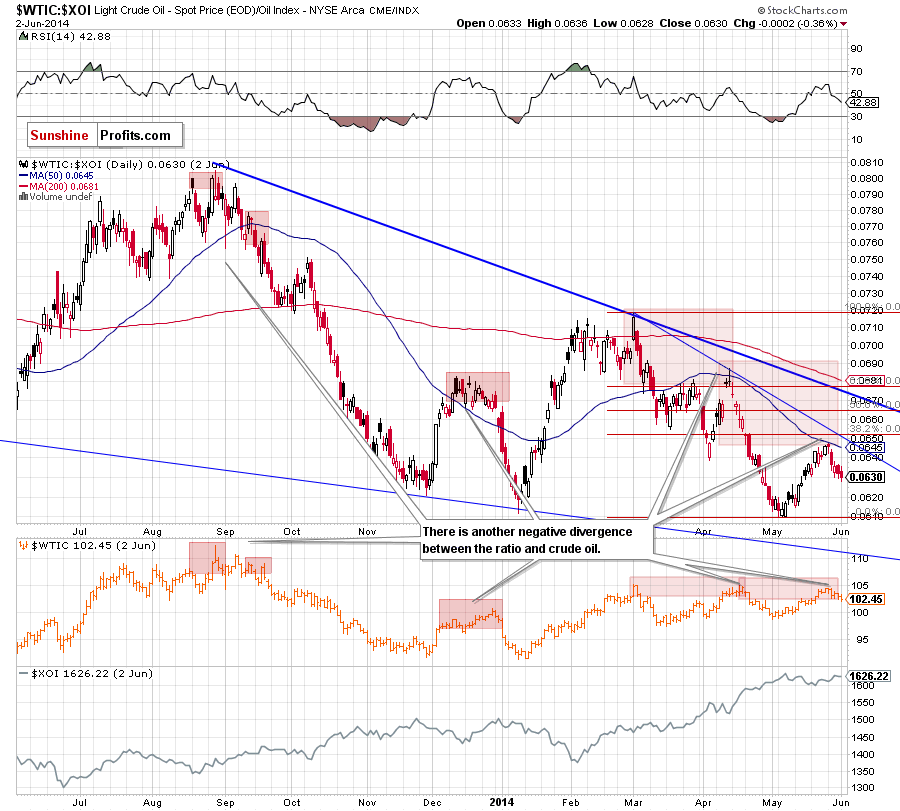
From this perspective, we see that the ratio is visibly lower than crude oil. Although it doesn’t seem bearish at the first sight, we would like to to draw your attention to the fact that we saw similar price actions in the past. In all earlier cases (marked with red on the above chart), when the ratio rebounded less than light crude, we saw a significant decline in the commodity. Therfore, we think that if history repeats itself once again, light crude will extend losses in the near future.
Non-USD Crude Oil Price
Once we know the situation in both ratios and its implications for crude oil, let’s take a look at the non-USD (WTIC:UDN ratio) chart of crude oil. As a reminder, UDN is the symbol for the PowerShares DB US Dollar Index Bearish Fund, which moves in the exact opposite direction to the USD Index. Since the USD Index is a weighted average of the dollar's exchange rates with world's most important currencies, the WTIC:UDN ratio displays the value of crude oil priced in "other currencies".
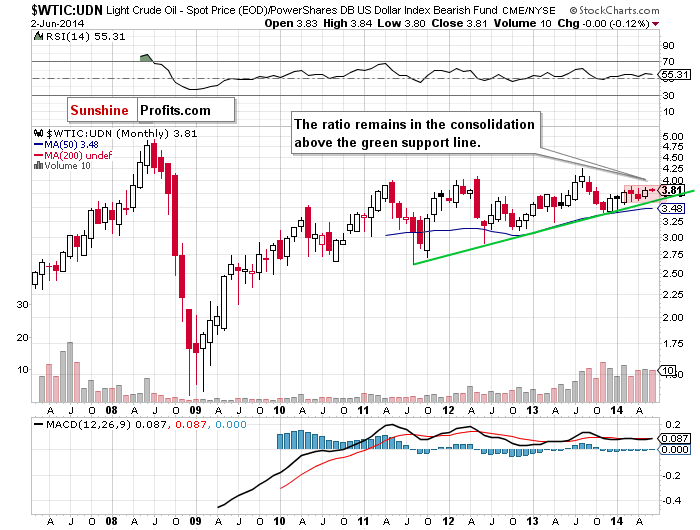
As you see on the above chart, the ratio remains in the consolidation, still above the green support line, which doesn’t give us any interesting clues about future moves in crude oil. Will the medium-term picture be more useful? Let’s take a look at the weekly chart.
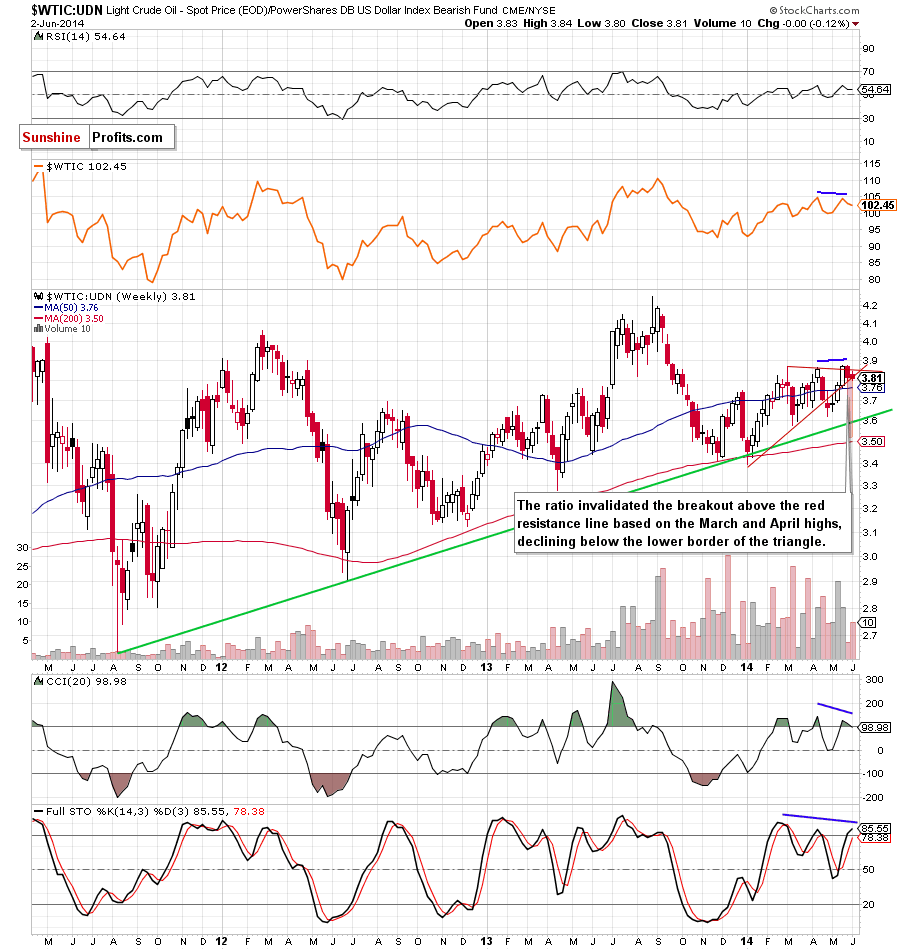
From this perspective, we see that the ratio moved visibly higher than crude oil (priced in U.S. dollars), breaking above the resistance level created by the March and April highs. Despite this improvement, the breakout was invalidated in the previous weeks, which was a strong bearish signal that triggered a decline in crude oil priced in "other currencies". On top of that, the ratio dropped below the lower border of the triangle, which suggests further deterioration and a correction to at least the 50-week moving average. What does it mean for light crude? Taking into account the fact that crude oil has been visibly weaker than the ratio recently, we think that further deterioration will likely push the price lower in the coming weeks.
Before, we move to a relationship between the XOI and the S&P500, let’s take a closer look at the USO ETF (a proxy for crude oil). What can infer from its charts?
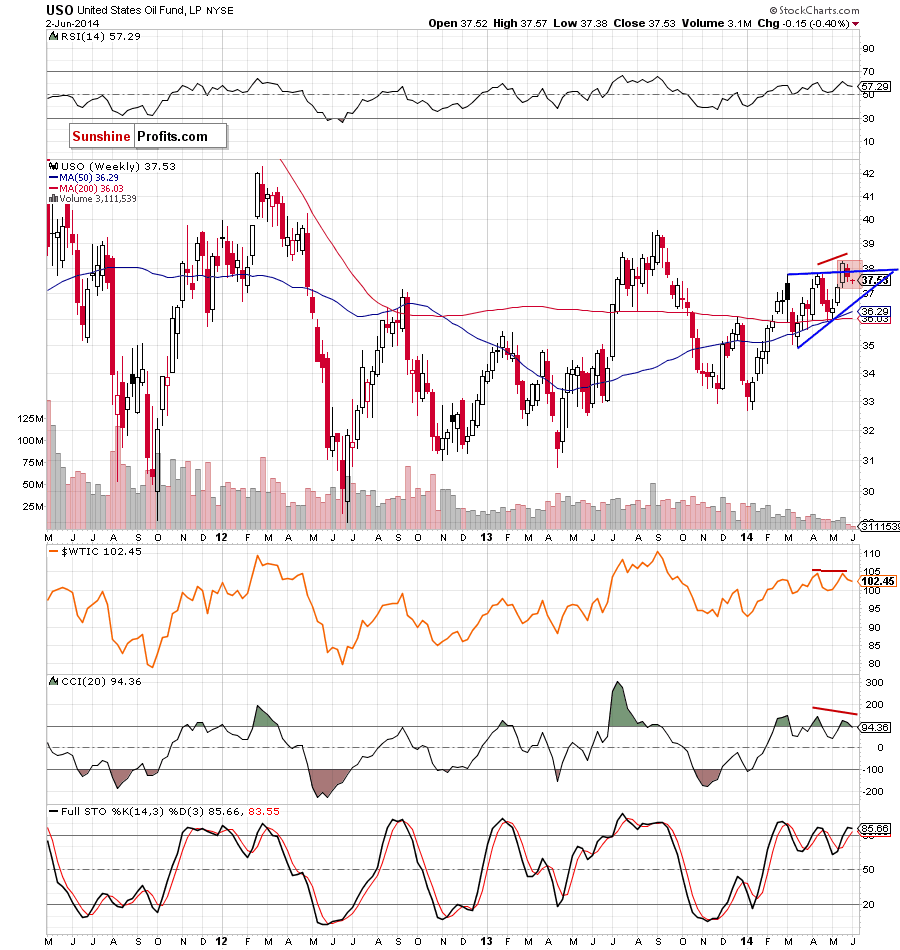
On the weekly chart, we see similar situation that we noticed in the case of the WTIC:UDN ratio – an invalidation of the breakout above the upper line of the medium-term triangle, which is a strong bearish sign. Additionally, we noticed a negative divergence between the USO ETF and crude oil, which clearly shows that light crude is weaker than the ETF. Therefore, if we see further deterioration on the above chart, it seems to us that crude oil will do the same (or even decline faster). Please note that there are negative divergence between the indicators and the ETF, which suggests that further deterioration is just around the corner.
Are there more bearish signals on the daily chart?
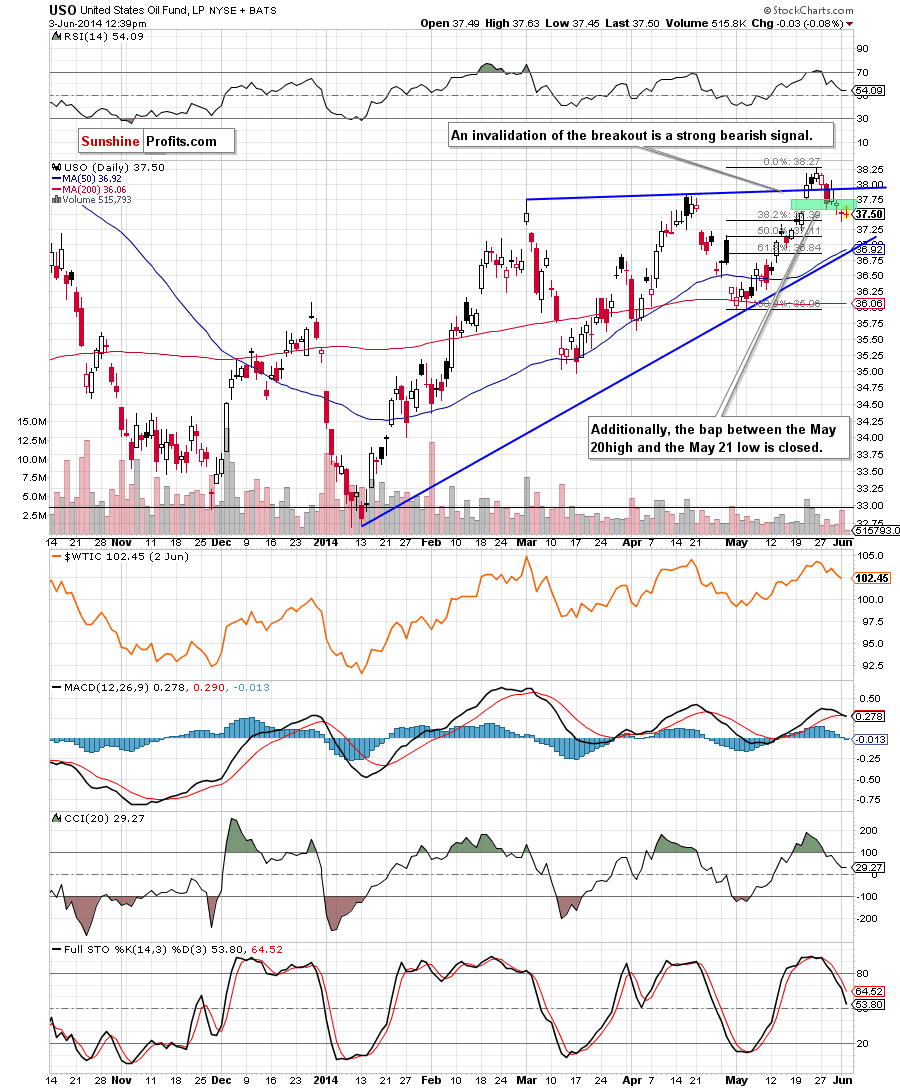
On the above chart, we see that the recent downward move in the ETF resulted in a drop below the bullish gap (marked with green), which is not a positive sign. Additionally, all indicators generated sell signals, which favors oil bears at the moment, suggesting further deteriration.
Connecting the dots, from the medium- and short-term perspective the situation in the ETF has deteriorated significantly, indicating that lower values of crude oil are only a matter of time.
Oil Stocks – Stocks Link
As we have pointed out before, let’s examine the relation between the XOI and the S&P500.
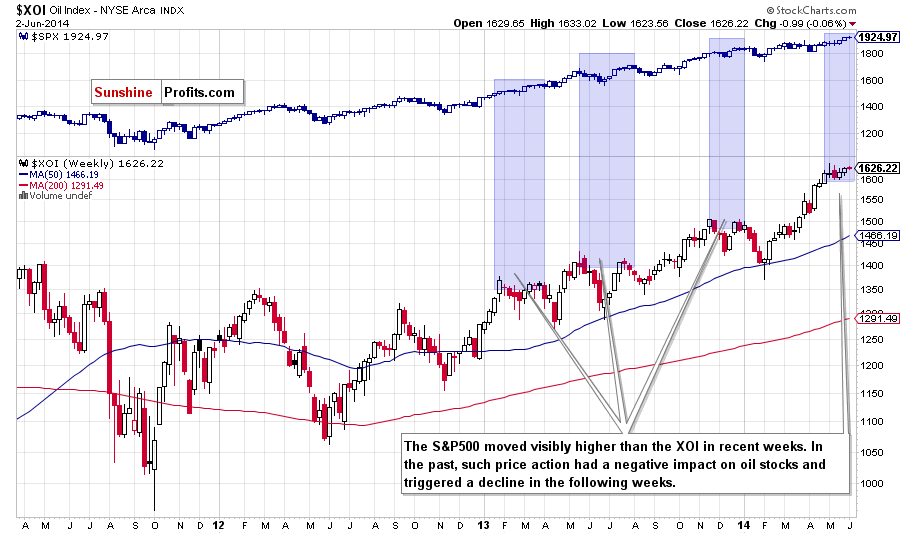
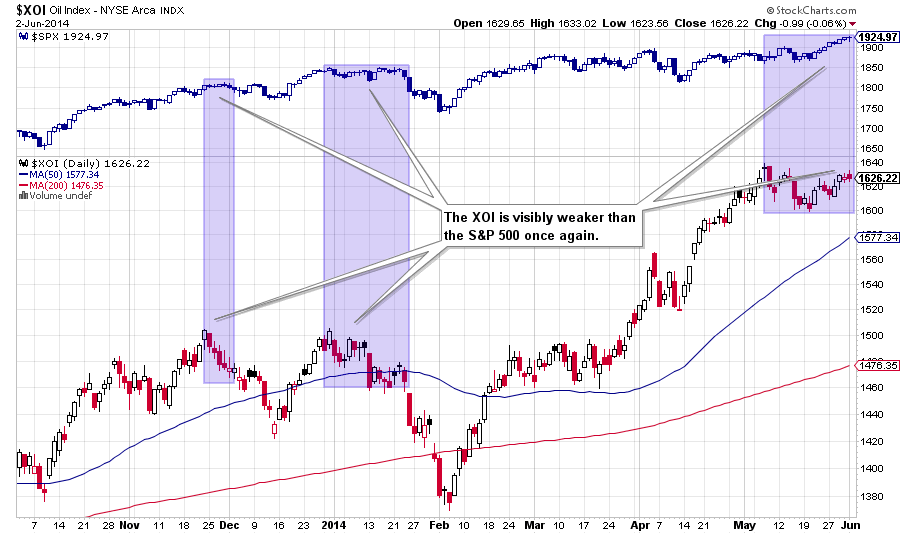
From both, the weekly and daily perspective, we see that oil stocks are visibly weaker once again. As you see on the above chart, we noticed similar price actions in the past. In earlier cases, such negative divergence had a negative impact on the XOI and trigered a decline in the following weeks. Therefore, we think that if history repeats itself once again, we’ll see further deterioration in the oil stocks index and the re-test of the strength of the key level of 1,600 in the following week (or weeks).
Scenarios
Just like a month ago, today’s Oil Investment Update includes scenarios of what could happen in the coming weeks. Naturally, we will continue to monitor the market in the coming days and if anything invalidates our long-term outlook we will send you an additional message.
- Bullish scenario
If the black medium-term declining line (marked on the daily chart) withstand the selling pressure, we’ll see a rebound from here, which will likely trigger further improvement and a comeback to the blue medium-term line (the upper border of the triangle) around $105. If this area is broken, we may see an increase even to around $107.50, where the long-term declining line (based on the 2008 and 2013 highs) is. - Bearish scenario
If the above-mentioned support line is broken, we will see further deterioration not only to the 50-day moving average, but also test the strength of the 200-day moving average, which currently is slightly above the psychological barrier of $100 and the lower border of the medium-term triangle. If oil bulls fail in this area, the net downside target will be the March low of $97.37 is. However, when we take into account a triangle pattern from the previous months, a correction may be deeper and take light crude to around $94.20, where the 78.6% Fibonacci retracement based on the entire Jan.-March rally is.
Summary
Although the long-term picture of crude oil is unclear and doesn’t have a meaningful impact on the medium-term moves, the black medium-term declining line (marked on the daily chart) in combination with the 38.2% Fibonacci retracement (based on the May rally) creates the key support area at the moment. In our opinion, a rebound (or a breakdown) from here will trigger another sizable move.
So where will the commodity head next? The current situation in oil-stocks-to-oil ratio, suggests that further improvement in the ratio, will trigger lower values of crude oil. Although the space for further growth in the ratio may be limited by the May high (which corresponds to the May low in the case of light crude), it seems that crude oil will test the strength of the psychological barrier of $100 in the coming week (or weeks). This scenario will be even more likely if the oil-to-oil-stocks ratio declines below the lower border of the consolidation. Additionally, as we have pointed out before, discussing the short-term picture, there is another negative divergence between the ratio and crude oil, which suggests that we may see a significant decline in the commodity (similarly to what we saw in all earlier cases in the past).
And speaking of negative divergences… We could also see them in the case of the WTIC:UDN ratio and the USO ETF. On top of that, in both cases we noticed an invalidation of the breakout above the previous highs, which is a strong bearish signal. Taking into account the fact that crude oil has been visibly weaker than the ratio and the ETF recently, if we see further deterioration in these cases, it seems to us that crude oil will do the same (or even decline faster).
Connecting the dots, we remain bearish on crude oil and believe that further deterioration is just around the corner.
Very short-term outlook: bearish
Short-term outlook: bearish
MT outlook: mixed
LT outlook: mixed
Trading position (short-term; our opinion): If one wants to hold your long position for months, it doesn't seem that the current move lower needs to be really concerning - even if oil drops to $94 or so. In other cases, it seems to us that waiting on the sidelines until the situation becomes clearer is a good idea (which is also our preferred approach at this time).
This completes this month’s Oil Investment Update. Our next Oil Investment Update is scheduled for Tuesday, July 3, 2014. Oil Trading Alerts subscribers will additionally receive similar but shorter alerts on a daily basis (or more than once a day when the situation requires it). You – Oil Investment Updates subscribers – will receive short Investment Alert messages should the outlook for the medium or long term change before the next Update is posted.
Thank you.
Nadia Simmons
Forex & Oil Trading Strategist
Oil Investment Updates
Oil Trading Alerts

