
Looking at the current price level of crude oil, we can summarize the previous month in one simple sentence: return to the starting point. The beginning of April was very promising. At that time, oil bulls started their charge using technical and fundamental factors, which resulted in a 2-week rally and a 6-week high of $104.99. Despite this improvement, they lost their steam in the second half of the month, which fueled a selling pressure and triggered declines. As a result, the commodity dropped below the key level of $100 and we noticed significant technical changes in the short-term picture of light crude.
The first half of April was profitable for those who had previously opened speculative long positions in crude oil. We saw a sharp rally which pushed the commodity up to a 6-week high of $104.99. At that time, the price of light crude was supported not by technical factors (such as breakout above the 200-day moving average or comeback above the psychological barrier of $100), but also by fundamental factors.
From today’s point of view, it seems that there were three major fundamental factors that have affected the price mostly: tensions between Russia and Ukraine (and also sanctions imposed on Russia), doubts over the oil export from Libya and domestic crude oil inventories.
In recent weeks, investors were paying close attention to events in Ukraine. The price of light crude was supported by rising tensions between Russia and Ukraine as fears that the instability in the country will escalate and disrupt Russian oil exports (as a reminder, Russia is the world's second-largest exporter). However, as it turned out in the following days, although the U.S. and the European Union imposed new sanctions on 15 Russian and Ukrainian individuals, they disappointed market participants as were less aggressive than expected. Additionally, major players in the oil market escaped sanctions and the potential for disruption appeared limited. In reaction to this news, crude oil extended losses. Additionally, earlier today, Russian President Vladimir took steps to diffuse the crisis in neighboring Ukraine. Concerns that Ukraine will descend into civil war eased after President Putin called on separatists in the eastern reaches of the country to postpone their referendum on independence, and added that Russia had withdrawn its forces from the border. Putin stressed that Russia will do "all it can" to resolve the crisis and will take a "most positive" approach to international peace efforts. Will crude oil move higher without disturbing news from Ukraine? We’ll probably find out in the following weeks.
As mentioned earlier, another factor that has triggered upswings and downswings in crude oil was the situation in Libya. As a reminder, protestors have blocked oil export terminals in Eastern Libya since last summer. However, some Libyan oil production has restarted in recent months only to be halted again amid renewed unrest. Therefore, when the Libyan government and rebels reached an agreement to reopen two blocked oil ports, which together normally export 200,000 barrels of crude oil a day (most of it to Europe), the price of light crude declined. Nevertheless, the commodity fluctuated between gains and losses in the following days as oil investors wondered whether the deal would succeed. From today’s point of view, we can summarize the situation in one simple conclusion: every time when hopes that oil ports may begin shipments rise, the price of light crude moves lower and when they fade, we see increases.
Of course, as always (or at least, as in most of the earlier cases) better-than-expected U.S. (or Chinese) economic data have had a positive impact on the price of crude oil, while disappointing numbers have pushed the commodity lower. At this point, some of you (oil investors) may ask a question: why Chinese data should be important to me? Well, the answer is very simple: China is the world's second-largest crude consumer behind the U.S. Therefore, disappointing data from this country usually weights on investors’ sentiment and push the commodity lower. For example, last Chinese manufacturing report (released on Monday) outweighed better-than-expected U.S. service sector data. HSBC's manufacturing PMI missed expectations, underlining concerns that an economic slowdown in the world’s second-largest economy is deepening. In reaction to this news, crude oil erased earlier gains and came back below $100.
Finishing this part of Oil Investment Update, we would draw your attention to the U.S. crude oil inventories. In our previous publication, we wrote the following:
(…) a sharp increase in crude oil inventories has helped send the price of light crude lower for three consecutive months at the end of last year (…). If we see another build in domestic supplies, it may fuel concerns that the market may be adequately supplied and had a negative impact on the price.
As it turned out in April, the Energy Information Administration showed in its weekly report that U.S. crude oil inventories rose by 10.01 million barrels in the week ended April 11 (well above expectations for a build of 2.25 million barrels) and it was the biggest one-week build in crude oil supplies in 13 years. In the following week, the EIA showed another build (by 3.52 million barrels in the week ended April 18), which resulted in an increase to the highest level since May 1931. At the beginning of May, the weekly report showed that crude oil inventories increased once again (by 3.52 million barrels) and hit an all-time high of 399.4 million barrels. In reaction to these strong bearish reports, the price of crude oil has falling steadily since mid-April and finally dropped to the levels that we saw at the beginning of the previous month.
What’s interesting, earlier today, the EIA said in its weekly report that U.S. crude oil inventories declined by 1.8 million barrels in the week ended May 2, defying expectations for an increase of 1.4 million barrels. From today’s point of view, it’s too early to predict that this drop will launch a series of declines in crude stockpiles or is just a one-week aberration. Therefore, we still should keep en aye on the EIA weekly reports.
Crude Oil
Once we know the major fundamental factors that affected the price of crude oil, let’s move on to the technical part of this month‘s Oil Investment Update and take a look at the charts from different time horizons to have a more complete picture of the current situation in the oil market.
Let’s start with a look at the monthly chart of light crude (charts courtesy by http://stockcharts.com).
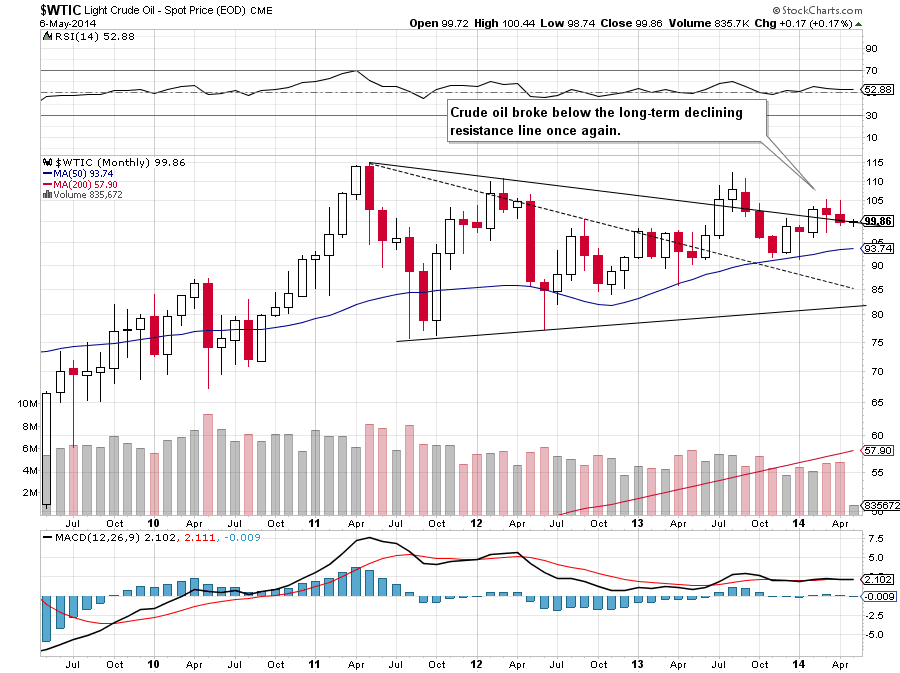
On the above chart, we see that although crude oil moved little higher earlier this month, the price reversed and dropped below the long-term declining resistance line once again. Taking this fact into account, it seems that if light crude extends losses, we may see a drop even to the March low of $97.37. Please note that declines that we saw in March and April materialized on relative high volume, which confirms the strength of the sellers and suggests that further deterioration is likely to be seen.
Now, let’s zoom in on our picture of the oil market and see the weekly chart.
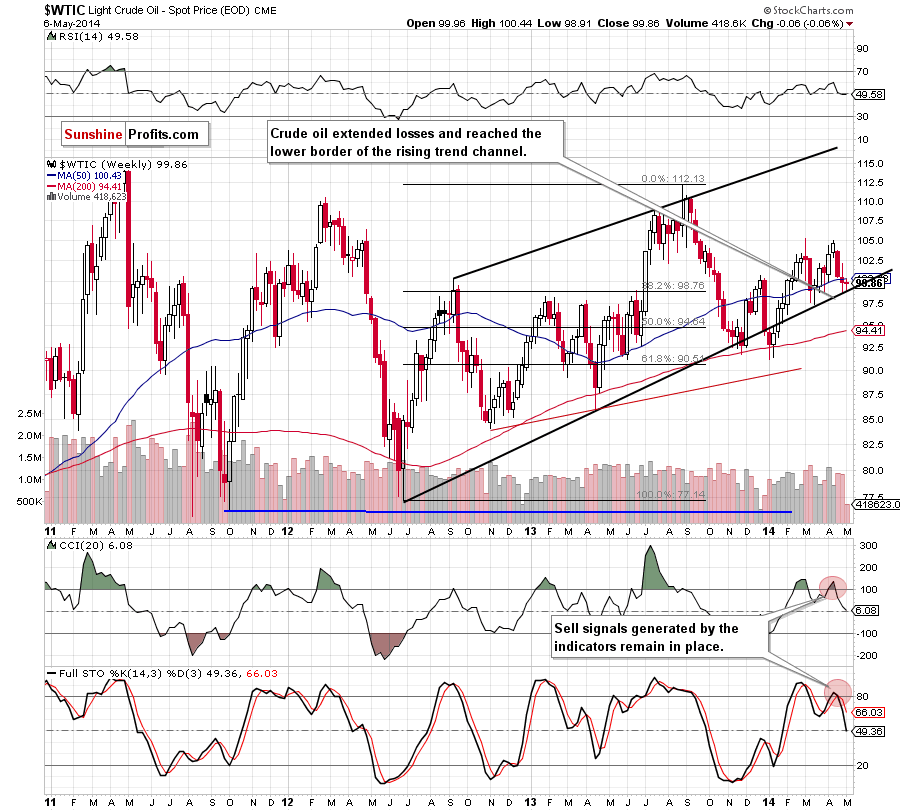
From this perspective, we see that crude oil reversed in the mid-April and declined in the following weeks below the 50-week moving average, reaching the lower border of the rising trend channel in the previous week. Although we noticed a small rebound earlier this week, light crude gave up the gains and still remains between the major support and the 50-week moving average, which serves as the nearest resistance . If history repeats itself and the lower line of the trend channel holds, we may see an upward move in the coming weeks (similar to the March-April rally) and the upside target would be around $105. However, if this area is broken, we will see further deterioration and the initial downside target will be the March low of $97.37. If the commodity drops under this support level, the next stop may be the 200-week moving average (currently at $94.41). Please note that sell signals generated by the indicators remain in place, supporting the bearish case.
Now, let’s check the short-term outlook.
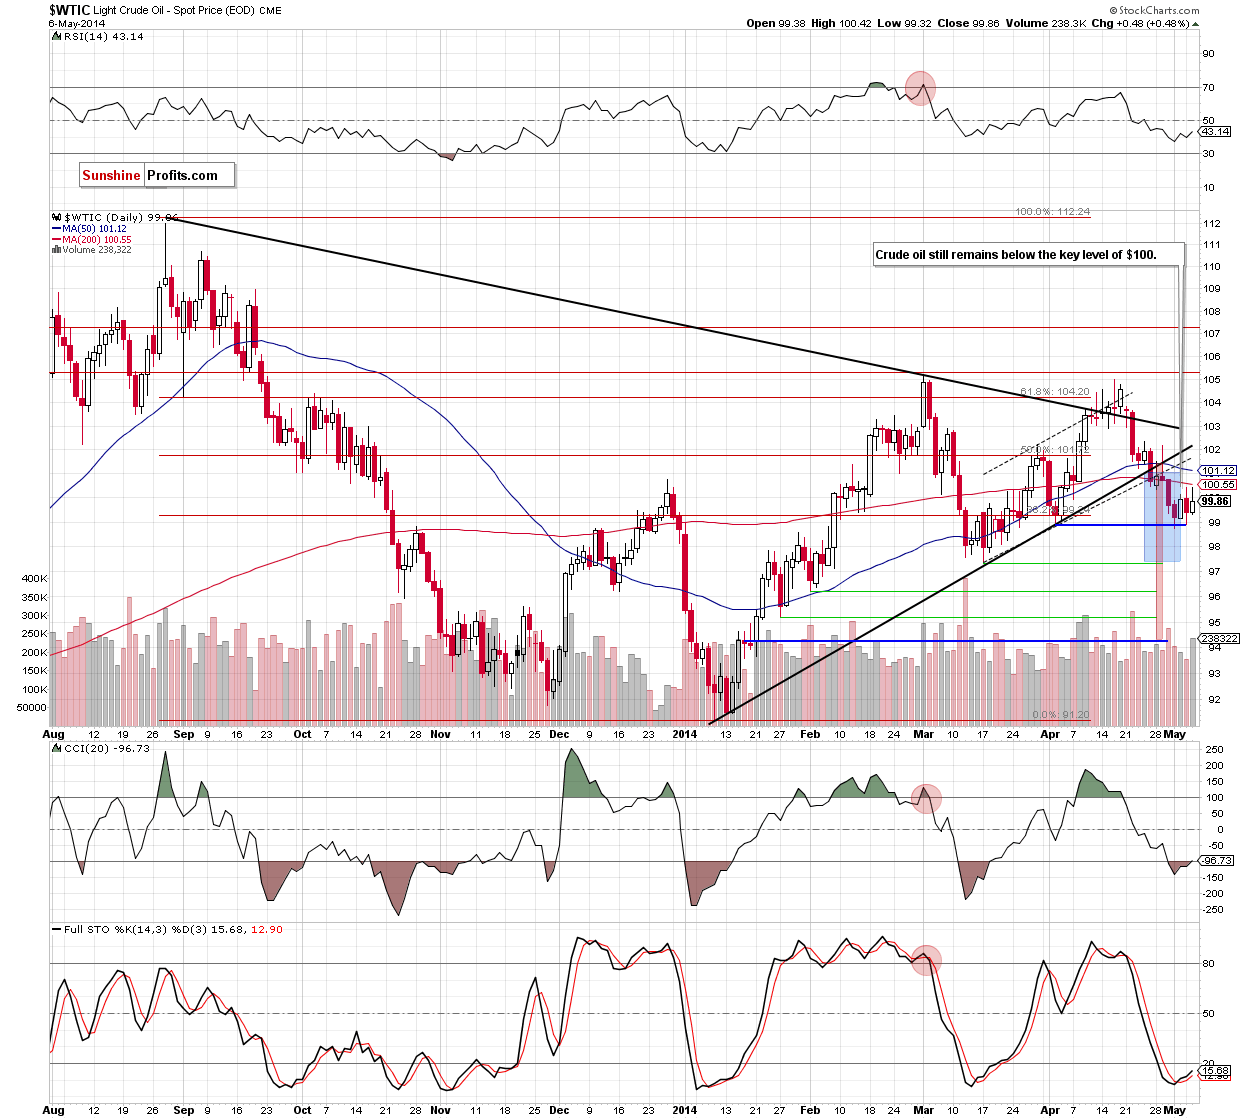
From the short-term perspective, we see that the situation has deteriorated significantly as crude oil invalidated the breakout above the medium-term black resistance line. This bearish signal triggered further declines, which took light crude below the 50- and 200-day moving averages, the medium-term support line (marked with black), the lower border of the rising trend channel (marked with dashed black lines) and the psychological barrier of $100 in the following days. In the previous week, the breakdown below these important levels was confirmed, which is an additional bearish factor that suggests further deterioration. Where crude oil could drop?
Taking into account the breakdown under the lower border of the trend channel, declines may push the price to around $97, where the size of the downswing will correspond to the height of the formation. Nevertheless, in our opinion, the confirmation of the breakdown below the medium-term line is more important because it suggests an even bigger move. As you see on the above chart, both medium-term black lines created a triangle pattern in the previous months. Therefore, a drop below the lower border of this formation is a strong negative signal, which may trigger a deeper correction and take light crude to around $94.20. At this point, it’s worth noting that the first downside target is supported by the March low of $97.37 and the latter corresponds to the 78.6% Fibonacci retracement based on the entire Jan.-March rally.
In recent trading days, light crude fell twice to the bottom of the correction that we saw at the turn of March and April, which triggered corrective upswings to the previously-broken 200-day moving average (currently at $100.55). As you see on the above chart, they failed and the commodity still remains below the psychological barrier of $100.
Summing up looking at the above charts, we see that the situation from the long-, medium- and short-term perspective has deteriorated as light crude reversed in the mid-April and dropped to the levels that we saw a month ago. With this downward move, light crude declined below the long-term declining resistance line, the medium-term support line (which is also the lower border of the triangle marked on the daily chart), very important moving averages and also under the key level of $100. All these negative factors still remain in place and support the bearish case. Therefore, in our opinion, as long as there in no invalidation of the breakdown below these lines, further deterioration in the coming days (or even weeks) is likely.
Having discussed the current outlook for crude oil, let’s examine the NYSE Arca Oil Index (XOI) to find out what the current outlook for oil stocks is.
Oil Stocks
Let’s begin with the long-term chart.
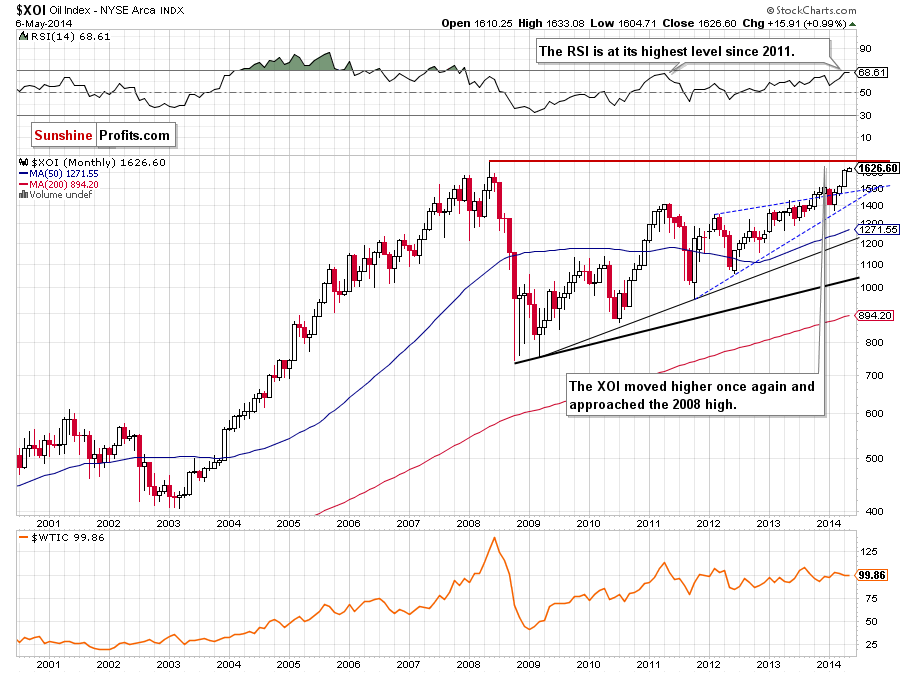
From this perspective, we see that the situation has improved significantly as the XOI extended gains and successfully broke above the psychological barrier of 1,600 in the previous month. This strong bullish signal triggered further improvement and the oil stock index climbed above 1,630 yesterday. Although the RSI is at its highest level since 2011, the indicator is not overbought, which suggests that we may see a continuation of the rally in the near future and the upside target will be the 2008 high of 1,663.
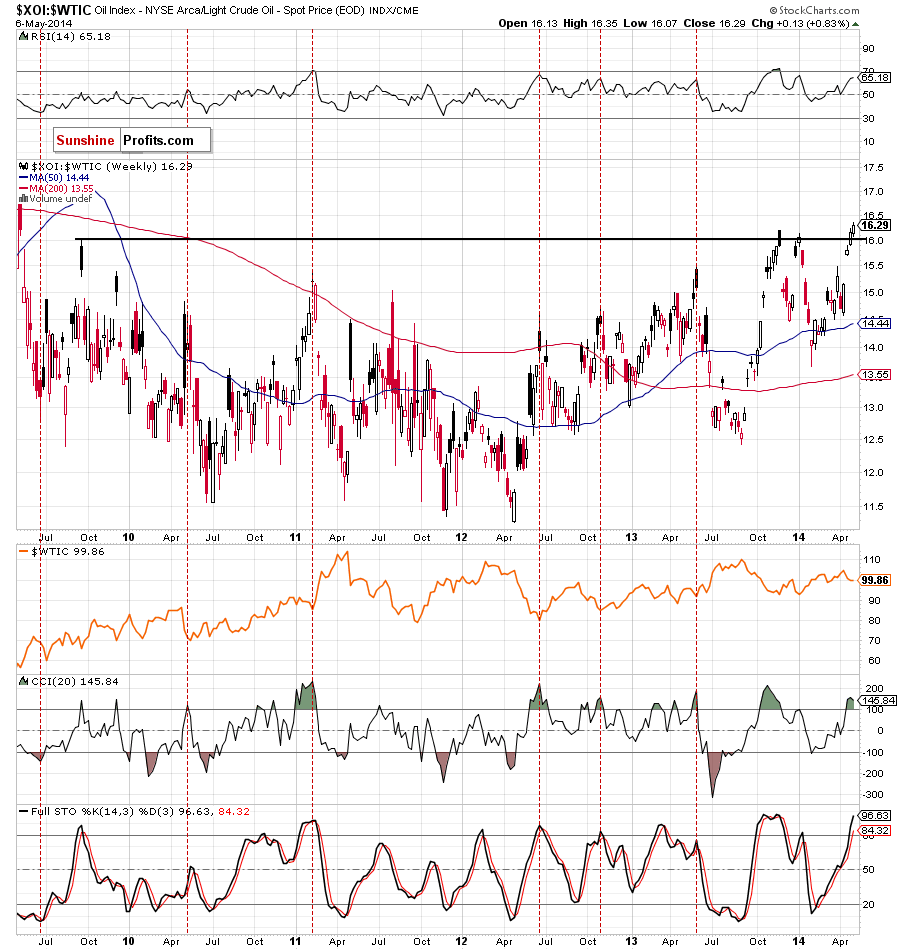
To see the current situation more clearly, let’s zoom in on our picture and move on to the weekly chart.
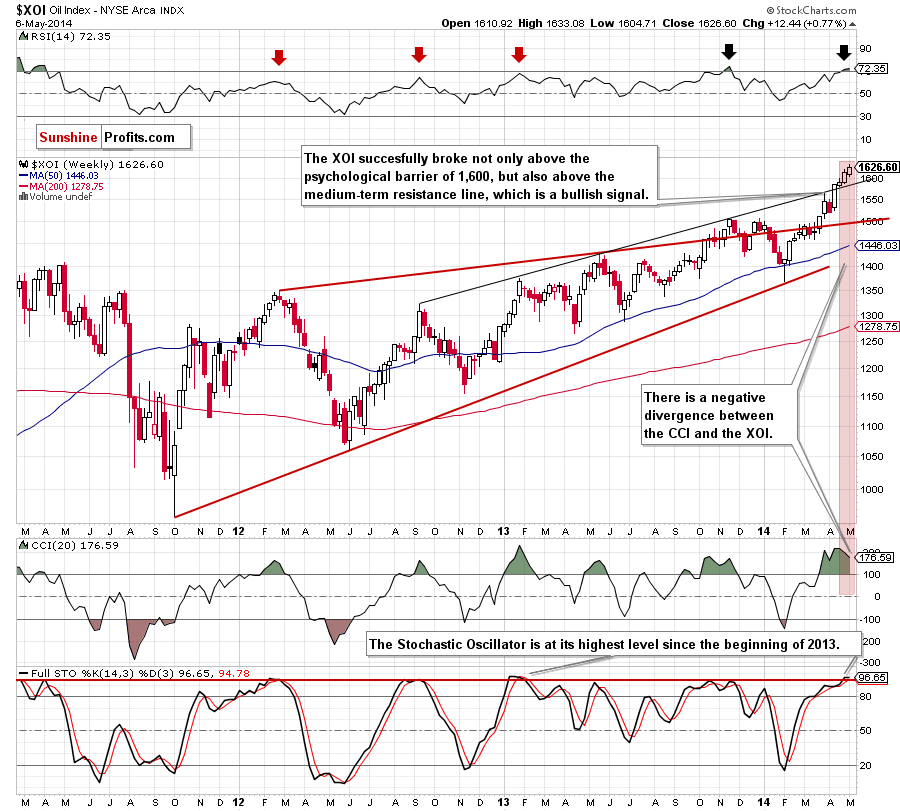
As you see on the above chart, the XOI successfully broke not only above the March high, but also the medium-term resistance line (based on the Sept. 2012, Jan. 2013 and May 2013 highs) in the recent weeks. This strong bullish signal encouraged oil investors to push the buy button, which resulted in an increase above the next psychological barrier of 1,600. The breakout fueled further improvement and the XOI hit a fresh 2014 high of 1,633 yesterday. From this perspective, we don’t see any important technical resistance levels that could stop rally in the near future. However, when we take a closer look at the position of the indicators, the situation is not as bullish as it seems at the first glance. As you see on the weekly chart, there is a negative divergence between the CCI and the XOI, which is the first bearish signal. Additionally, the Stochastic Oscillator is at its highest level since the beginning of 2013, while the RSI broke above the level of 70. Please note that similar circumstances predicted the trend reversal in the previous years (for example, in Sept. 2012, Jan. 2013 and also in Nov. 2013). Therefore, we think that if history repeat itself once again, we will likely see a correction in the coming week (or weeks).
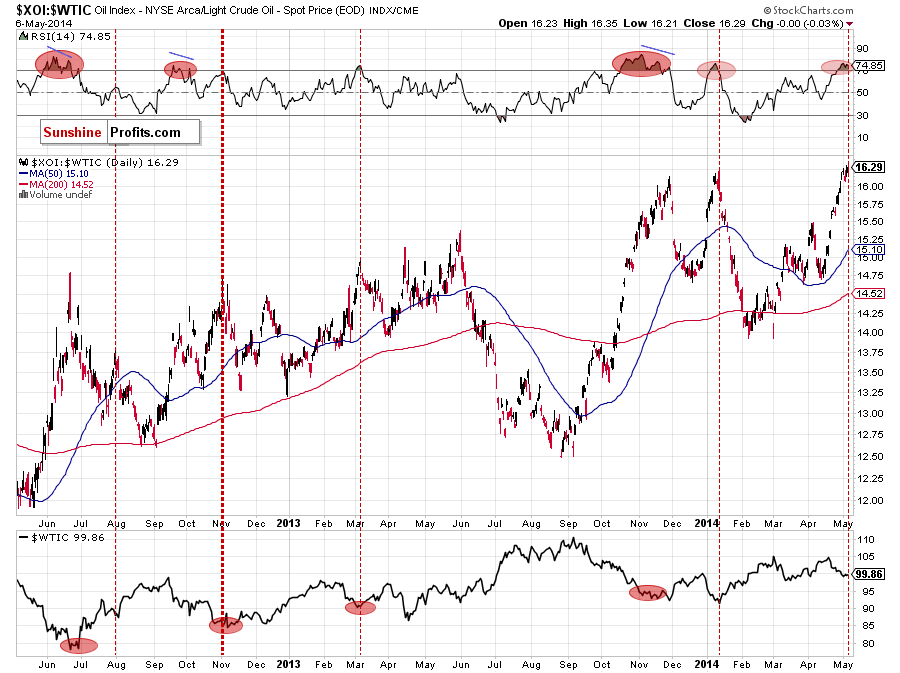
Having discussed the medium-term outlook, let’s turn to the daily chart.
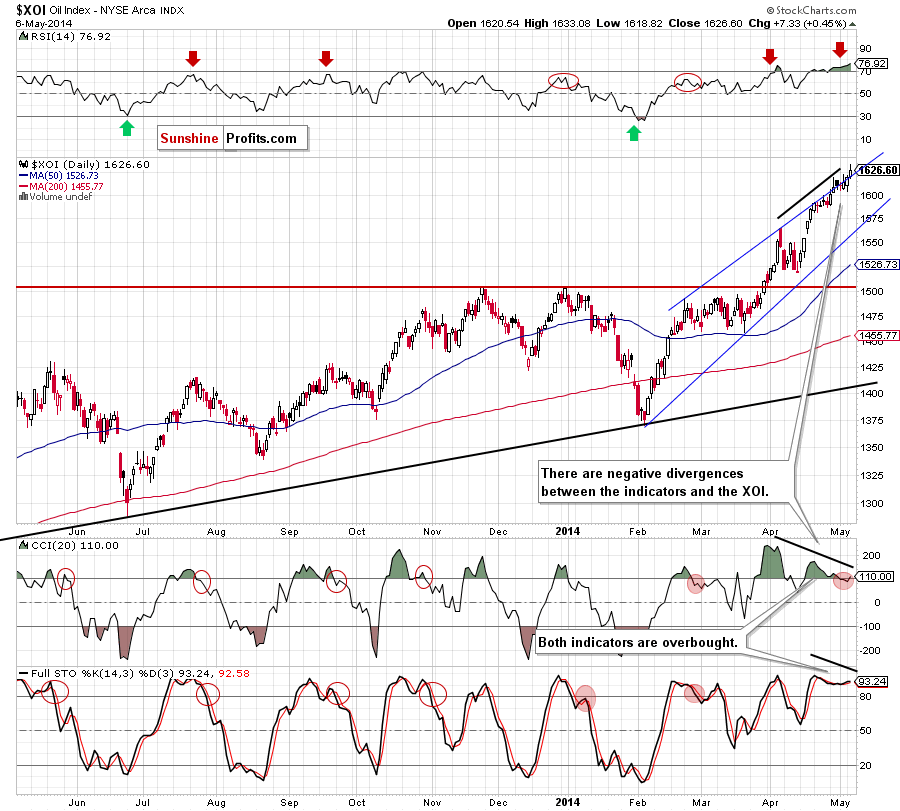
As we mentioned earlier, the XOI extended gains and successfully broke above the psychological barrier of 1,600, hitting a fresh 2014 high at the end of April. From this perspective, we see that with this upward move, the oil stock index reached the upper line of the rising trend channel, which decelerated further improvement at the beginning of May. As you see on the daily chart, all attempts to move higher failed in the recent days. However, despite these failures, the XOI bounced off this major resistance and climbed to a new annual high of 1,633 yesterday. This is a strong bullish signal and if the breakout is not invalidated, we may see an increase to the 2008 high in the coming days.
Despite all these bullish circumstances, we should take a closer look at the current position of the indicators. From this perspective, we see that the RSI climbed to its highest level since the beginning of the previous month. Back then, even lower value of the indicator triggered a correction in the XOI (please note that we saw similar situations in October, November and also in December ). Additionally, the CCI and Stochastic Oscillator are overbought, which suggests that a correction is just around the corner. Nevertheless, as long as there are no sell signals, further improvement is likely to be seen.
Summing up, from the long-, medium- and short-term perspectives, the situation has improved significantly as the oil stock index broke above the psychological barrier of 1,600 and the upper border of the rising trend channel marked on the daily chart. From the technical point of view, there are no important resistance levels below the final upside target – the 2008 high. Despite these bullish circumstances, please keep in mind that the position of the medium- and short-term indicators suggests that correction is just around the corner, which should raise the attention of oil stocks holders.
Crude Oil - Oil Stocks Link
Having discussed the current situation in crude oil and the oil stock index, let’s comment on the relationship between them.
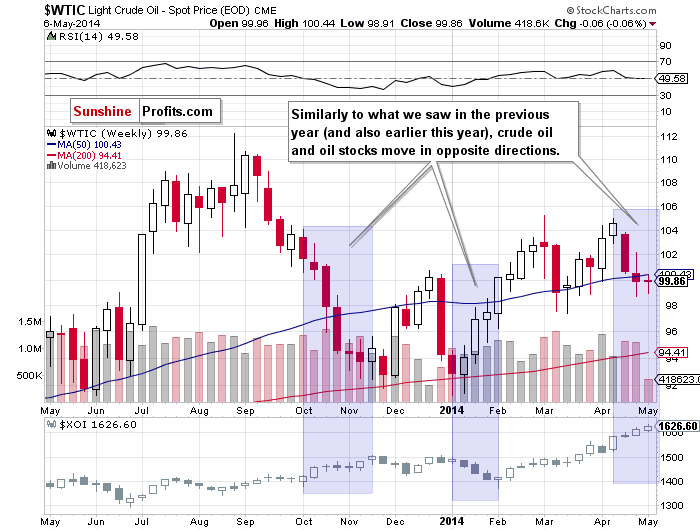
When we take a look at the above chart and compare the price action in both cases, we see that a negative correlation between crude oil and oil stocks came back in the previous month. In mid-April crude oil reversed and declined in the following weeks to the levels that we saw a month ago. Meanwhile, the XOI not only broke above the psychological barrier of 1,600, but also hit a fresh 2014 high. Additionally, yesterday, oil stocks broke above the upper line of the rising trend channel (marked on the daily chart), while the entire strength (or rather the lack of it) that crude oil showed is another failed attempt to return above the key level of $100. Connecting the dots, we clearly see that oil stocks have been visibly stronger compared to crude oil in the previous weeks and still have a better upside potential. However, thanks to this negative relation between light crude and the XOI, we can infer interesting clues from the analysis of the ratio.
Ratio Analysis
Let’s start this section by focusing on the oil-stocks-to-oil ratio from the monthly perspective. What impact could it have on future oil moves?
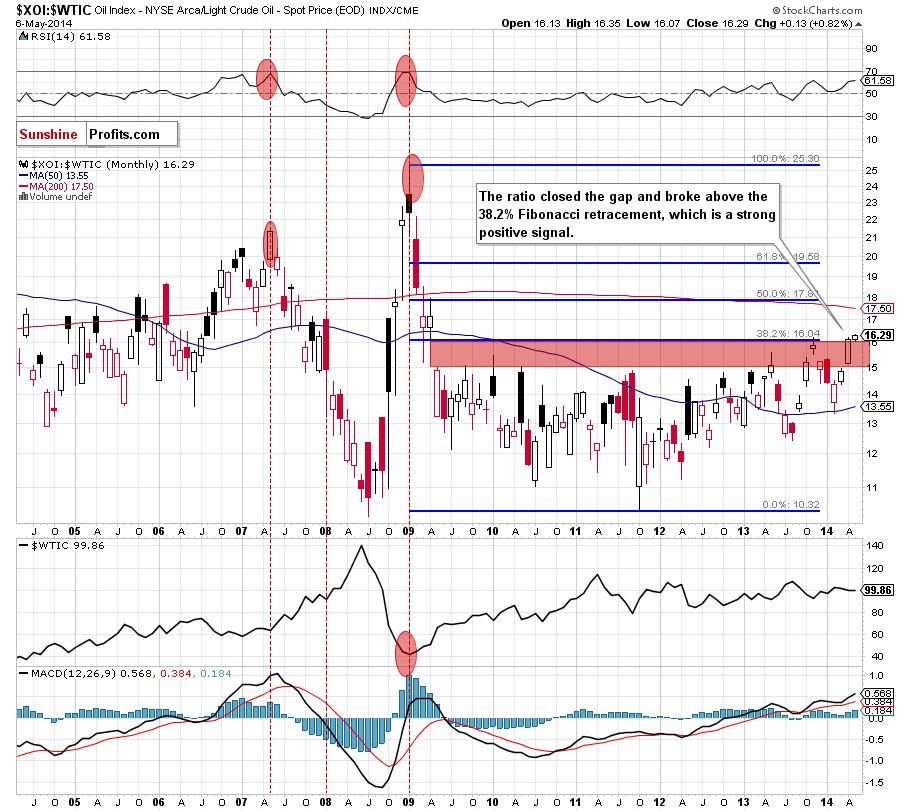
The first thing that catches the eye on the above chart is a successful breakout above the strong resistance zone created by the red gap and the 38.2% Fibonacci retracement. This is a strong bullish signal that suggests further improvement in the ratio – especially when we factor in the fact that the RSI is not overbought. From this perspective, we see that there is still much room for further growth as the next Fibonacci retracement and the 200-month moving average are quite far (currently around 17.50-17.80).
What does this improvement mean for crude oil? Taking into account the fact that the negative correlation between WTIC and the XOI came back in the previous weeks, we think that higher values of the ratio will likely trigger lower values of crude oil.
Is the medium-term picture also so bearish for crude oil?
Technically, yes. However, from this perspective, we may see a pause earlier - around 16.86, where the 127.2% Fibonacci extension (based on the Nov. high and Feb. low) is. Additionally, the CCI and Stochastic Oscillator are overbought, which suggests that if they generate sell signals and the ratio reverses, we will likely see a bottom of the current correction in crude oil (based on the similar situation from the past).
And what is the short-term picture of the ratio?
From this point of view, we see that the RSI is overbought, which suggests that a pause or pullback is just around the corner. As you see on the above chart, similar levels of the indicator predicted the ratio’s reversals in the past. However, in our opinion, as long as there is no sell signal, further improvement in the ratio (and deterioration in light crude) is likely to be seen.
From the long- and medium-term the situation in the ratio has improved significantly in the recent weeks, which triggered a correction in light crude. If this tendency continues and the ratio extends its rally, we will likely see further deterioration in crude oil (despite the fact that we may see a pause or corrective upswing in the near future).
Having discuss the current situation in the ratio based on crude oil and oil stocks, let’s take a look at the oil-to-gold ratio.
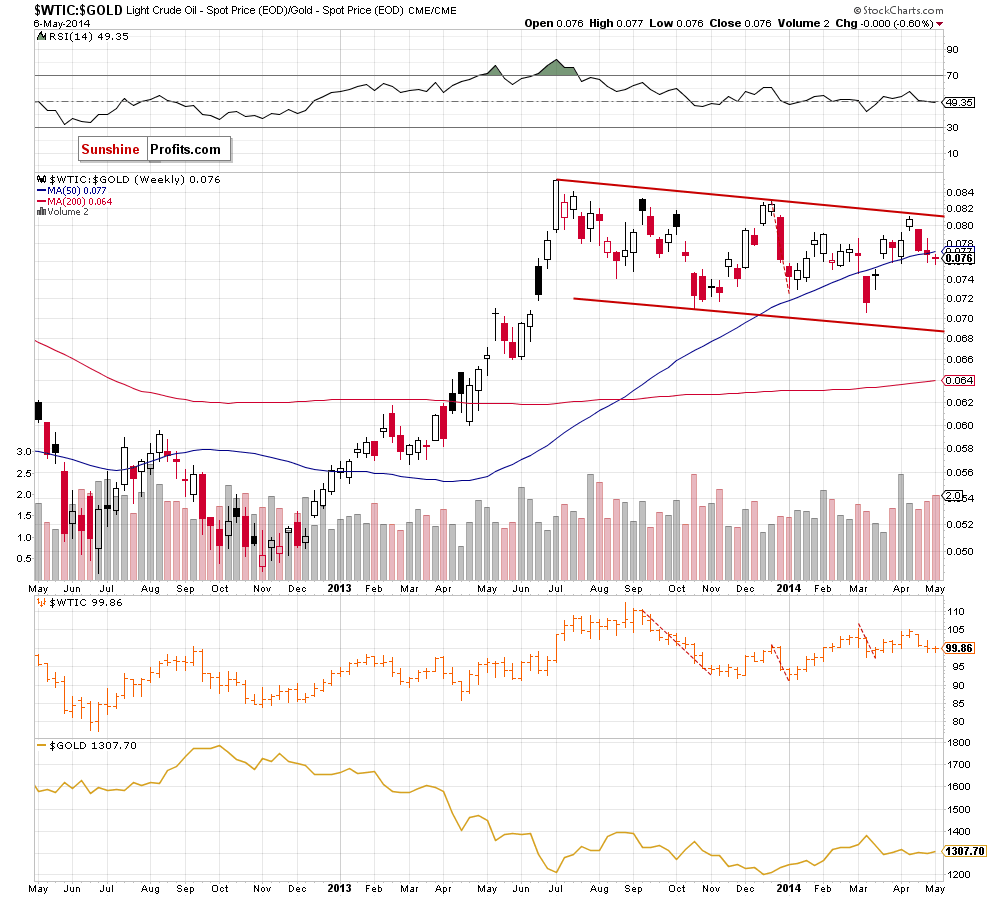
Looking at the above chart, we see that the ratio reversed after an approach to the upper line of the declining trend channel. The proximity to this resistance line triggered a downward move that took the ratio below the 50-week moving average. At this point, it’s worth noting that the previous fall below this line brougt furter deterioratin and a drop to the March low. Taking this fact into account, it seems to us that as long as the ratio remains under this moving average, similar price action in the coming week (or weeks) can’t be ruled out – especially when we factor in rising volme during recent declines.
What impact could these circumstances have on the price of light crude? As you see on the above chart, the correction that we saw in the catio corresponds to the downward move in crude oil. Therefore, in our opinion, if the ratio declines once again, we will likely also wee lower values of the commodity.
Before we move on to the next chart, let’s take a look at the ratio from the daily perspective.
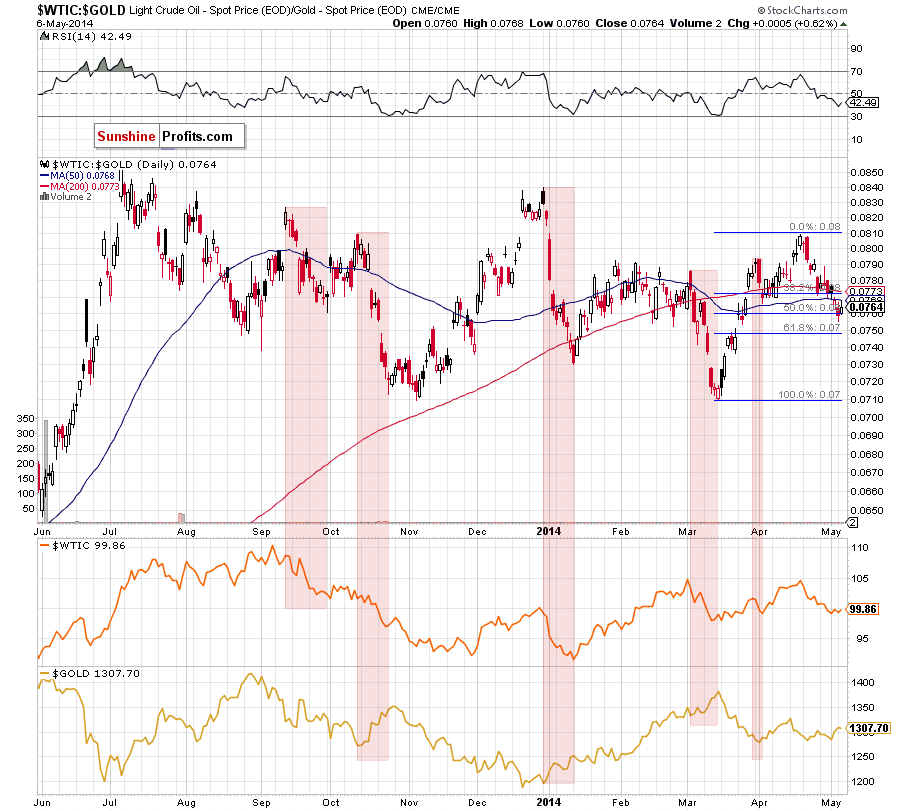
Looking at the above chart, we see that an decreasing value of the ratio has triggered the lower price of crude oil in the past. We saw such price action in almost every month since July. Therefore, if the ratio declines once again, we may see further deterioration in light crude in the near future. Please note that the ratio declined below the 200-day moving average at the end of April, which was the first bearish sign. In the following days, we noticed further deterioration as the breakdown was confirmed and the ratio declined below the 50-day moving average (in case of this drop, the breakdown is also confirmed). Although the ratio rebounded slightly after a drop to the 50% Fibonacci retracement, it still remains below the previously-broken lines. In our opinion, this is a bearish sign, suggests that if the brekdown is not invalidated, we will likely see a drop to the 61.8% Fibonacci retracement. If this is the case, such price action will trigger further deterioration in crude oil.
Once we know, the situation in the ratios and its implications for crude oil, let’s take a look at the non-USD (WTIC:UDN ratio) chart of crude oil. As a reminder, UDN is the symbol for the PowerShares DB US Dollar Index Bearish Fund, which moves in the exact opposite direction to the USD Index. Since the USD Index is a weighted average of the dollar's exchange rates with world's most important currencies, the WTIC:UDN ratio displays the value of crude oil priced in "other currencies".
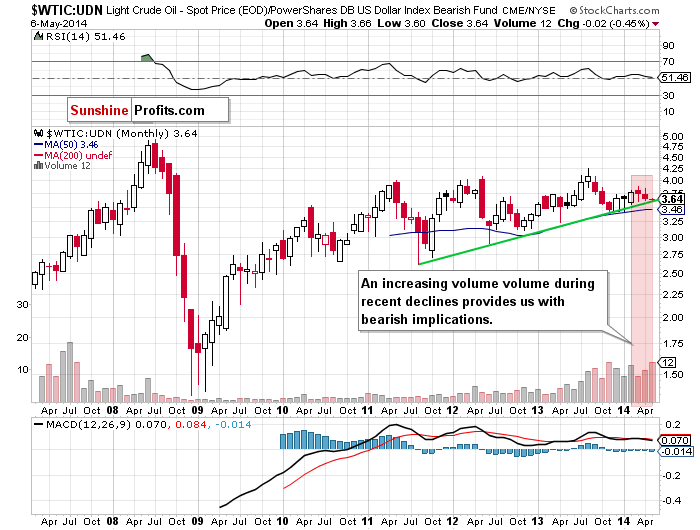
As you see on the above chart, although crude oil extended losses, it still remains above the green support line. If it holds, we may see a corrective upswing in the coming month (or months). However, if it is broken, we will likely see a bigger correction and the downside target will be the 50-month moving average (currently at 3.46). Nevertheless, looking at a huge increase in volume during the recent declines (which confirms the strength of the sellers), we think that the breakdown (or at least pullback to the downside target) is more likely.
To have a more complete picture of the current situation, let’s take a look at the weekly chart.
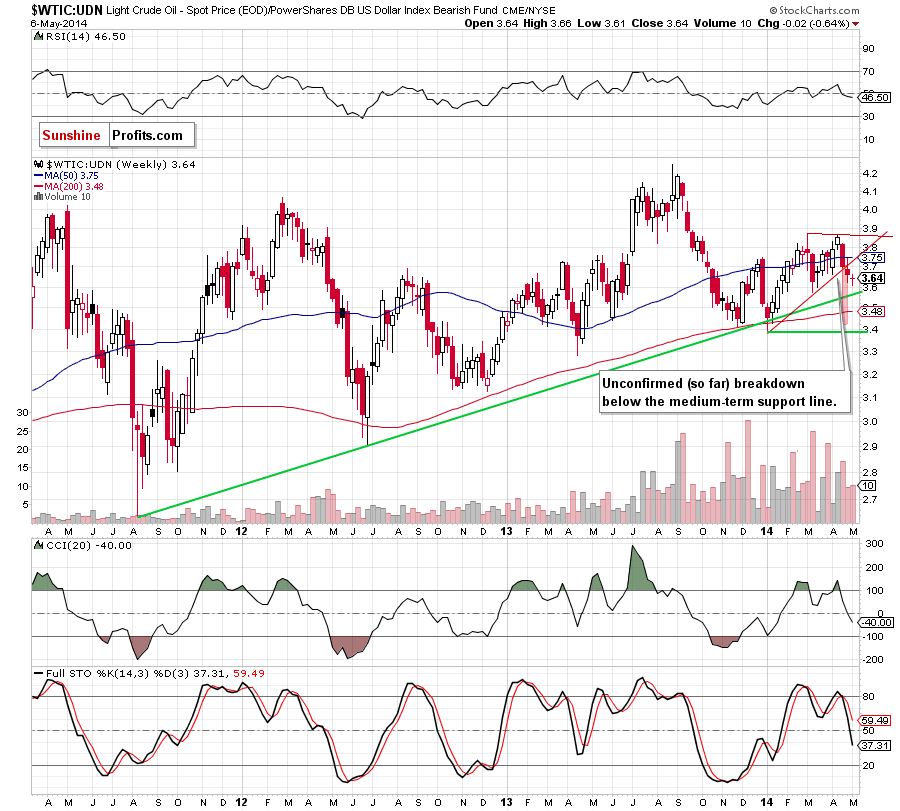
From this perspective, we see that crude oil still has space for further declines (before the commodity will reach the above-mentioned major support green line). When we take a closer look at the above chart, we see that crude oil broke below the medium-term support line based on the recent lows, which is also the lower border of the triangle. Similarly to what we wrote in the case of WTIC, this is a bearish signal that suggests that we may see a drop not only below the long-term support line, but also under the 200-week moving average. If this is the case, this correction will likely take the WTIC:UDN ratio to slightly above the 2014 low.
Please note that the ratio dropped below the bottom of the correction that we saw at the turn of March and April, which suggests that the price of light crude may also decline under this short-term support in the coming week (or weeks).
Scenarios
Just like a month ago, today’s Oil Investment Update includes scenarios of what could happen in the coming weeks. Naturally, we will continue to monitor the market in the coming days and if anything invalidates our long-term outlook we will send you an additional message.
- Bullish scenario
If the lower border of the rising trend channel (marked on the weekly chart) in combination with the bottom of the correction that we saw at the turn of March and April holds, we will likely see another upward move in the coming weeks. If this is the case, the first upside target will be around $105. - Bearish scenario
If the above-mentioned support zone is broken, we will see further deterioration. As mentioned earlier, the first downside target will be around $97, where the size of the downswing will correspond to the height of the short-term rising trend channel (marked on the daily chart) and the March low of $97.37 is. However, when we take into account a triangle pattern from the previous months, a correction may be deeper and take light crude to around $94.20, where the 78.6% Fibonacci retracement based on the entire Jan.-March rally is.
Summary
From the long-, medium- and short-term perspective the situation has deteriorated as light crude reversed in the mid-April and dropped below the long-term declining resistance line, the medium-term support line (the lower border of the triangle marked on the daily chart), very important moving averages and also under the key level of $100. As mentioned earlier, the recent attempts to move higher failed and all bearish factors remain in place.
Taking these facts into account, and combining them with the comeback of the negative correlation between crude oil and oil stocks , we think that if the oil-stocks-to-oil ratio extends gains, we will likely see further deterioration in crude oil. Additionally, if the oil-to-gold ratio doesn’t invalidate the breakdown below the 50- and 200-day moving averages, we may see another downswing, which will likely have a negative impact on light crude. Therefore, we remain bearish in the short term and sustain our assumption that as long as there in no invalidation of the breakdown below the previously-broken important lines, further deterioration in the coming days (or even weeks) is likely.
Very short-term outlook: bearish
Short-term outlook: bearish
MT outlook: mixed
LT outlook: mixed
Trading position (our opinion): If one wants to hold your long position for months, it doesn't seem that the current move lower needs to be really concerning - even if oil drops to $94 or so. In other cases, it seems to us that waiting on the sidelines until the situation becomes clearer is a good idea (which is also our preferred approach at this time).
This completes this week’s Oil Investment Update. Our next Oil Investment Update is scheduled for Tuesday, June 3, 2014. Oil Trading Alerts subscribers will additionally receive similar but shorter alerts on a daily basis (or more than once a day when the situation requires it). You – Oil Investment Updates subscribers – will receive short Investment Alert messages should the outlook for the medium or long term change before the next Update is posted.
Thank you.
Nadia Simmons
Forex & Oil Trading Strategist
Oil Investment Updates
Oil Trading Alerts

