
February was another good month for oil bulls. During that time, crude oil gained 5.44%, broke above the long-, medium and short-term resistance levels and climbed to its highest level since September, hitting a fresh 2014 high of $105.22. At the beginning of March, light crude gave up the gains and has declined sharply, which resulted in a drop below $100 per barrel.
The most important factors driving prices higher in recent weeks were: colder-than-normal temperatures, the better-than expected U.S. economic data, the shrinking inventories in Cushing, the weaker U.S. dollar, supply disruptions in Libya (and other countries) and, of course, the recent events in Eastern Europe.
Nevertheless, the key word here is "inventories". Although the price of light crude has been under strong selling pressure at the end of last year as U.S. inventories rose to its highest level since June, in recent weeks oil traders has been focusing more on distillate stockpiles.
At the end of January (and also in February), the price of light crude rose as colder-than-normal temperatures boosted expectations of strong demand for heating fuels refined from crude oil. An intense winter storms in the previous month across the East Coast and much of the northern U.S. resulted in a sharp drop in distillate inventories, which declined 22% below their usual level for this time of year. These circumstances had a positive impact on crude oil and encouraged buyers to push the price above $100 per barrel. At this point, it’s worth noting that updated weather forecasts at the end of the previous month showed that warmer temperatures could return in the first and second week of March (such circumstances would curb demand for heating oil), had a negative impact on light crude and sent the price lower.
Nevertheless, we can’t forget that every the U.S. Energy Information Administration weekly report, which shows a smaller-than-expected increase in U.S. crude oil inventories has a positive impact on the price. We saw such situation in the week ended Feb. 21, when crude inventories rose by 68,000 barrels, well below expectations for an increase of 1.24 million barrels. Although another increase in crude stockpiles was a bearish factor, it turned out that it was the smallest weekly increase since June, which suggested that demand for crude could be stronger than the market expected.
In our previous Oil Investment Update we wrote the following:
(…)better-than expected U.S. economic data have also supported the price of crude oil by fueling hopes for the U.S. economy to gain steam and demand more oil and energy than once anticipated. Therefore, it seems that we could see a similar investors’ reaction in the coming weeks – especially when we take into account the fact that we saw such situation in December.
As it turned out in the previous month, almost every time, when stronger-than-expected data were released, they had a positive impact on crude oil and fueled expectations that the U.S. economy will continue to recover and will demand more fuel and energy. For instance, crude oil moved higher after positive U.S. economic data from the Commerce Department, which reported recently that personal spending and personal income rose above expectations. The price of light crude was also supported by the data from the Institute for Supply Management, which reported that its manufacturing purchasing managers’ index rose to 53.2 last month from 51.3 in January (well above expectations for a reading of 52.0. In reaction to this, light crude extended gains and finally hit a fresh 2014 high.
Another strong bullish factor, which has helped to push the price of light crude higher was the weaker U.S. dollar. All lower-than-expected U.S. economic numbers have helped push the dollar lower, making crude oil cheaper for buyers using foreign currencies. For example, the greenback extended losses and dropped to its lowest level since the beginning of the year after preliminary data showed that the U.S. gross domestic product rose 2.4% in the fourth quarter, missing expectations for a 2.5% growth.
Finishing this part of this month’s Oil Investment Update, we want to recall another bullish factor, which has supported crude oil in February - global supply concerns. In the previous month, Libyan oil output fell to 230,000 barrels a day (down from 570,000 barrels a day in early January) as labor unrest has limited Libyan oil production and exports. At this point it’s worth noting that market participants were also concerned about supply reductions in Nigeria, Venezuela and South Sudan, which was also a bullish factor supporting the commodity.
Nevertheless, from today’s point of view, it seems that events in Eastern Europe were the primary driver in the market in the recent days. As a reminder, Russia, the world's biggest oil producer, sent troops into Crimea, a peninsula in Ukraine. The move stoked fears that there could be a disruption in supply in both crude and refined oil products. These circumstances resulted in a sharp increase in crude oil, which pushed the price to a fresh 2014 high of $105.22. However, Russian President Vladimir Putin’s statement on Tuesday raised investors' hopes for a peaceful resolution with Ukraine. Putin said he saw no reason to send troops further into Ukraine, and troops ceased military exercises that had increased tensions. He also said that Moscow reserved the right to use force in Ukraine’s Crimea region in the event of “lawlessness” but added that such a move would be a last resort. The price of light crude also dipped after the Russian defense minister ordered troops engaged in military exercises near Ukraine’s borders to return to their bases. Although easing of tensions triggered the market decline, the situation on the ground in mainly Russian-speaking Crimea remained tense and could have an impact on the oil market in the near or further future (especially when we take into account the fact that Russia is the world's second-largest crude oil exporter and, as mentioned earlier, the world's biggest oil producer).
Crude Oil
Keeping in mind these factors and their impact on the price of light crude, let’s now move on to the technical part of this month‘s Oil Investment Update. Just like a week ago, we take a look at the charts from different time horizons to have a more complete picture of the current situation in the oil market.
Let’s start with a look at the monthly chart of light crude (charts courtesy by http://stockcharts.com).
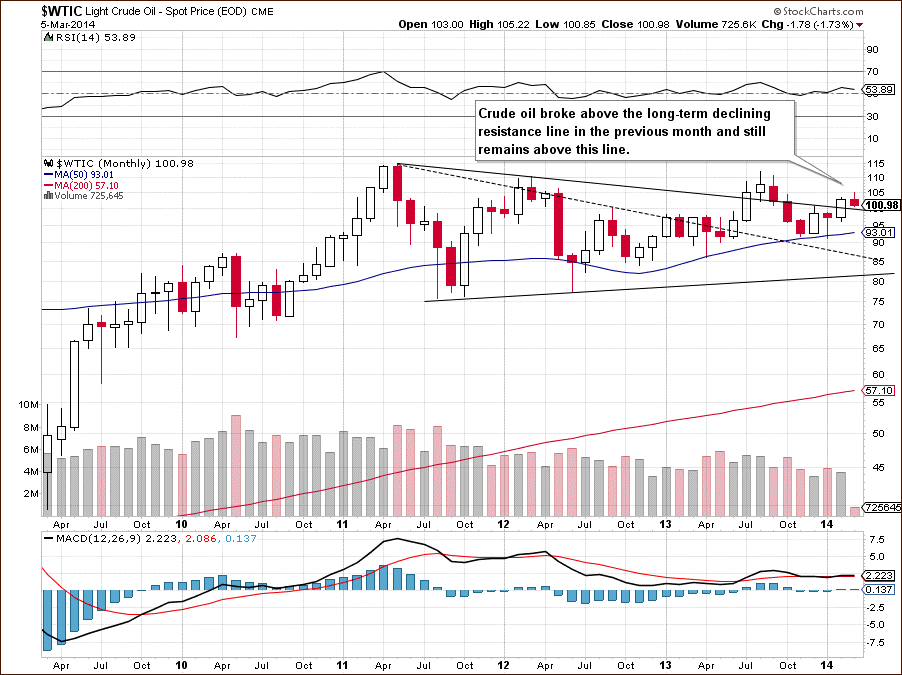
On the above chart, we see that the situation has improved as crude oil broke above the long-term declining resistance line in the previous month. Although light crude reversed earlier this month, it still remains above this line, which serves as a support at the moment. Even if we see a drop below the long-term support line, the 50-month moving average in combination with a bullish engulfing pattern will likely stop further deterioration (similarly to what we saw in previous months).
Now, let’s zoom in on our picture of the oil market and see the weekly chart.
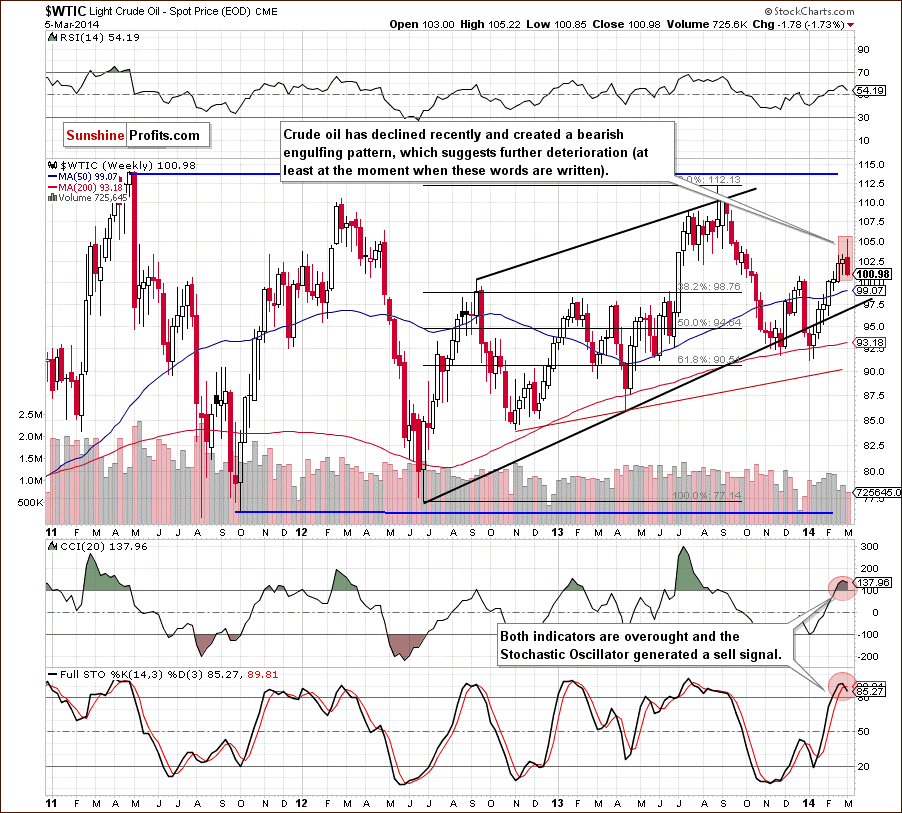
Looking at the above chart, we see that oil bulls didn’t give up in the previous month and (after a small decline to the medium-term support line) successfully broke above the 50-week moving average. This bullish event triggered further improvement and crude oil extended gains, hitting a fresh 2014 high and reaching above $105.Despite this improvement, light crude reversed and gave up the gains earlier this week, which resulted in a drop to the December high. Because of this downward move, we see a bearish engulfing pattern on the weekly chart at the moment, which suggests further deterioration in the near future (of course this bearish scenario will be invalidated if light crude climbs above the 2014 high). If this is the case, we will likely see a decline to the previously-broken 50-week moving average, which serves as the nearest medium-term support. If it encourages oil bulls to act, we will likely see a pause or even a corrective upswing. However, if it is broken, we may see further deterioration and the next downside target for the sellers would be the medium-term support line (the lower border of the rising trend channel), which successfully stopped decline in February.
Now, let’s check the short-term outlook.
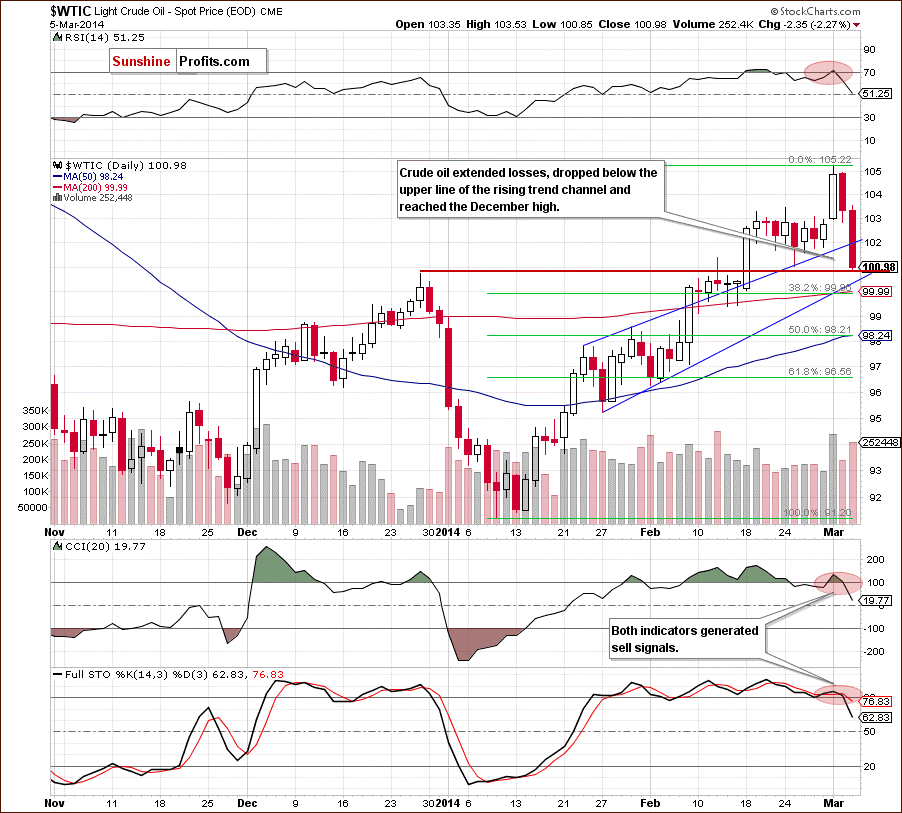
In our last Oil Investment Update, we wrote the following:
(…) crude oil approached the 50-day moving once again. If this strong support encourage buyers to push the order button, we will likely see a corrective upswing in the coming days.
As you see on the above chart, this moving average successfully stopped further deterioration in the previous month, which resulted in a breakout above the upper line of the rising trend channel (marked with blue) and the 200-day moving average. This bullish signal triggered further improvement and (after a small pause) light crude broke above the December high. In the following days, crude oil extended gains and hit a fresh 2014 high. Although these circumstances encouraged oil bears to act and resulted in a drop to the upper line of the rising trend channel, oil bulls didn’t give up and triggered and upswing on Monday. Thanks to this move, crude oil rebounded sharply and hit another 2014 high. Looking at the daily chart, we see that this improvement was temporary (at least from today’s point of view) and light crude erased all its gains from Monday's jump slipping below $101 per barrel. With this downswing, crude oil not only dropped to the upper line of the rising trend channel, but also reached the December high. If this support line is broken, we will see further deterioration and the first downside target will be the lower border of the rising trend channel, which is slightly above the 38.2% Fibonacci retracement level based on the recent rally (which corresponds to the 200-day moving average at the moment). Looking at the position of the indicators, we see that the CCI generated a sell signal (while the Stochastic Oscillator declined below the level of 80), which supports sellers and suggests that the bearish scenario is likely to be seen in the coming day.
Summing up, looking at the above charts, we see that the situation from the long-, medium- and short-term perspective has improved significantly as crude oil broke above the long-term declining resistance line, the 50-week moving average and the December high. Despite this improvement, the short-term outlook has deteriorated recently as light crude reversed and dropped below the upper line of the riding trend channel. Taking this fact into account (and combining with the bearish engulfing pattern on the weekly chart) it seems that we will see a bigger pullback in the near future. If this is the case, the first downside target for the sellers will be slightly below $100, where the 38.2% Fibonacci retracement level (based on the recent rally) and the 200-day moving average are. If this area is broken, the next support will be slightly above $99, where the 50-week moving average is.
Having discussed the current outlook for crude oil, let’s examine the NYSE Arca Oil Index (XOI) to find out what the current outlook for oil stocks is.
Oil Stocks
Let’s begin with the long-term chart.
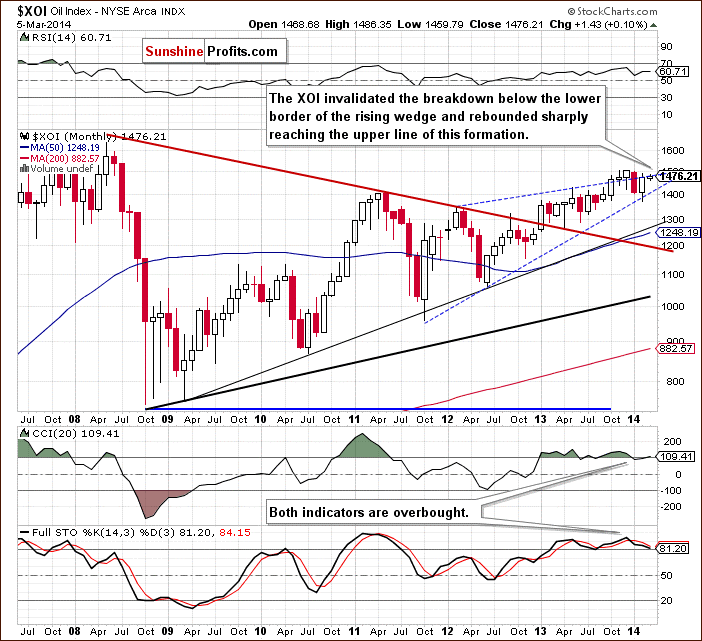
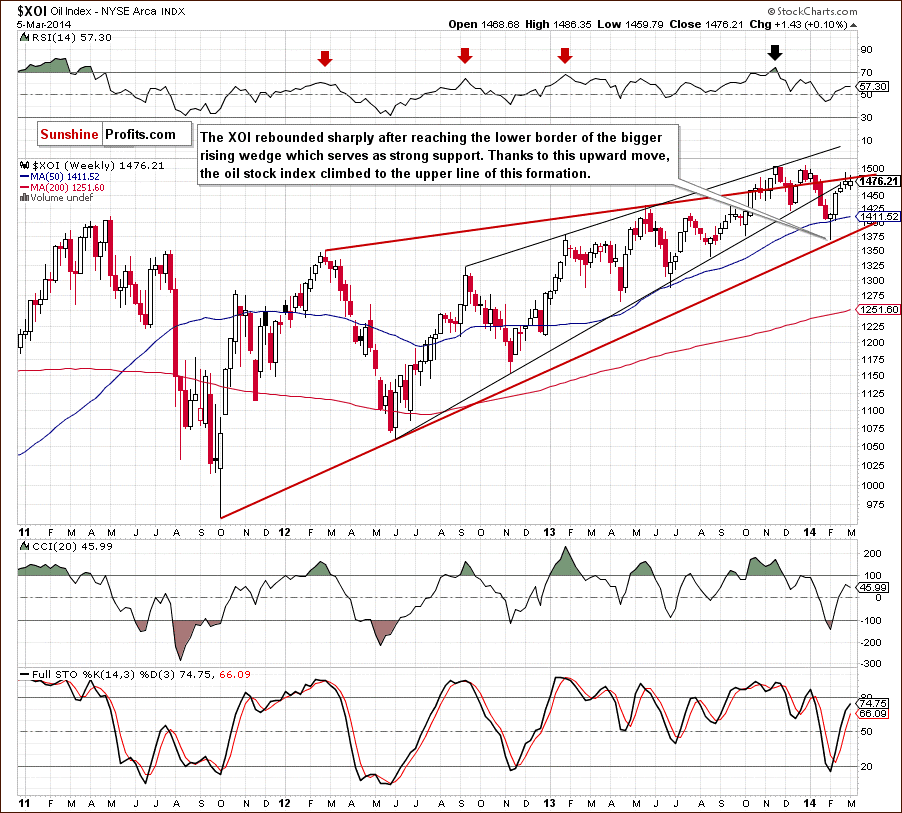
From this perspective, we see that the situation has improved significantly as the XOI rebounded sharply after a drop to the lower border of the rising wedge (to be precisely, there was a small drop below this support line). Thanks to this move, the oil stock index reached the upper line of this formation, which serves as major resistance at the moment. If this line is broken, we will likely see further improvement and the upside target will be the 2013 top. On the other hand, if this resistance encourages oil bears to act, we may see another attempt to move lower. In this case, the downside target for the sellers will be the lower border of the rising wedge (currently slightly above 1,400). Please note that the CCI and Stochastic Oscillator are still overbought (additionally, there is a negative divergence between the lattes and the XOI), which suggests that a pause or a pullback is quite likely in the coming month.
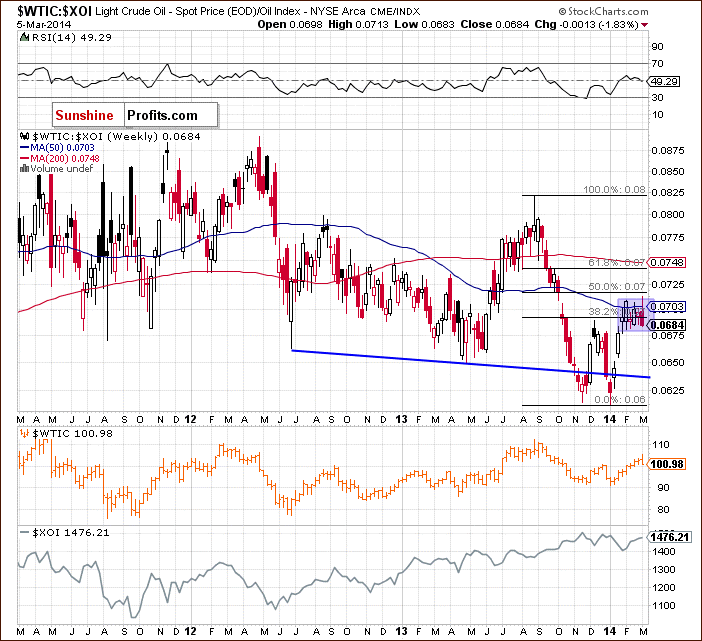
To see the current situation more clearly, let’s zoom in on our picture and move on to the weekly chart.
Looking at the above chart, we see that the XOI not only reached the upper line of the big rising wedge (marked with red), but also the lower border of the smaller rising wedge. Additionally, the oil stock index approached the psychological barrier of 1,500, which suggests that a pause in the near future should not surprise us. Similarly to what we wrote discussing the situation in the monthly chart, if this resistance zone is broken, we will likely see further improvement and an increase to the 2013 top or even to the medium-term resistance line based on the Sept. 2012, Jan. 2013 and May 2013 high, which successfully stopped buyers in November. Looking at the position of the indicators, we see that they still support buyers, which suggests that higher values of the oil stock index are likely to be seen in the coming weeks. Nevertheless, we should keep in mind that this resistance zone is quite strong. Therefore, if the buyers fail, we will likely see a decline to one of the Fibonacci retracement levels based on the recent rally (seen more clearly on the chart below).
Having discussed the medium-term outlook, let’s turn to the daily chart.
Quoting our previous Oil Investment Update:
(…) it seems that the medium-term support line based on the April and June lows is the last stop before further falls. If it encourages buyers to act, we will likely see a corrective upswing in the coming week (or weeks). At this point, it’s worth noting that this scenario is reinforced by the position of the indicators, which are oversold and will likely generate buy signals. If this is the case, we may see an upward move and the first upside target would be the 200-day moving average.
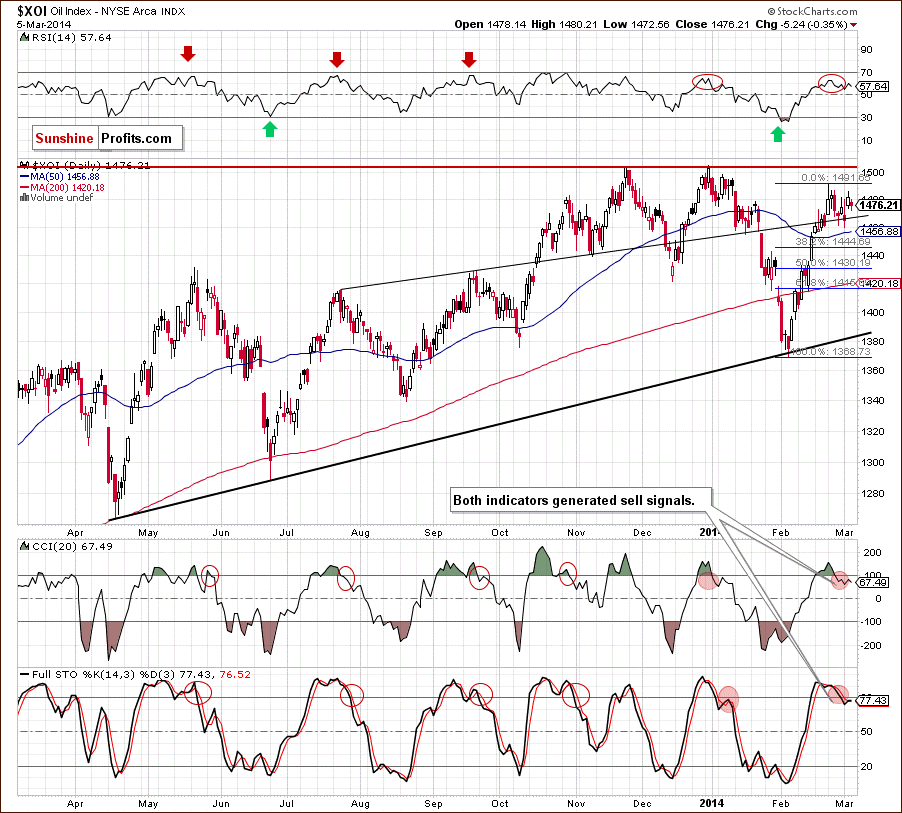
Looking at the above chart, we see that the medium-term support line successfully stopped further deterioration and triggered a sharp upward move. As you see on the daily chart, the 200-day moving average didn’t manage to stop buyers, which resulted in further improvement. In this way, oil bulls realized a pro growth scenario and the oil stock index erased most of the recent decline. From this perspective, we see that the XOI has been trading in a narrow range (between the Feb.24 high and March low) recently. We saw similar situation in the case of crude oil in the previous week. If history repeats itself, we may see another upswing in the coming days and the first upside target will be the psychological barrier of 1,500. However, looking at the current position of the indicators, we see that they support sellers (the CCI and Stochastic Oscillator generated sell signals, while the RSI dropped from its highest level since late December), which suggests that a correction is just around the corner. If this is the case, the first downside target for the sellers will be the 38.2% Fibonacci retracement level based on the recent rally. If it is broken, we will likely see further deterioration and a drop to the next Fibonacci retracement, which corresponds to the Feb.11 high (around 1,430).
Summing up, from the long-, medium- and short-term perspectives, the situation has improved significantly as the oil stock index rebounded sharply and erases most of the recent decline. With this upward move, the XOI reached important resistance zone (created by the upper line of the big rising wedge, lower border of the smaller rising wedge and the psychological barrier of 1,500). Looking at the short-term indicators, it seems that this resistance will likely trigger a correction in the coming days (or weeks) and the downside targets are created by the next Fibonacci retracement levels. As mentioned earlier, the 50% retracement is reinforced by the Feb.11 high, while the 61.8% retracement is supported by the 50-week moving average.
Crude Oil - Oil Stocks Link
Having discussed the current situation in crude oil and the oil stock index, let’s comment on the relationship between them.
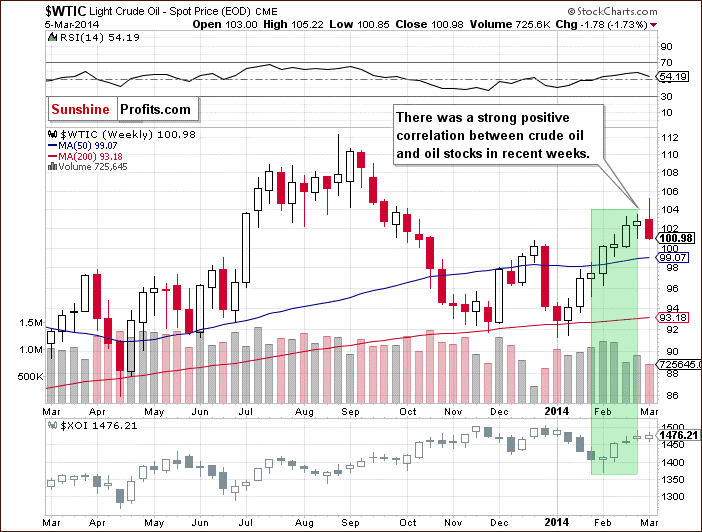
When we take a look at the above chart and compare the price action in both cases, we see that a positive correlation between crude oil and oil stocks came back in the previous weeks. In February, crude oil extended gains, broke above the December high and erased over 61.8% of the Aug.-Jan. decline. Meanwhile, looking at the situation in the XOI, we see that oil stocks were visibly weaker in the previous month (although the oil stock index rebounded sharply, it didn’t climb above the 2013 high). Despite these discrepancies, they both moved in the same direction in February. If this positive relation between light crude and oil stocks remains in place, we will likely see similar price action in both cases also in March.
Ratio Analysis
Taking the above into account, let’s take a closer look at the oil-stocks-to-oil ratio from the weekly perspective. What impact could it have on future oil moves?
Before we discussed the current situation in the ratio and its implications for crude oil, we would like to draw your attention to fact that higher values of the ratio triggered downward moves in crude oil in the previous months. As you know from our previous Oil Investment Updates, this dependence was based on the negative correlation between the XOI and WTIC. However, taking into account the fact that a positive correlation between crude oil and oil stocks came back in the previous weeks, we should interpret the current moves in the ratio differently than we did so far.
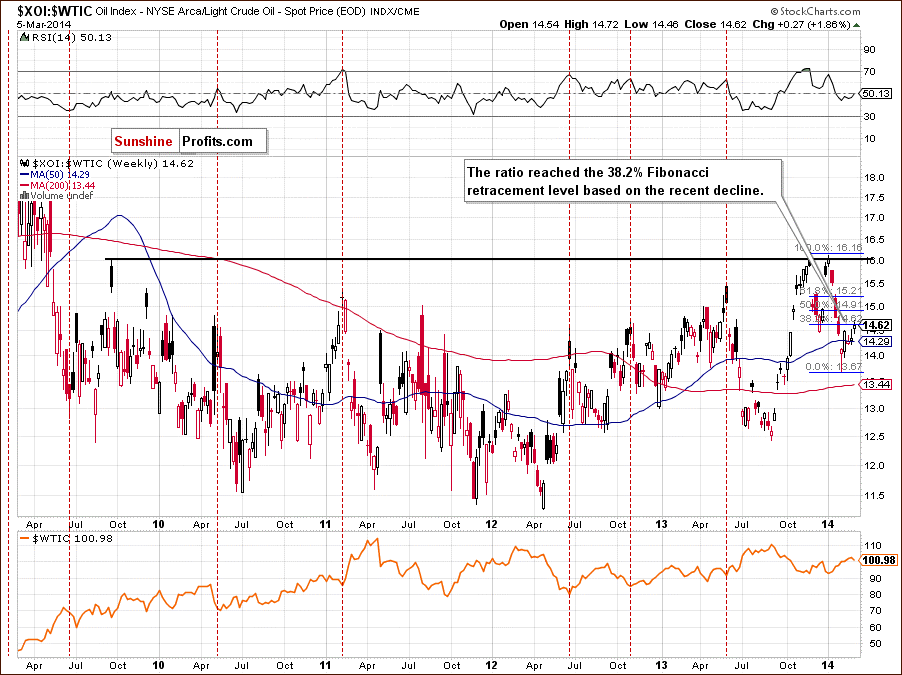
From this perspective, we see that the ratio broke above the 50-week moving average and reached the 38.2% Fibonacci retracement based on the recent decline (which corresponded to higher values of crude oil and the XOI). If this resistance level encourages sellers to act, we will likely see a decline and the first downside target will be the previously-broken 50-week moving average. If we see such action in the coming week (or weeks) and positive correlation between the oil stock index and light crude remains in place, we will likely see a correction in oil stocks and crude oil (the above would mean that they would both decline but oil stocks would decline faster). On the other hand, if this resistance level is broken, we may see further improvement in both cases.
Having discussed the above, let’s examine the oil-to-oil-stocks ratio.
As you see on the above chart, the medium-term situation in the ratio hasn’t changed much recently as it remains in a consolidation range (marked with a light blue rectangle). Although we saw a breakout above the upper line of the consolidation, the proximity to the 61.8% Fibonacci retracement level encouraged sellers to act and resulted in a sharp decline earlier this week. Such dop in the ratio corresponded to a decline in crude oil. Therefore, if the ratio extends declines and drops below the lower border of the consolidation, we will likely see lower values of light crude in the coming week (or weeks).
Once we know the above, let’s focus on the oil-to-stocks ratio. Will it give us some interesting clues about crude oil’s future moves?
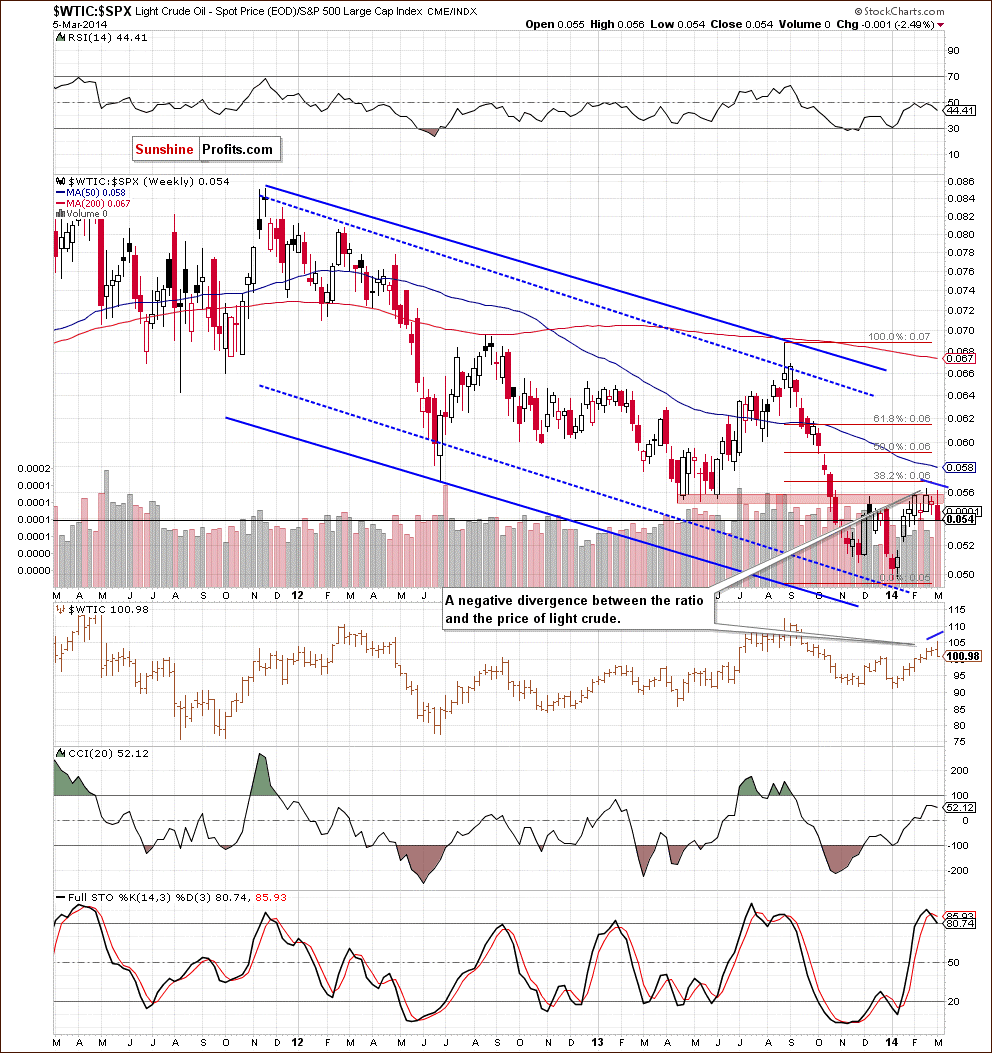
The first thing that catches the eye on the above chart is a negative divergence between the ratio and crude oil (marked with blue lines). Earlier this week, we saw a sharp upswing in light crude, which resulted in a fresh 2014 high. Meanwhile, we didn’t see such price action in the case of the ratio (it only approached the previous high). Additionally, the ratio reached a resistance zone created by April and May 2013 lows, which successfully stopped further improvement at the beginning of December and also in February. Connecting the dots, if history repeats itself once again, we will likely see further deterioration in the ratio, which probably will trigger a correction in crude oil. This scenario is currently reinforced by the position of the Stochastic Oscillator, which generated a sell signal.
To have a more complete picture of the current situation in crude oil, let’s take a look at the non-USD (WTIC:UDN ratio) chart of crude oil once again. As a reminder, UDN is the symbol for the PowerShares DB US Dollar Index Bearish Fund, which moves in the exact opposite direction to the USD Index. Since the USD Index is a weighted average of the dollar's exchange rates with world's most important currencies, the WTIC:UDN ratio displays the value of crude oil priced in "other currencies".
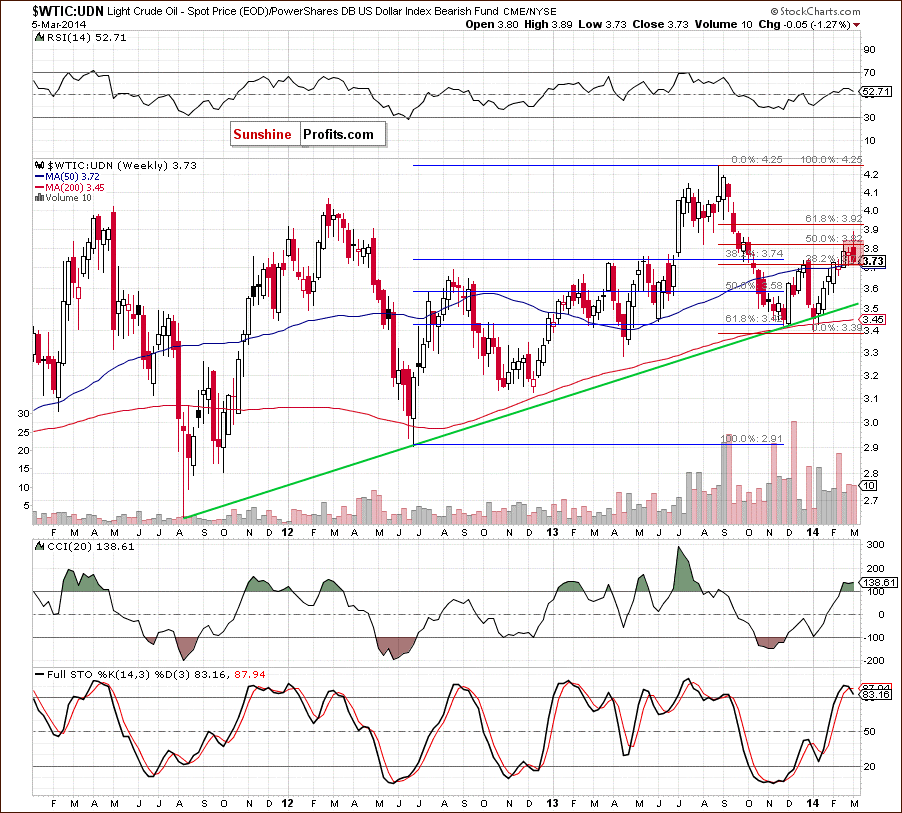
On the above chart, we see that crude oil successfully broke above the 50-week moving average and the December high, which triggered further improvement. With this upward move, light crude also broke above the 50% Fibonacci retracement level based on the Aug.-Jan. decline and approached the next retracement level. Despite this improvement, crude oil gave up the gains and reversed earlier this week, slipping to the previously-broken 50-week moving average. If this support encourages oil bulls to act, we may see a corrective upswing in near future. However, if it is broken, we will see further deterioration and a drop to around 3.6, where the February low is. Please note that the indicators are overbought (the Stochastic Oscillator generated a sell signal), which suggests that a correction is just around the corner. Additionally, the recent candlesticks have formed a bearish engulfing pattern, which support sellers at the moment.
Scenarios
Just like a month ago, today’s Oil Investment Update includes scenarios of what could happen in the coming weeks. Naturally, we will continue to monitor the market in the coming days and if anything invalidates our long-term outlook we will send you an additional message.
- Bullish scenario
Taking into account only the short-term outlook, we may see a drop to slightly (several cents) below $100, where the 38.2% Fibonacci retracement level (based on the recent rally), the 200-day moving average and the declining long-term support line are. If this strong support zone encourages oil bulls to act, we may see further improvement in crude oil and the first upside target will be around $106, where the 70.7% Fibonacci retracement level (based on the entire Aug.-Jan. decline) is. - Bearish scenario
If the strong support zone is broken, we will see further deterioration. As mentioned earlier, the first downside target will be around $99, where the 50-week moving average is. If it is broken, the lower border of the rising trend channel (on the weekly chart) should stop further deterioration (currently slightly above $97). Please note that if crude oil declines below the lower border of the short-term rising trend channel ($100.40), the downside price target will be around this level ($97.40). Additionally, this area is also reinforced by the Feb. 7 low.
Summary
From the long-, medium- and short-term perspective, the situation has improved significantly as crude oil broke above the long-term declining resistance line, the 50-week moving average and the December high. However, the short-term outlook has deteriorated recently as light crude reversed and dropped below the upper line of the rising trend channel. Looking at the above charts, we also noticed an unconfirmed bearish engulfing candlestick pattern on the weekly chart (seen also from the non-usd perspective), which may encourages sellers to act in the near future. What’s interesting, the positive correlation between crude oil and oil stocks came back in the previous weeks, which suggests that if the oil-stocks-to-oil ratio reversed, we will likely see a decline in oil stocks and crude oil. This scenario is currently reinforced by the position of the short-term indicators and the situation in the oil-to-stocks ratio (there is a negative divergence between the ratio and crude oil).
All the above provide us with bearish implications (in the short term) and, from today’s point of view, a move to the downside is likely to be seen. Nevertheless, we should keep in mind that as long as crude oil (priced in U.S. dollars) remains above the 200-week moving average ($99.99), the long-term declining support line and the bullish engulfing pattern (on the monthly chart) is not invalidated, it seems unlikely that we see a decline below the January low ($91.24) – especially if crude oil priced in "other currencies" remains above the long-term rising support line (marked in green).
Very short-term outlook: bearish
Short-term outlook: mixed with bearish bias
MT outlook: bullish
LT outlook: mixed
Trading position (our opinion): If one wants to hold your long position for months, it doesn't seem that the current move lower needs to be really concerning - even if oil drops to $94 or so. However, if one's long position is intended to be kept for weeks, not months, then one might want to close this position after the move below $99 and re-enter it either when oil drops to $95 or when price moves back to this level (if there is no visible decline thereafter).
This completes this week’s Oil Investment Update. Our next Oil Investment Update is scheduled for Tuesday, April 3, 2014. Oil Trading Alerts subscribers will additionally receive similar but shorter alerts on a daily basis (or more than once a day when the situation requires it). You – Oil Investment Updates subscribers – will receive short Investment Alert messages should the outlook for the medium or long term change before the next Update is posted.
Thank you.
Nadia Simmons
Forex & Oil Trading Strategist
Oil Investment Updates
Oil Trading Alerts

