
Looking at the chart of crude oil from today’s point of view, we can say that the recent month was good for oil bulls. After three consecutive months of losses, light crude rebounded and erased 38.2% of the entire Aug.-Nov. decline. With this upward move, crude oil also broke above the psychological barrier of $100. Nevertheless, this improvement didn’t last long. At the end of December, oil investors took profits, which started the current decline. What other factors added the selling pressure?
At the beginning of the previous week, disappointing U.S. home sales figures fueled concerns that the U.S. housing sector, which drove the country into the worst recession since the Great Depression and has dragged on its recovery ever since, continues to face headwinds today and the U.S. economy continues to battle potholes on its road to recovery .
What’s interesting, on the following day, oil investors shrugged off U.S. consumer confidence data. Although they were solid, they didn’t boost the commodity, which was another bearish signal. Therefore, as you might’ve guessed, a smaller- than-expected drop in U.S. jobless claims released on Thursday weighted on the price of light crude adding selling pressure. Additionally, earlier this week data showed that the U.S. non-manufacturing sector's expansion remained on track in December, but slower than expected, which pushed the price of light crude to a fresh monthly low.
Connecting the dots, we clearly see that weaker-than-expected U.S. economic data have fueled concerns that the oil’s biggest consumer may demand less fuel and energy than once anticipated. Therefore, it seems that we could see a similar investors’ reaction in the coming weeks – especially when we take into account the fact that better-than-expected U.S. economic data pushed the price higher in December.
Meanwhile, on Friday the Energy Information Administration said that crude oil inventories fell by 7.01 million barrels in the previous week, far above market expectations for a decline of 2.98 million barrels. However, it seems that market players attributed much of the unexpectedly large decline to year-end accounting. Additionally, distillate fuel, which includes diesel and heating oil, rose by 5.04 million barrels, well above expectations for a gain of 1.23 million and overshadowed the sharp decline in oil inventories. Please note that crude oil inventories have dropped by 7.9%, or 30.8 million barrels in the past five weeks, to the lowest level since Sept. 20. On Dec. 27, stocks of 360.6 million barrels were 10% above the five-year average, the smallest surplus to that mark in 10 weeks. Therefore, today traders have been awaiting data from the Energy Information Administration, which are expected to show a sixth straight weekly decline in U.S. crude inventories. If we see such a drop, it will be a bullish signal, which will support the price of light crude.
We should also keep in mind that the price of light crude has fallen in recent sessions on expectations for Libyan production to approach normal levels and add to global supply. As a reminder, output from the OPEC-member had fallen to 250,000 bpd from 1.4 million bpd in July, boosting international oil prices. Meanwhile, the resumption of Libya's El Sharara field could lift the country's production to 600,000 barrels per day, which is bearish for crude oil. Despite this negative news (which has driven the price lower in recent days), yesterday the country's armed forces warned they would not allow any oil tanker to load at ports seized by protesters. The Libyan Navy had blocked a Maltese-flagged vessel from trying to reach a dock and opened fire as it approached the port of Es Sider. This news fueled concerns over oil flows from Libya and pushed the price higher.
Additionally, oil investors have worried about violence in Iraq as a missile strike reportedly killed 25 militants in the city of Ramadi. Iraqi forces mounted attacks against al Qaeda-linked militants there and in Fallujah after the insurgents made their first push into major cities of the country since the conflicts that followed the U.S.-led invasion in 2003. At this point, it’s worth noting that Iraq exported 2.4 million barrels of crude in 2012 according to the Energy Information Administration, and the main concern in this case is that the fighting could disrupt the country's crude exports.
Crude Oil
To see what the crude oil market itself can tell us, let's jump straight into the technical part of this month‘s Oil Investment Update. Just like in the previous month, we’ll take a look at charts in different time horizons to have a more complete picture of the current situation in the market.
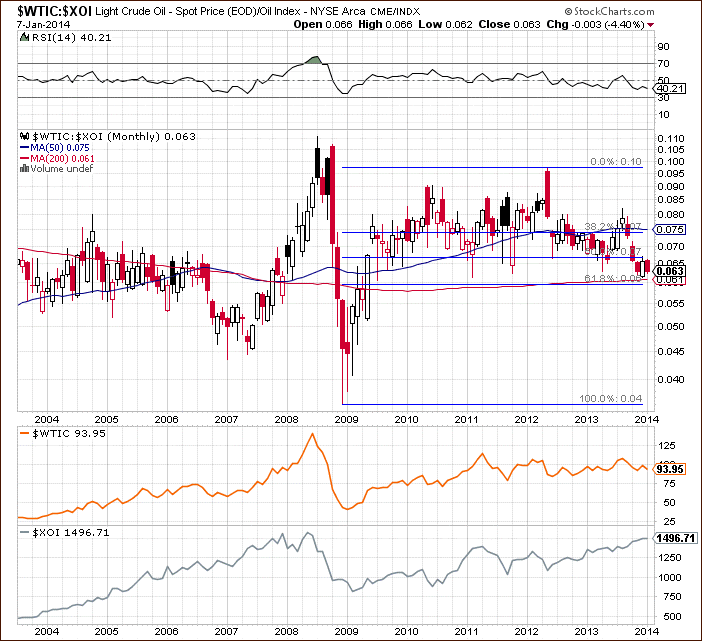
Let’s start with a look at the monthly chart of light crude (charts courtesy by http://stockcharts.com).
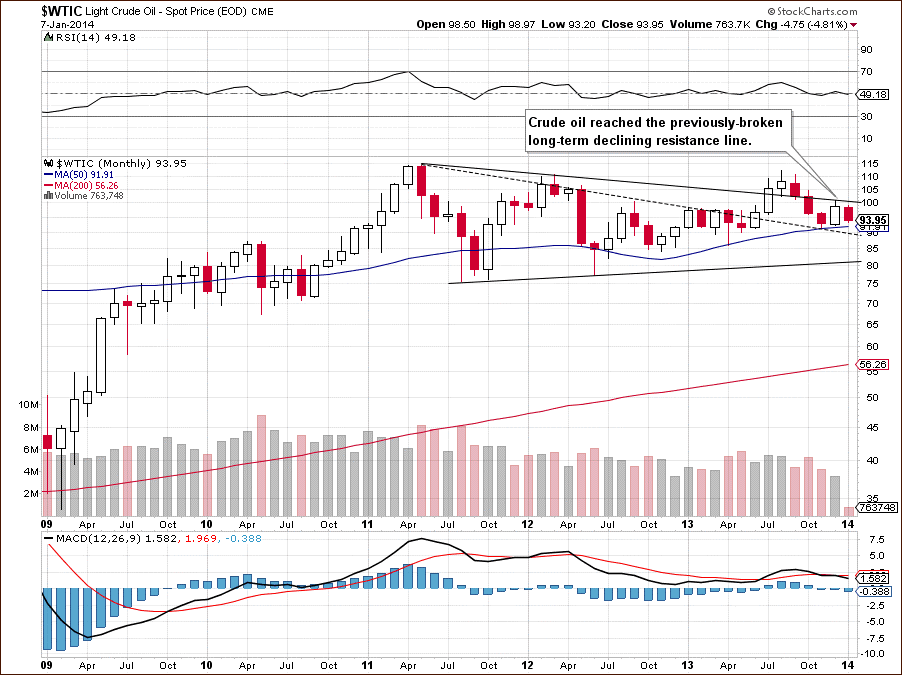
On the above chart, we see that the situation in the long-term chart has deteriorated as crude oil reached the previously-broken long-term declining resistance line based on the May 2011 and March 2012 highs. This resistance encouraged oil bears to trigger a corrective move, which took the price below $94. As you see on the monthly chart, the 50-month moving average, which successfully stopped further deterioration in two previous months (and also earlier in April), is slightly below the current price level. If history repeats itself once again, the space for further declines will be limited.
Please note that two previous candlesticks created a bullish engulfing pattern, which together with the 50-month moving average supports the bullish case. However, if this area is broken (which would be a strong bearish signal) the nearest support will be the long-term declining line based on the May 2011 and March 2012 highs (in terms of monthly open prices).
From this point of view, the situation is mixed with bullish bias (as long as crude oil remains above the 50-month moving average and the bullish engulfing pattern is not invalidated).
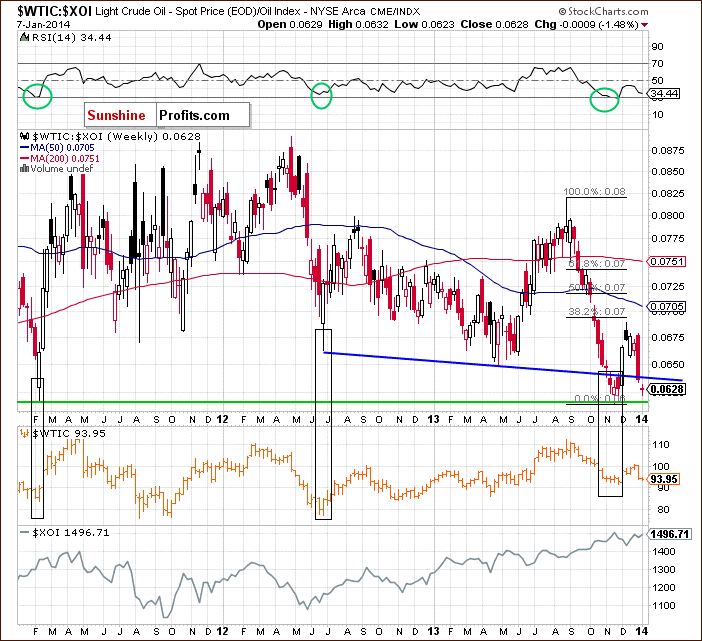
Now, let’s zoom in on our picture of the oil market and see the weekly chart.
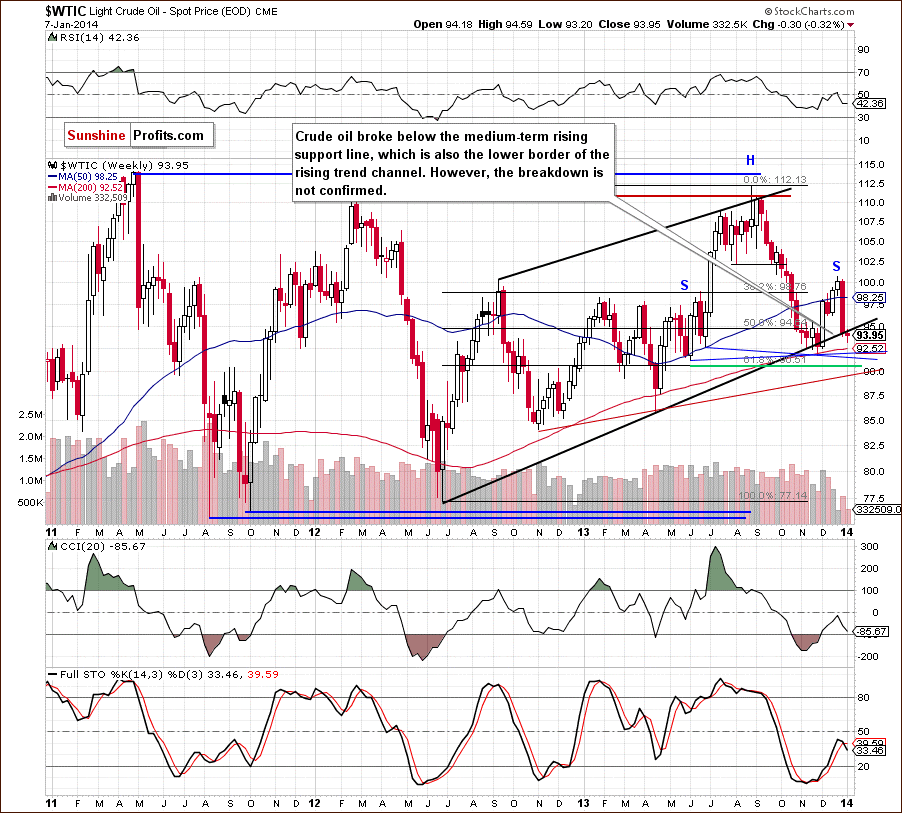
Looking at the above chart, we see that crude oil reversed course and declined sharply in the previous week. With this downward move, light crude reached the medium-term rising support line, which is also the lower border of the rising trend channel. On Monday, crude oil extended its decline and dropped below this line, which is a bearish signal, however, the breakdown is not confirmed at the moment. Please note that we saw a similar phenomenon only once in the past - in November 2013 - and at that time, it was quickly invalidated, and even followed by a sharp rally. At that time it was the 200-day moving average that stopped the decline and triggered a reversal. Perhaps we will see similar action in the following days. This moving average is about $1 below the current price, so the downside seems very limited, and given the preceding action in the previous similar case, the upside can be quite significant, even on a short-term basis.
On the other hand, when we take a closer look at the above chart, we can notice a head and shoulders formation. From this point of view, if the price drops below blue lines, we will likely see further deterioration. In this case, according to theory, the price target for this formation will be around the Jun. 2012 low ($77.28). Nevertheless, the 61.8% Fibonacci retracement level based on the entire Jun. 2012-Aug. 2013 rally is slightly below the blue lines. This level could stop further declines and encourage buyers to push the price higher. However, if crude oil breaks below this support, the current decline will likely accelerate and the first target for the sellers will be around the April 2013 low ($85.90).
Now, let’s check the short-term outlook.
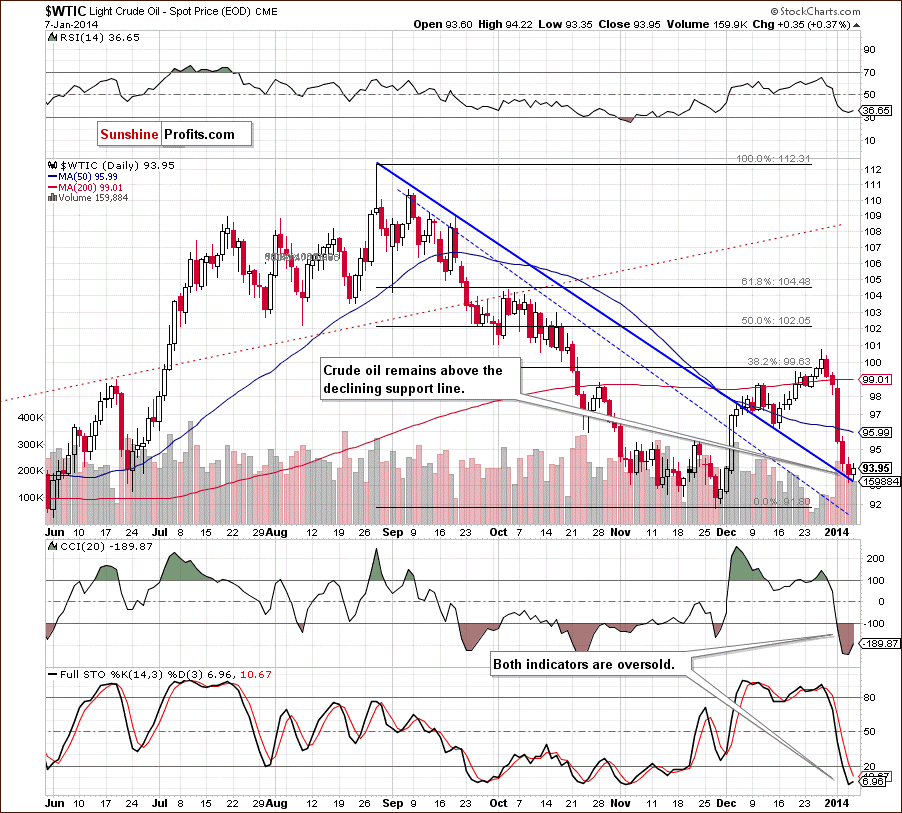
As you can see on the above chart, crude oil reversed course after reaching its first important upside targets – the 38.2% Fibonacci retracement level and the psychological barrier of $100. This strong resistance zone encouraged oil bears to act and resulted in a decline, which accelerated after the breakdown below the 200-day moving average. On the following day, crude oil also broke below the 50-day moving average, which was an additional bearish factor.
In recent days, light crude has reached its strong short-term declining support line (marked in blue), which successfully stopped further deterioration in December. If history repeats itself once again, we will likely see an upward correction in the coming day (or days). Additionally, we’ve noticed that recent (red) candlesticks materialized on decreasing volume, which suggests that the strength of the sellers has waned recently. Yesterday, the buyers took control and triggered an upswing, which took crude oil to its daily high of $94.22. Nevertheless, yesterday’s increase is still small and didn’t change the very short-term outlook, which remains bearish.
Please note that although the RSI rebounded from its lowest level since mid-November, it still remains slightly above the level of 30 and both other indicators are oversold, which support the bullish case.
Summing up, looking at the above chart, we clearly see that although crude oil gave up the gains in the previous week and declined below $94, it seems that the short-term support line will trigger a correction to the upside in the coming days. If this is the case, we will likely see an invalidation of the breakdown below the medium-term support line (marked in black on the weekly chart), which will be a strong bullish signal (especially if it materializes on relatively high volume). We should also keep in mind that a bullish engulfing pattern (seen on the monthly chart) and the 50-month moving average support oil bulls.
Having discussed the current outlook for crude oil, let’s examine the NYSE Arca Oil Index (XOI) to find out what the current outlook for oil stocks is.
Oil Stocks
Let’s begin with the long-term chart.
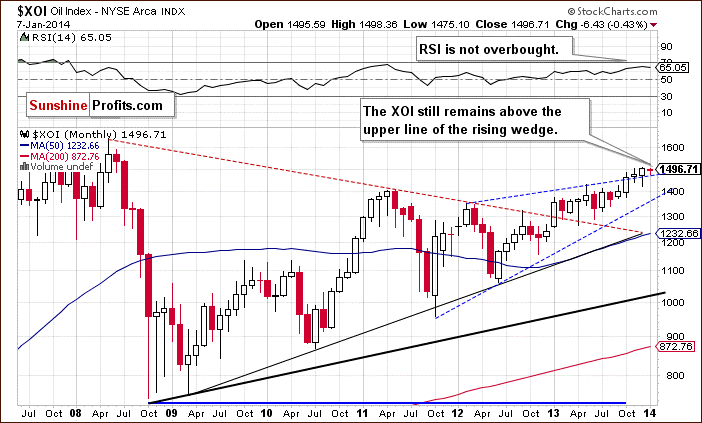
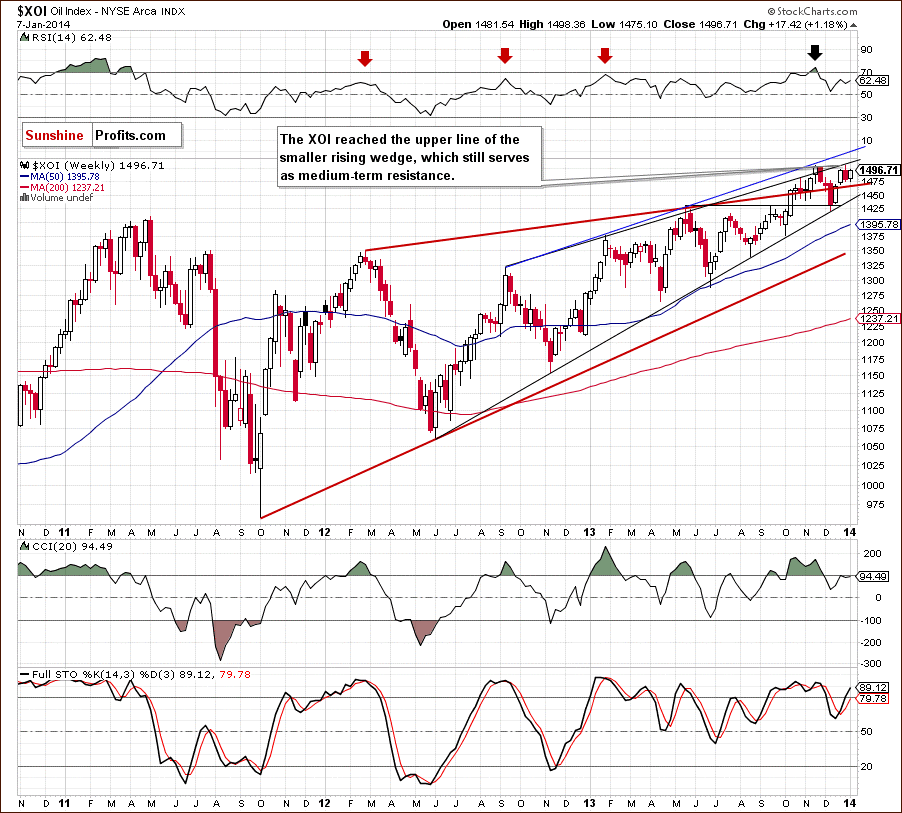
On the above chart, we see that the situation has improved recently. After a drop below the upper line of the rising wedge that we saw in the previous month, the oil stock index rebounded and invalidated the breakdown, which was a bullish sign. However, earlier this month the XOI declined and reached the upper line of the rising wedge once again.
From this perspective, if the oil stock index drops below this line, we will likely see further deterioration and the first downside target will be around the December low at 1,421. Please note that the RSI is not overbought at the moment, however, it remains at its highest level since April 2011. At this point, it’s worth noting that in previous years lower readings of the indicator were enough to trigger a correction.
To see the current situation more clearly, let’s zoom in on our picture and move on to the weekly chart.
In our last Oil Investment Update, we wrote the following:
(...) the oil stock index reached the medium-term support line based on the June and November 2012 lows, which successfully stopped declines earlier this year. We saw such situations in June, August and also in October. From this perspective, if history repeats itself once again we may see similar price action this (or next) week.
Looking at the above chart, we see that we had such price action in previous month. The XOI bounced off the medium-term support line and climbed to a fresh 2013 high. As you see on the above chart, with this upward move the oil stock index reached the upper line of the smaller rising wedge, which stopped further growth in November. This strong resistance encouraged the sellers to trigger a corrective move, which took the XOI below 1,480.
On the weekly chart, we see that the oil stock index remains between the upper line of the smaller rising wedge, which serves as medium-term resistance and the upper line of the rising wedge (marked with a bold red line), which serves as medium-term support. From this point of view, it seems that the breakout/breakdown above/below one of these lines will trigger another bigger move in oil stocks.
From the technical point of view, the medium-term uptrend remains in place at the moment, and the situation is still bullish.
Now, let’s turn to the daily chart.
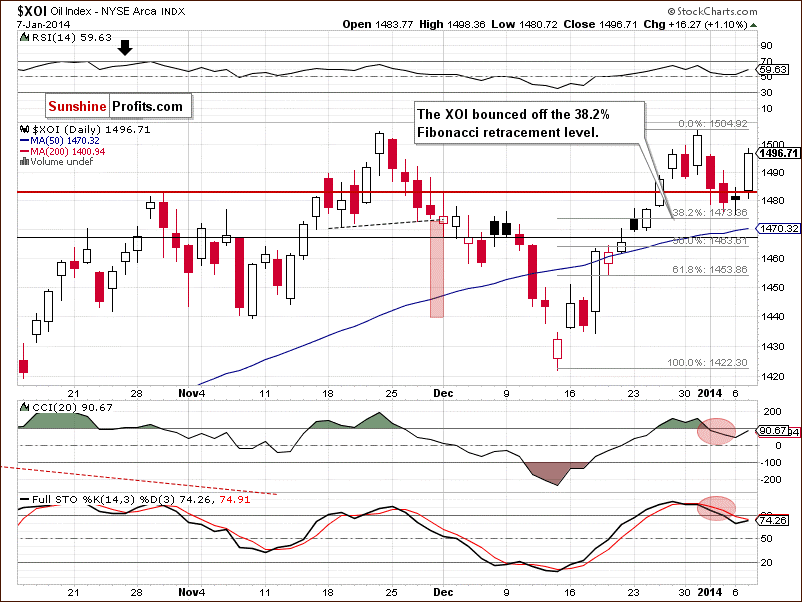
Looking at the above chart, we see that the XOI invalidated a small (actually a very small) breakout above the previous 2013 high in the previous week, which was a bearish signal. An invalidation of the breakout in combination with the proximity to the medium-term resistance line and with sell signals generated by the CCI and Stochastic Oscillator has resulted in a decline in recent days.
On the above chart, we see that the XOI extended its decline and almost touched the 38.2% Fibonacci retracement level based on the recent rally on Monday. Yesterday, this support encouraged buyers to push the buy button and the oil stock index rebounded, gaining 1.10%. With this upswing, the XOI approached the psychological barrier at 1,500 and erased most of the recent correction. Additionally, we can notice a morning star and yesterday’s (third) long white candlestick provides a bullish confirmation of the reversal. Therefore, another upswing should not surprise us.
Summing up, from the long- and medium-term perspectives, the situation has deteriorated slightly as the oil stock index reached the medium-term resistance and invalidated the breakout above the previous 2013 high. The combination of the above has triggered a decline in recent days, however, it is still shallow (the XOI has almost touched the 38.2% Fibonacci retracement level based on the recent rally). When take into account the short-term picture, it seems that if the buyers do not give up, we will likely see an upswing to the 2013 high. However, as long as the XOI remains below the upper line of the smaller rising wedge (which serves as medium-term resistance) space for further growth seems limited.
Crude Oil - Oil Stocks Link
Having discussed the current situation in crude oil and the oil stock index, let’s comment on the relationship between them.
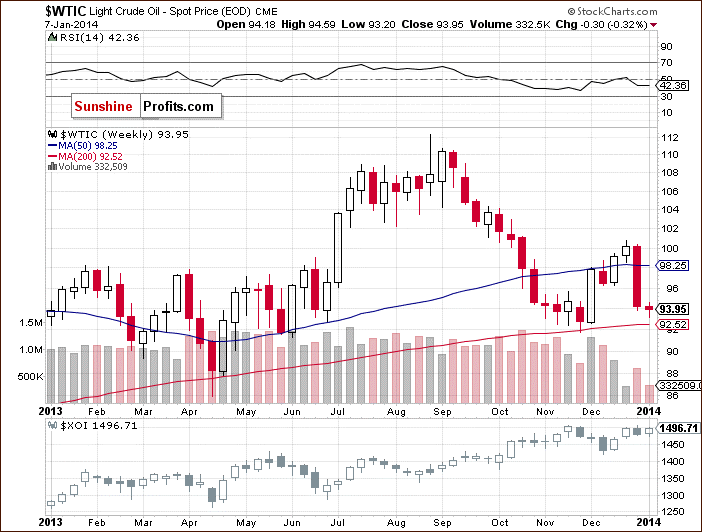
When we take a look at the above chart and compare the price action in both cases in the previous weeks, we see that crude oil and oil stocks moved higher together in the second half of December and then both declined. The recent corrective move in crude oil was visibly stronger and erased more than 78% of earlier gains, while oil stocks corrected only 38.2% of December rally. On top of that, the oil stock index hit a fresh annual high during the last session of 2013. Meanwhile, crude oil had already started its decline, which clearly shows its weakness in relation to oil stocks.
Please note that although the WTI and the XOI are moving in the same direction at the moment, after months of negative correlation it’s too early to say if this is a meaningful reversal of the tendency. Therefore, we should also analyze other charts (not only based on the relationship between them) anticipating future movements of crude oil and oil stocks.
Ratio Analysis
Taking the above into account, let’s take a closer look at the oil-stocks-to-oil ratio. What impact could it have on future oil moves? Let’s start with the long-term chart.
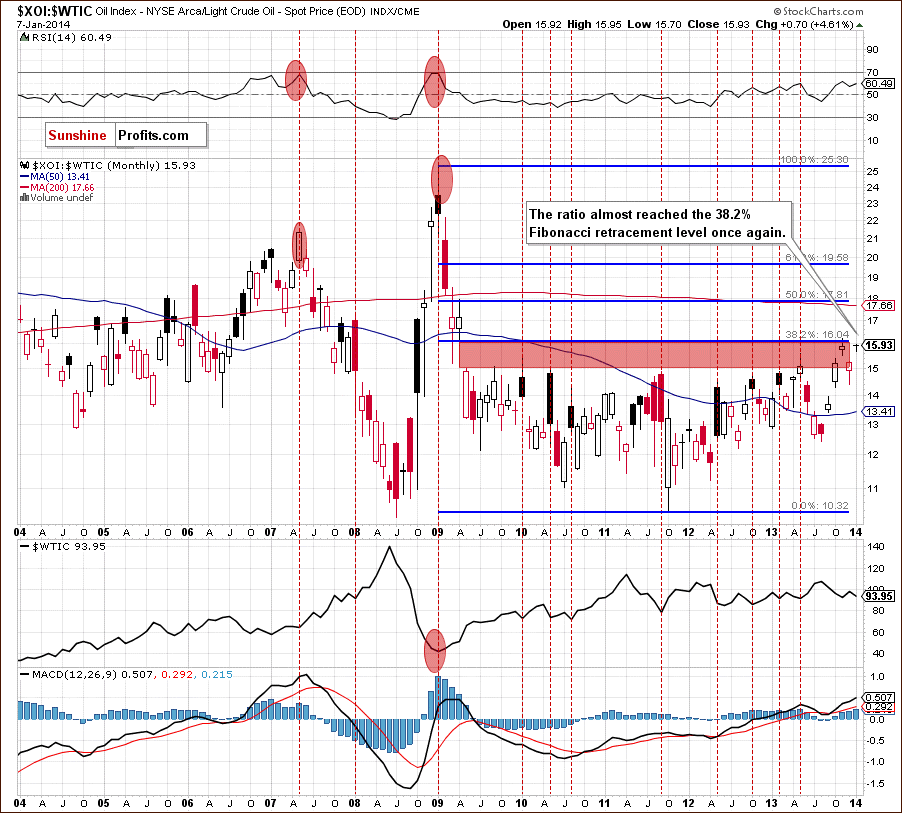
On the above chart, we see that the ratio moved higher and reached the strong resistance zone created by the 38.2% Fibonacci retracement level (based on the entire 2009-2011 decline) and the lower line of the gap between the April 2009 low and the May 2009 high (marked with the red rectangle) once again. We saw similar situation in November. Back then, this strong resistance zone stopped further growth and preceded higher values of light crude. If history repeats itself once again, we will likely further improvement in crude oil in the coming month.
Let’s examine the oil-to-oil-stocks ratio.
On the above chart, we see that the ratio remains above the 61.8% Fibonacci retracement and 200-month moving average, which supports the bullish case.
Let’s take a look at the weekly chart.
On the above chart, we see that the ratio declined below the medium-term support line (similarly to what we saw in November) and approached the 2013 low. Taking this fact into account, we may see a doule bottom formation in coming week (or weeks). If this is the case, it will likely trigger an upswing in the ratio, which will translate into higher prices of light crude. Additionally, the RSI slipped to slightly above the level of 30, which supports the bullish case.
Having discussed the above, let’s focus on the oil-to-stocks ratio. Will it give us some interesting clues about crude oil’s future moves?
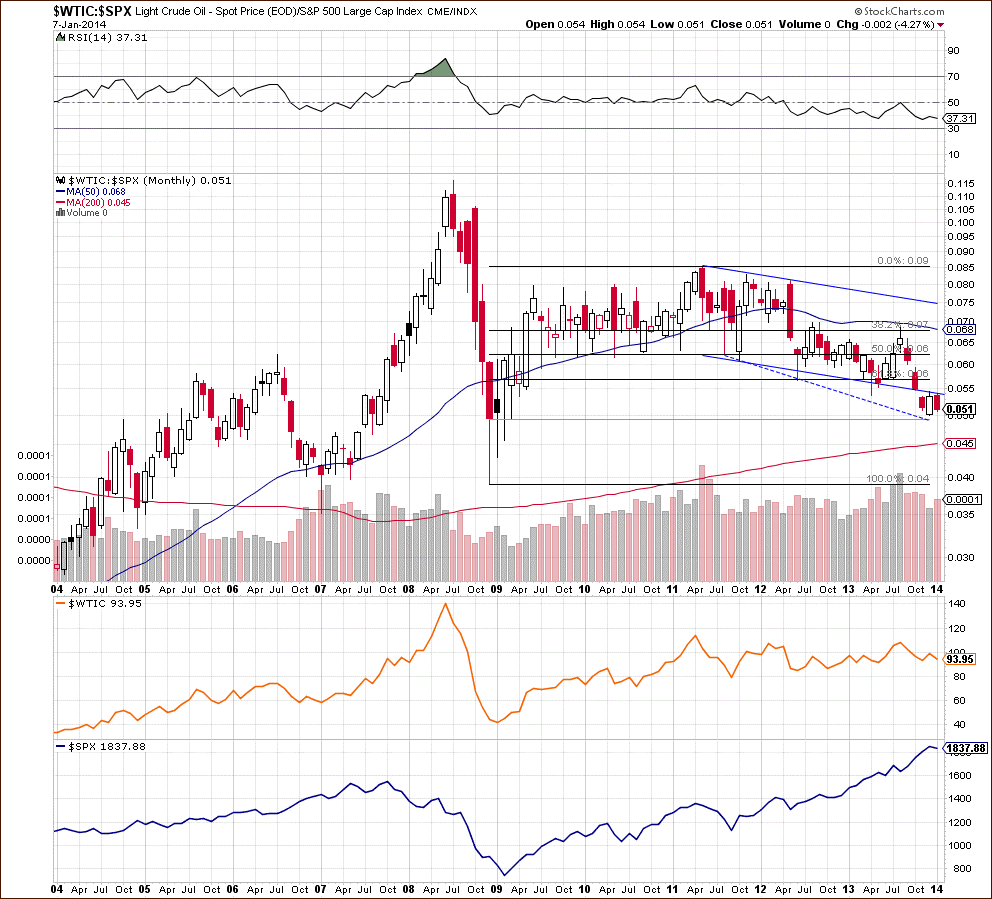
The WTIC:SPX ratio provides us with an interesting signal. The horizontal support created by previous lows worked particularly well in the past - it was almost flawless between mid-2009 and early 2011, and you can see double-bottom formations in many other cases, for instance in October 2012 and mid-2013. We now have this ratio at the Nov 2013 low, which is quite likely to provide strong support, given the efficiency of the previous horizontal support levels. This is a strong bullish sign.
Before we summarize, we would like draw your attention to the non-USD (WTIC:UDN ratio) chart of crude oil. Please note that UDN is the symbol for the PowerShares DB US Dollar Index Bearish Fund, which moves in the exact opposite direction to the USD Index. Since the USD Index is a weighted average of the dollar's exchange rates with world's most important currencies, the WTIC: UDN ratio displays the value of crude oil priced in "other currencies".
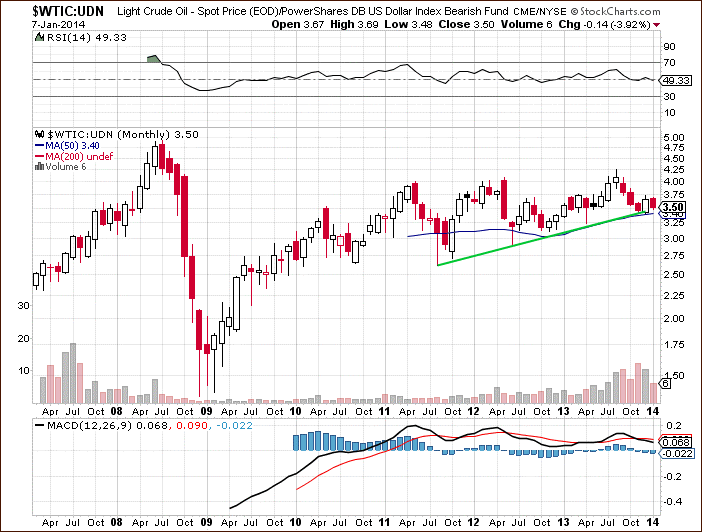
The first thing that catches the eye on the above chart is the long-term rising support line (marked in green) based on the August 2011 and June 2012 lows. As you see on the monthly chart, this strong support succesfully stopped declines in April and also in November 2013. Therefore, if history repeats itself once again, this line will likely stop further deterioration in crude oil this month.
To see the current situation more clearly, let’s take a look at the weekly chart.
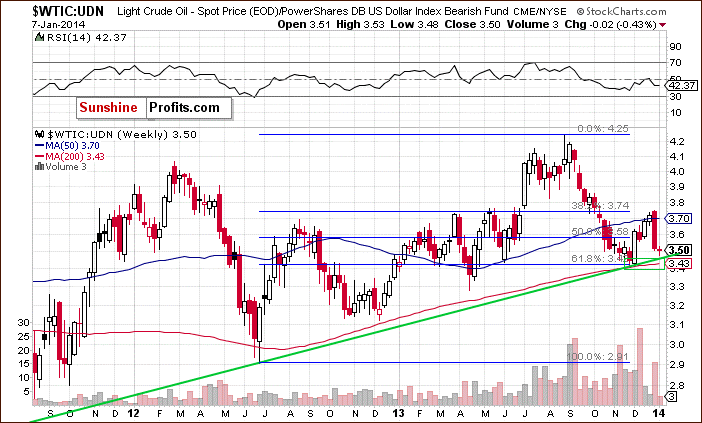
On the above chart, we see that crude oil approached the long-term rising support line. If this support encourages the buyers to act, we will likely see an upward correction in the near future. Please note that sligtly below is a strong support zone created by the 200-week moving average and the 61.8% Fibonacci retracement level, which succesfully stopped further deterioration in November. Therefore, taking the above into account, it seems that space for further declines is limited.
Scenarios
As is well known, it’s better to be a little over-prepared than underprepared. Therefore, today’s Oil Investment Update includes scenarios of what could happen in the coming weeks. Naturally, we will continue to monitor the market in the coming days and if anything invalidates our long-term outlook we will send you an additional message.
- Bullish scenario
Looking at the charts of crude oil from the long-term perspective, we should keep in mind that light crude remains above the 50-month moving average and the bullish engulfing pattern (seen on the monthly chart) supports oil bulls. As mentioned earlier, yesterday crude oil bounced off the short-term support line, which successfully stopped further deterioration in December. Therefore, if history repeats itself once again, we will likely see an upward correction in the coming day (or days). If this is the case, we will likely see an invalidation of the breakdown below the medium-term support line (marked in black on the weekly chart), which would be a strong bullish signal (especially if it materializes on relatively high volume). - Bearish scenario
If crude oil breaks below the short-term support line, we will likely see further deterioration and the first downside target will be the November 2013 low. If this support is broken, we will also likely see a drop below the neck line of the head and shoulders formation (marked on the weekly chart). Additionally, if crude oil breaks below the 61.8% Fibonacci retracement level (based on the entire Jun. 2012-Aug. 2013 rally) the current decline will likely accelerate.
Summary
The situation has deteriorated as crude oil dropped below the medium-term rising support line, which is also the lower border of the rising trend channel. However, the breakdown is not confirmed at the moment and yesterday light crude bounced off the short-term support line, which successfully stopped further deterioration in December. Additionally, the oil-stocks-to-oil ratio reached the strong resistance zone, which triggered a correction in the ratio in November and pushed the price of light crude higher. In case of the oil-to-oil-stocks ratio and also the oil-to-stocks ratio, we may see double bottom formations, which could trigger an upswing in crude oil. On top of that, crude oil priced in "other currencies" approached the long-term rising support line, which successfully stopped declines in April and also in November 2013.
Very short-term outlook: bearish
Short-term outlook: bearish
MT outlook: mixed
LT outlook: mixed
Bullish scenario: If the price of light crude increases above $96, we’ll consider opening long positions.
Bearish scenario: If crude oil drops below $90, we’ll suggest opening short positions.
Meanwhile, the biggest event of the recent weeks for oil stocks has been a rally which took the oil stock index to its fresh 2013 high. What’s important, with this upward move the XOI reached very important medium-term resistance line (which had successfully stopped growth earlier in the previous year). This strong resistance triggered a corrective move in the following days, but the XOI rebounded yesterday and erased most of the recent decline. If the buyers do not give up, we will likely see further improvement to at least the 2013 high. As mentioned earlier, the upper line of the smaller rising wedge (marked on the weekly chart) is slightly above this level and from today’s point of view, as long as the XOI remains below this line, space for further growth is limited. Nevertheless, if this resistance is broken, the next upside target will be the blue the medium-term resistance line based on the September 2012 and May 2013 highs (currently around 1,530).
On the other hand, we should keep in mind that the upper line of the rising wedge (marked with a bold red line on the weekly chart - currently around 1,468) keeps declines in check. However, if this support line is broken, the first downside target will be the medium-term rising support line based on the June and November 2012 lows, which successfully stopped declines in 2013 (currently around 1,440).
This completes this week’s Oil Investment Update. Our next Oil Investment Update is scheduled for Tuesday, Feb. 4, 2014. Oil Trading Alerts subscribers will additionally receive similar but shorter alerts on a daily basis (or more than once a day when the situation requires it). You – Oil Investment Updates subscribers – will receive short Investment Alert messages should the outlook for the medium or long term change before the next Update is posted.
Thank you.
Nadia Simmons
Forex & Oil Trading Strategist
Oil Investment Updates
Oil Trading Alerts

