
- Double Bottom in Crude Oil or Further Declines?
- Crude Oil
- Oil Stocks
- Crude Oil - Oil Stocks Link
- Ratio Analysis
- Oil Stocks – Stocks Link
- Summary
Double Bottom in Crude Oil or Further Declines?
Crude oil posted its sixth straight week of losses last week as rising inventories pushed light crude to its new monthly low of $92.51. In the previous week, crude oil lost 0.65% and dropped to the levels that we saw back in June. Despite this decline, light crude remains above important long-, medium- and short-term support. Although we saw a pullback on Thursday, it was too small to say that the situation had improved – which was confirmed by the price action that we saw in the following days.
Yesterday, light crude almost reached the November low and oil investors are probably wondering whether the final bottom of the recent corrective move is already in or not. In our previous Oil Investment Update, we considered the major factors which had an impact on the price of crude.
First of them was an increase in U.S. crude oil inventories. Although total U.S. crude oil inventories rose to the highest level for the end of October on EIA records since 1930, the increase in crude-oil stockpiles was less than analysts had expected, which didn’t have a negative impact on the price. However, in the previous week the situation deteriorated extremely after the U.S. Energy Information Administration (EIA) data showed a much-larger-than-expected rise in U.S. crude inventories. These developments confirm our last week’s assumption that investors should not push the sell button in a hurry after a message that the inventories rose, but rather focus on whether the data are better or weaker than expected.
Please note that the EIA said in its weekly report that crude oil supplies grew by 2.6 million barrels, far more than the 1 million barrels predicted by analysts. This was very bearish news, which pushed the price to its new five-month low. However, despite this drop, light crude quickly rebounded as investors digested the numbers which showed that gasoline inventories fell by 800,000 barrels, exceeding expectations for a 700,000-barrel draw. Gasoline stocks have dropped for five straight weeks and are at their lowest point since Nov. 23, 2012. These declining inventories bode well for crude oil, as refiners are expected to restart facilities after seasonal maintenance and begin to carve down an overhang in supply.
Just like a week ago, the second factor which had an important impact on light crude was the Fed and its stimulus program, which is viewed as a key driver in boosting the price of commodities as it tends to depress the value of the dollar.
As mentioned earlier, on Thursday crude oil hit a fresh monthly low. However, it quickly reversed course after Federal Reserve Chair Nominee Janet Yellen said that monetary stimulus tools shouldn't be removed too soon. Her comments gave oil a boost and crude gained 0.51% and closed the day slightly below $94 per barrel. Yellen told the Senate Banking Committee that the U.S. central bank's $85 billion in monthly bond purchases have and will continue to support the economy until more sustained recovery becomes evident, stressing the need not to yank the program out too soon.
Her comments weakened the dollar, which also came under pressure amid sentiments that even when the Fed begins to taper the pace of its monthly asset purchases, be it in December or in early 2014, monetary tightening is still a long way away. Keep in mind that the Fed's stimulus program could weaken the greenback by driving down interest rates to spur recovery, making oil an attractive buy on dollar-denominated exchanges (that is if other monetary authorities don’t print their fiat money at a faster pace than the Fed).
On Monday, oil investors focused on very different comments which fueled expectations the Federal Reserve could taper its bond buying program. Yesterday, crude prices fell quickly in early afternoon after William Dudley, the president of the Federal Reserve Bank of New York, said he was "getting more hopeful" on prospects for U.S. economic recovery. In addition, Charles Plosser, president of the Philadelphia Fed, said that improved economic and labor market conditions suggest the Fed should set a fixed dollar amount on its current bond-buying program and end the program when that amount is reached.
Although Fed Chairman-nominee Janet Yellen signaled last week that the central bank would need stronger evidence of economic growth before tapering, these two comments pushed the price of light crude to slightly above the November low. Looking at the recent price action in the oil market, investors are worried that the Fed's growing confidence in the U.S. economy could prompt the central bank to cut its bond buying which has been integral to some sharpest price gains in oil, gold and other commodities over the past three years. Therefore, they will scour Fed Chairman Ben Bernanke's speech and minutes of the central bank's October meeting on Wednesday for hints on when it might start paring its asset-buying program.
Investors also awaited news from a meeting beginning on Wednesday between Iran and world powers over ending its nuclear program that may provide insight on whether sanctions against Iran would be lifted and, if so, when.
As we wrote in our Oil Trading Alert on Nov. 12:
(…) according to the Energy Information Administration Iran's average oil and condensate exports fell to 1.53 million barrels a day in 2012 from 2.51 million barrels a day in 2011, due mainly to sanctions. Without a doubt, they have helped support prices by removing more than 1 million barrels per day (bpd) of oil from world markets. They have also hobbled Iran's ability to keep its oil and gas infrastructure in good repair and start up new projects, making it hard to meet local gas demand.
Taking the above into account, investors worry that any deal for Iran to curb its nuclear activities could allow some of that oil to be sold, depressing a market that is already well supplied. On Monday, U.S. Secretary of State John Kerry said that he had no specific expectations about world powers reaching a deal with Iran during the talks, but it seems that another round of "tough" talks in Geneva will weight on the price in the following days.
Crude Oil
Having discussed the above, let’s now move on to the technical part of this week‘s Oil Investment Update and focus on the technical changes in the crude oil market. Just like a week ago, we take a look at charts in different time horizons to have a more complete picture of the current situation in the market.
Let’s start with a look at the monthly chart of light crude (charts courtesy by http://stockcharts.com).
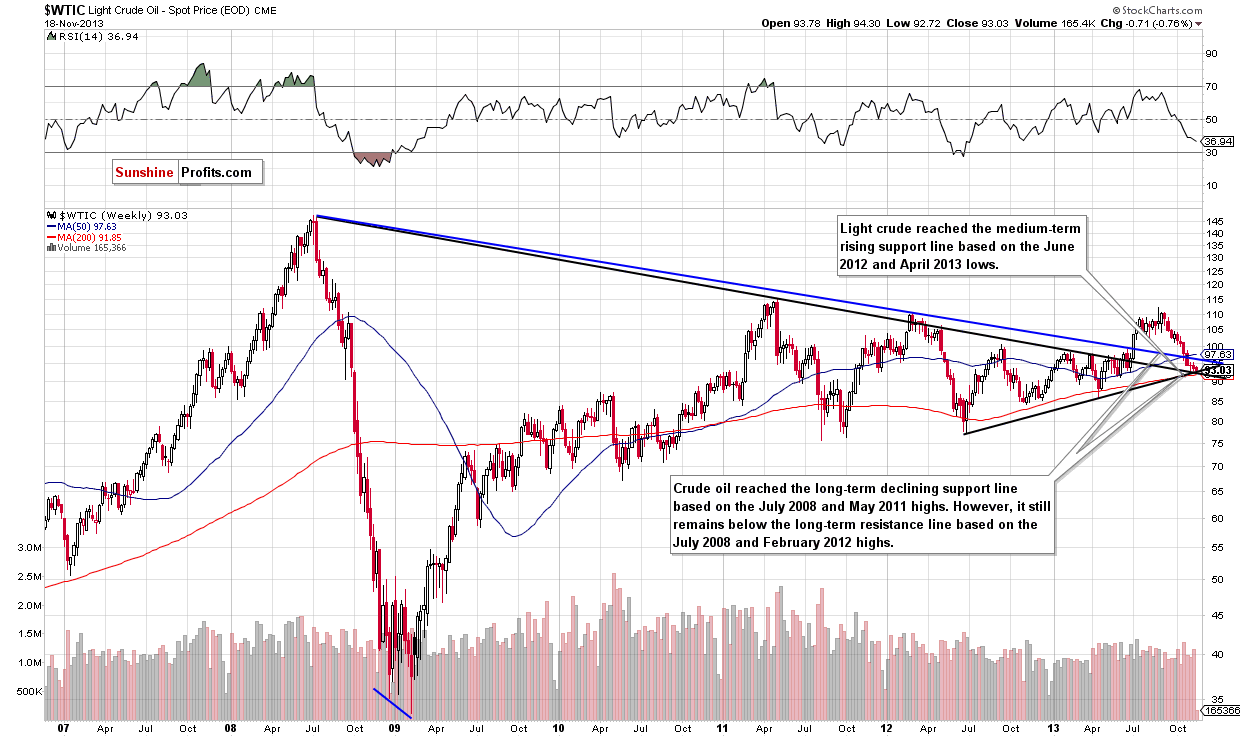
The situation in the long-term chart hasn’t changed much recently, and crude oil still remains between two long-term declining support/resistance lines. When we take the blue one (based on the July 2008 and February 2012 highs) into account, we see that the breakdown below this line is confirmed, which is a strong bearish signal.
On the other hand, if we take into account the black long-term support line (based on the July 2008 and May 2011 highs), we see that light crude still remains above it and the situation is not as bearish as it might seem at first glance.
From this perspective, the picture is still unclear.
Now, let’s zoom in on our picture of the oil market and see the weekly chart.
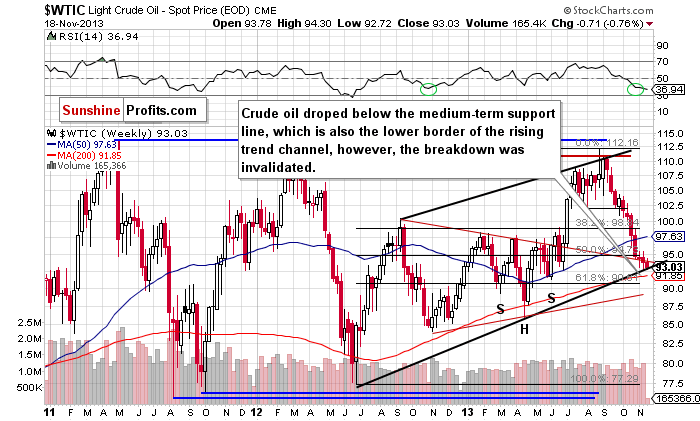
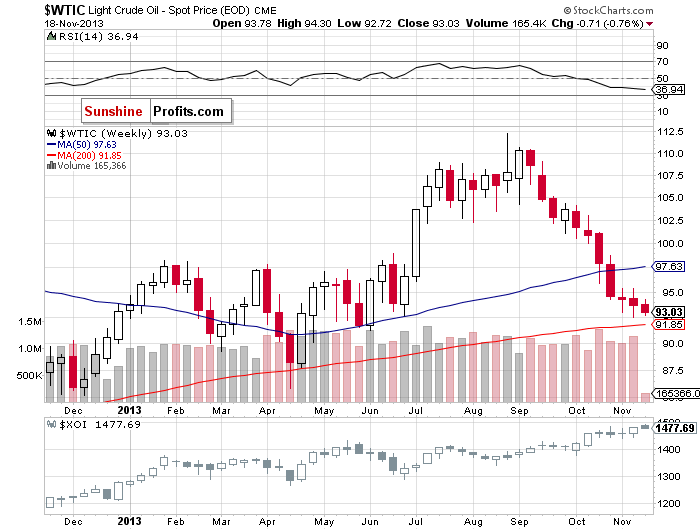
Looking at the above chart, we see that after an increase at the beginning of the previous week, the price rose to a weekly high of $95.38. However, this improvement was only temporary. In the following days crude oil declined heavily and hit a new monthly low of $92.51. With this downward move, light crude re-tested the strength of the medium-term support line (marked with the black bold line). As you can see on the above chart, in spite of this drop, oil bulls managed to push the price higher and crude oil closed the week above the lower border of the rising trend channel.
On Monday, we saw another attempt to move lower, but oil bears failed. If the strong support doesn’t encourage buyers to act, we may see a drop to the 200-week moving average or even to the 61.8% Fibonacci retracement level based on the entire 2012-2013 rally.
However, when we factor in the position of the RSI, we notice that the indicator has extended declines and dropped to its lowest level since October 2012. Back then, such a low reading on the RSI preceded a move up in crude oil. If history repeats itself once again, we may see further increases to at least the 50-week moving average (currently at $97.48).
Now, let’s check the short-term outlook.
Quoting our last Oil Investment Update:
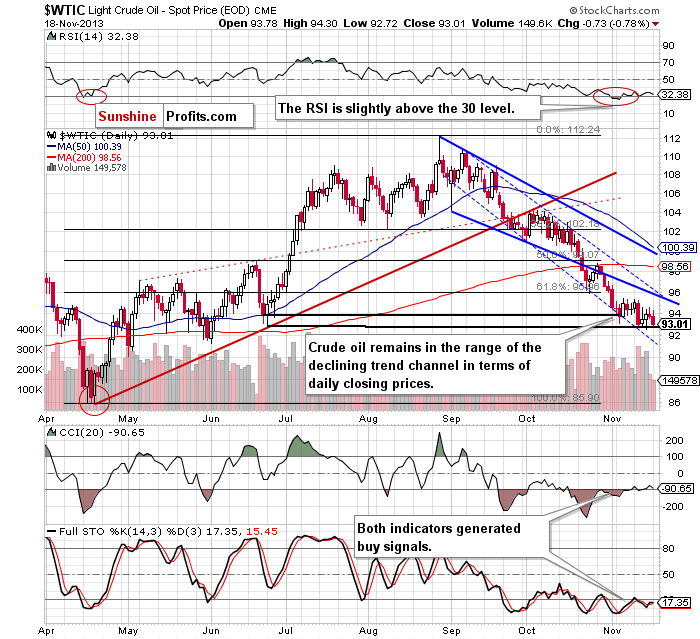
(…) crude oil bounced off the lower border of the declining trend channel in terms of daily closing prices (marked with the blue dashed line) – similarly to what we saw at the beginning of October and, then again, at the end of the previous month. Although this support line prevented further declines, we didn’t see a sharp pullback in the following days and light crude was trading in a narrow range.
As you can see on the above chart, oil bulls didn’t manage to push crude oil above the upper border of the consolidation created by the Nov. 6 high. This show of weakness encouraged sellers to trigger another downswing, which resulted in a breakdown below the November low, and light crude hit a fresh monthly low of $92.86. Although crude oil rebounded on the following day, oil bears showed their claws on Thursday once again and pushed the price to a new monthly low of $92.51.
Please note that with this downward move, light crude reached the lower border of the declining trend channel in terms of daily closing prices (marked with the red dashed line) once again. At the same time, we noticed a small breakdown below the bottom of the corrective move that we saw back in June (in terms of intraday lows). In spite of this drop, crude oil quickly bounced off this level and the breakdown was invalidated.
As we wrote in our Friday’s Oil Trading Alert:
(…) an invalidation by itself is a bullish signal. Additionally, Thursday’s increase materialized on relatively big volume, which is another bullish sign. When we take a closer look at the position of the RSI, we notice that it still remains slightly above the 30 level. Taking this fact into account, we have a positive divergence between the indicator and the price of light crude, which is also a bullish sign.
Despite these positive circumstances, we didn’t notice further improvement on Friday. Additionally, yesterday crude oil dropped to slightly above the November low, which is not a positive signal for oil bulls.
Please note that as long as crude oil remains below the strong resistance zone created by the Nov. 6 high, the lower border of the declining trend channel in terms of intraday lows (marked with the blue bold line) and the upper border of the declining trend channel in terms of daily closing prices (marked with the blue dashed line), a bigger pullback is unlikely.
On the other hand, we should keep in mind that buy signals generated by the Commodity Channel Index and Stochastic Oscillator in the previous week remain in play and support the bullish case.
Summing up, looking at the above charts, we clearly see that there are bullish factors, which still support buyers. Crude oil remains above the long- and medium-term support lines. Additionally, the lower border of the declining trend channel in terms of daily closing prices and the bottom of the corrective move that we saw in June still serve as support. On top of that, the RSI remains slightly above the 30 level and buy signals generated by two other indicators in the previous week are still in play. All the above provide us with bullish implications and, from this point of view, a move to the upside is still likely to be seen. However, taking into account the size of the recent pullback and yesterday’s drop, it’s too early to assume that the final bottom of the recent corrective move is already in.
Having discussed the current outlook for crude oil, let’s examine the NYSE Arca Oil Index (XOI) to find out what the current outlook for oil stocks is and to check if they confirm or invalidate the above analysis of the crude oil market.
Oil Stocks
Just like a week ago, we begin with the long-term chart.
On the above chart, we see that the situation has improved recently.
Quoting our previous Oil Investment Update:
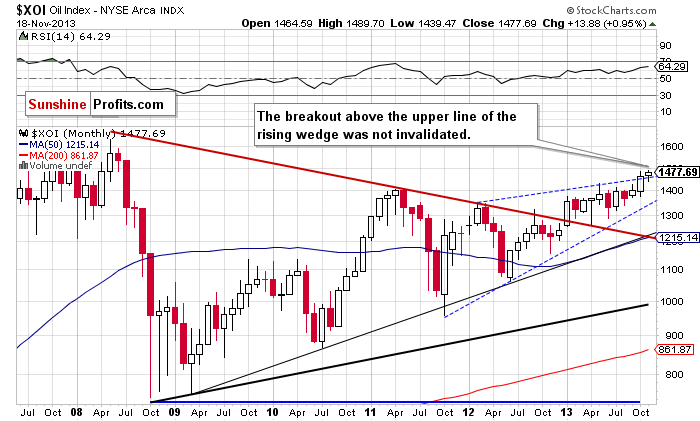
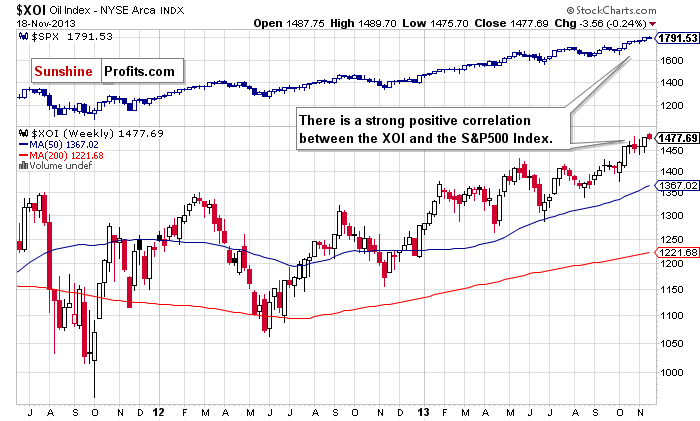
(…) The XOI remains above the upper line of the rising wedge. The breakout, however, is not yet confirmed (…) in this area there’s a very important Fibonacci retracement level - 78.6% (close to 1,467) based on the entire May-October 2008 decline, which may slow the rally. However, if the buyers don’t give up and manage to push the oil stock index above this resistance, we will likely see further growth.
Looking at the above chart we see that the breakout above the 78.6% retracement level encouraged buyers to act and resulted in a new 2013 high at 1,489. From this point of view the situation is very bullish.
To see the current situation more clearly, let’s zoom in on our picture and move on to the weekly chart.
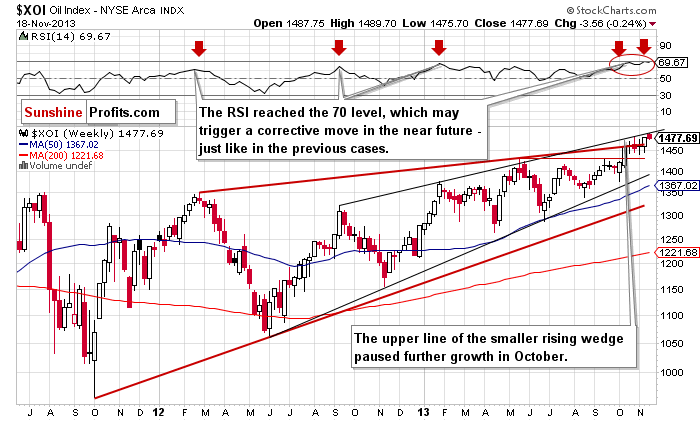
Looking at the above chart, we see that the oil stock index bounced off the bottom of the recent corrective move in the previous week, which resulted in a sharp pullback. With this upward move, the XOI came back slightly below the October high. On Monday, we saw further improvement and the oil stock index climbed to a fresh 2013 high at 1,489. In spite of this growth, the breakout above the previous high is not confirmed.
Please note that the upper line of the smaller rising wedge (marked with the black line), which successfully stopped growth at the end of October, is still in play. As you can see on the weekly chart, the XOI remains below this line, which serves as resistance (currently around 1,495). Additionally, the RSI moved above the 70 level, which may trigger a corrective move in the near future – similarly to what we saw in the previous months.
Nevertheless, from the technical point of view, the medium-term uptrend is not threatened at the moment, and the situation remains bullish.
Now, let’s turn to the daily chart.
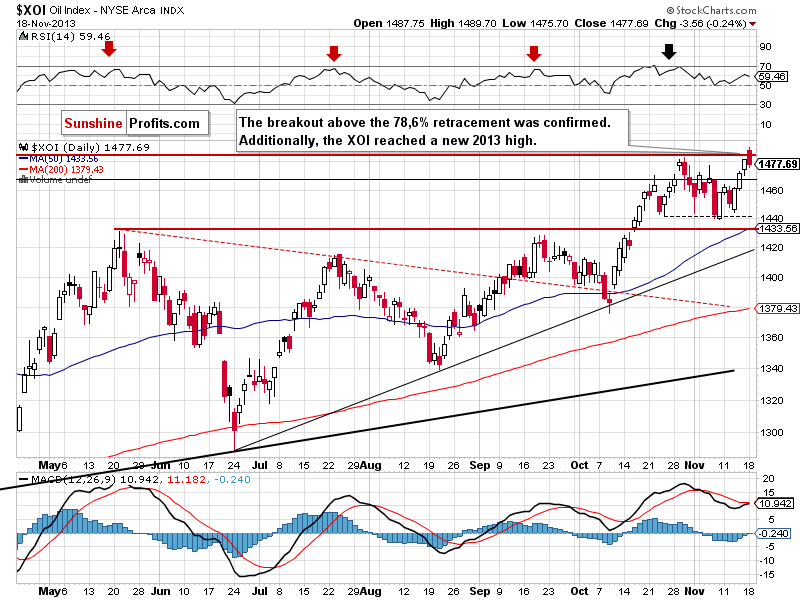
Looking at the above chart, we see that the oil stock index didn’t manage to break above the 78.6% retracement at the beginning of the previous week, which resulted in a decline in the following days. As you see on the daily chart, this downward move took the XOI slightly above the bottom of the recent corrective move. On Wednesday, this support level encouraged buyers to act, which resulted in a pullback. In this way, the oil stock index broke above the 78.6% Fibonacci retracement level and almost reached the 2013 high on Friday.
On Monday, we saw further improvement, and the XOI hit a new annual high at 1,489. However, after this positive event, we saw a correction, which pushed the oil stock index slightly below the previously-broken high. In spite of this drop, the breakout above the 78.6% retracement level was confirmed, which is a strong bullish sign.
Summing up, from the long-, medium- and short-term perspectives, the outlook for oil stocks remains bullish and the uptrend is not threatened at the moment. However, taking into account the combination of a strong resistance level (the upper line of the rising wedge) and the position of the RSI, we should keep an eye on the oil stock index because the sellers may lock profits and trigger another correction in the coming days.
Crude Oil - Oil Stocks Link
Having discussed the current situation in crude oil and the oil stock index, let’s comment on the relationship between them.
When we take a look at the above chart and compare the price action in both cases, we clearly see that oil stocks were stronger in the previous week. They bounced off the bottom of the recent corrective move, pulled back and approached the 2013 high on Friday. What happened with the price of crude oil at the same time? Light crude declined once again and reached a new monthly low of $92.51. On top of that, on Monday the oil stock index climbed up once again and hit a fresh annual high. Meanwhile, crude oil lost almost 1% and declined to slightly above the November low. This price action clearly showed its weakness in relation to oil stocks.
Ratio Analysis
Once we know the current relationship between crude oil and oil stocks, let’s take a closer look at the oil-stocks-to-oil ratio. Today, we begin with the long-term chart.
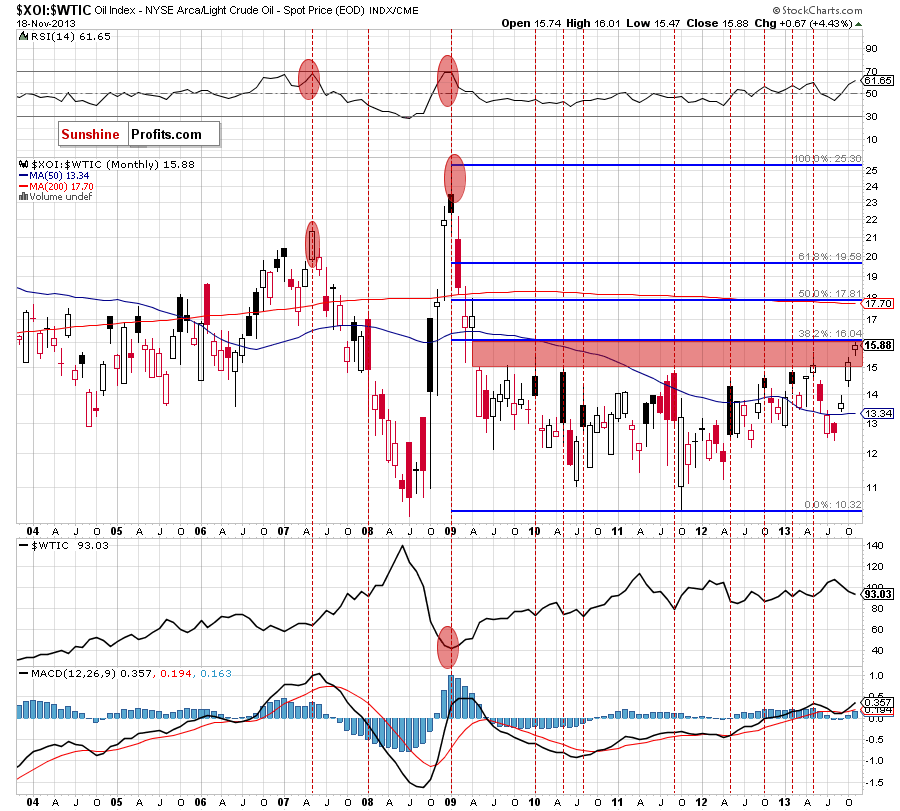
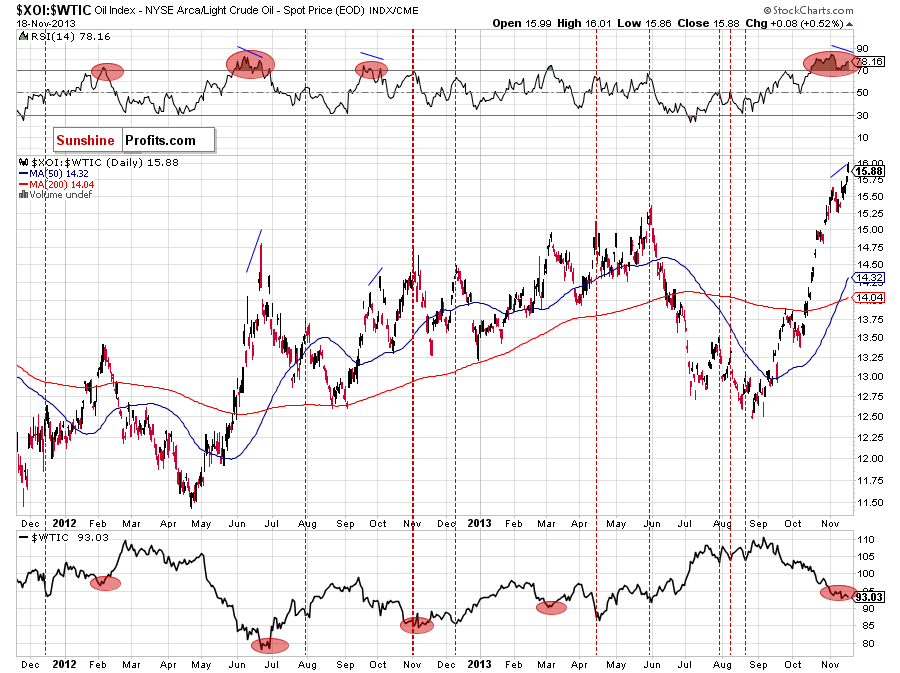
The first thing that catches the eye on the above chart is a strong negative correlation between the ratio and the price of light crude. When we go back to 2008, we clearly see that the annual high in crude oil was in perfect tune with the ratio’s 2008 low. We could see this strong relationship also in 2009, when the annual low in crude oil corresponded to the ratio’s 2009 high (marked with a red ellipse). In the following months, the ratio declined heavily, which led to higher oil prices.
What’s interesting, the ratio’s 2010 high was in tune with the bottom of the corrective move that we saw in crude oil. We noticed similar price action in September 2011, May, August and October 2012, and February and May 2013.
Looking at the above chart, we see that the ratio remains in the gap between the April 2009 low and May 2009 high (marked with the red rectangle). In all previous cases, such position of the ratio triggered a correction, which resulted in higher prices of light crude. Additionally, the ratio has approached the 38.2% Fibonacci retracement level (based on the entire 2009-2011 decline), which is a strong resistance level.
Taking the above into account, if history repeats itself once again and the ratio declines, we will likely see the bottom of the current correction.
Now, let’s zoom our picture and examine the weekly chart.

Looking at the above chart, we see the same price action - most of the ratio’s tops have corresponded to the crude oil’s lows. Additionally, the RSI has moved above the 70 level. We saw such situations in 2008, 2011 and again in 2012. Back then, such a high reading on the RSI preceded a move down in the ratio and an upward move in crude oil. If history repeats itself once again, we may see a pullback in crude oil in the near future. When we factor in the position of the CCI, we clearly see that the indicator is extremely overbought, which is another bearish signal for the ratio.
Now, let’s check the short-term outlook.
On the above chart, we see that the ratio has rallied since September, which is in perfect tune with declines in crude oil. In the recent days, the ratio has moved higher once again and hit a new 2013 high. Despite this increase, we haven’t noticed a new high in case of the RSI. When we take a closer look at the above chart, we clearly see a negative divergence between the ratio and the position of the indicator.
At this point, it’s worth mentioning that there were similar situations in the past – for example in June and October 2012. Back then, such divergences preceded declines in the ratio and had a positive impact on crude oil.
Please note that earlier this year, lower readings on the RSI triggered downswings in the ratio and indicated the bottoms of correction moves. Taking the above facts into account, we can assume that the final bottom of the current correction is just around the corner.
Oil Stocks – Stocks Link
Before we summarize, we would like to focus on the relationship between oil stocks and the general stock market once again. Let’s start with the weekly chart.

Quoting our previous Oil Investment Update:
(…) there were periods of time when the S&P 500 index was stronger than the oil stock index. Such price action was clearly visible in September 2012. Back then, stocks managed to break above the previous 2012 top, but oil stocks only erased 90% of earlier losses. This divergence triggered a decline in both indices (…) Another similar situation occurred in July 2013.
Looking on the above chart, we see that there was similar price action in the previous week. The S&P500 index broke above the previous high and hit a fresh all-time high. Meanwhile, although the XOI moved higher it only moved slightly below the 2013 high.
Nevertheless, on Monday we saw further improvement and both indices hit their new 2013 high. However, after that they declined. Will we see further deterioration?
To find some clues, let’s zoom in or picture and examine the short-term picture.
On the above chart, we see that a strong positive correlation remains in place on a short-term basis. At the beginning of the previous week, both indices corrected earlier increases. After that correction (which was shallower on the S&P500 chart), we saw a sharp pullback on Wednesday. However, in case of the S&P 500 this upswing was visibly stronger and resulted in a new 2013 high. Although we saw further improvement in both indices in the following days, the XOI remained weaker in relation to the S&P500 until the end of last week. As mentioned earlier, the oil stock index didn’t manage to break above the previous high.
Despite this negative divergence between both indices, on Monday we saw a continuation of the rally and they climbed to their highest levels in 2013. However, after that we saw declines. At this point, it’s worth mentioning last week’s question:
Is it possible that this negative divergence between them will trigger another corrective move in both indices – similarly to what we have seen in the past on the weekly chart?
Taking into account the relationship described above, it seems important to discuss the current situation in the general stock market. The weekly chart of the S&P 500 index was featured in our latest Premium Update and you will find it below:
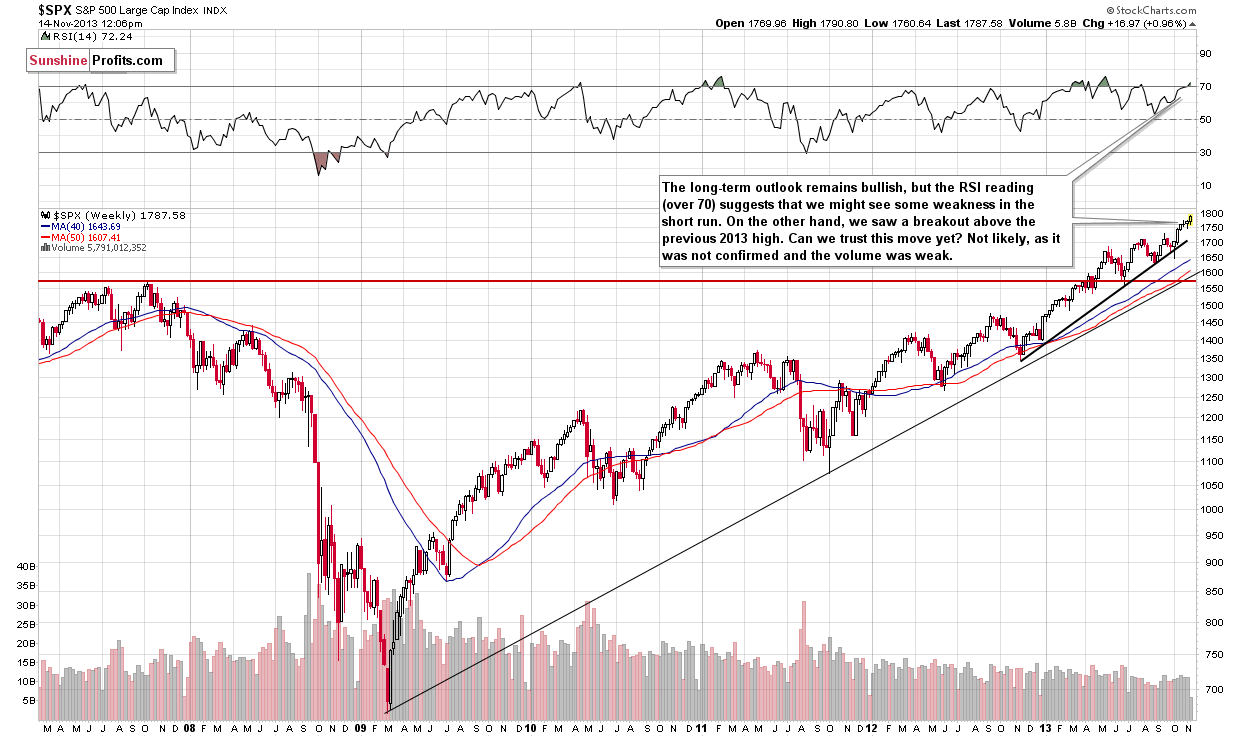
Stocks finally declined yesterday and it might very well be the case that the 2-week decline that is likely to take place this month due to the True Seasonal patterns has just started. Based on the most recent correlation values from our Correlation Matrix, such a decline would likely impact mining stocks more than metals, but based on what we've seen in the past few days, it seems that silver could be affected as well.
Summing up, since the general stock market moved decisively yesterday, we might have just seen the beginning of the 2-week decline suggested by True Seasonals.
Summary
Looking at all charts of light crude, we see that the situation hasn’t changed much since our last Oil Investment Update was published. Although crude oil hit a new monthly low in the previous week, it still remains above very important support levels created by the long-, medium, and short-term support lines. Additionally, buy signals generated by the daily CCI and Stochastic Oscillator in the previous week are still in play.
The oil-stocks-to-oil ratio is oversold (not only on a short-term basis, but also from the medium-term perspective) as indicated by the RSI. Additionally, it reached a strong resistance zone created by the gap between the April 2009 low and May 2009 high (marked with the red rectangle on the monthly chart) and reinforced by the September 2009 high, which may trigger a correction in the ratio and an upward move in crude oil in the near future.
All the above provide us with bullish implications and, from this point of view, a move to the upside is still likely to be seen. However, taking into account the fact that we haven’t seen a bigger pullback and considering yesterday’s drop, in our opinion it’s still too early to assume that the final bottom of the recent corrective move is already in.
The biggest event of the recent days, in case of oil stocks, has been the sharp pullback, which took the XOI not only above the previously-broken 78.6% Fibonacci retracement level, but also pushed the oil stock index to a new 2013 high at 1,489. At this point it’s worth noting that although we’ve seen a rally in the recent days, the oil stock index hasn’t managed to break above the upper line of the smaller rising wedge (marked with the thin black line on the weekly chart). As mentioned earlier, this line stopped growths in October and triggered a correction. If history repeats itself this time, we may see similar price action in the coming days. Therefore, it seems that as long as the oil stock index remains below this level, further increases are limited – especially when we factor in a tight link between oil stocks and the general stock market.
In this case, if the negative correlation between the WTI and XOI remains in place, we may see further improvement in light crude. Please note that this scenario is in tune with the medium-, short-term picture and the position of the oil-stocks-to-oil ratio.
Very short-term outlook: bearish
Short-term outlook: bearish
MT outlook: bearish
LT outlook: unclear
Trading position (short-term): Taking into account the medium- and short-term picture, and the position of the indicators, we do not suggest opening any positions yet.
This completes this week’s Oil Investment Update. Our next Oil Investment Update is scheduled for Tuesday, Nov. 26, 2013. Oil Trading Alerts subscribers will additionally receive similar but shorter alerts on a daily basis (or more than once a day when the situation requires it).
Thank you.
Nadia Simmons
Sunshine Profits' Crude Oil Expert
Oil Investment Updates
Oil Trading Alerts

