
After five weeks of declines, crude oil hit a fresh monthly low of $ 93.07. With this downward move, light crude reached important long-, medium- and short-term support. Although we’ve seen an improvement in the recent days, investors are probably wondering whether the final bottom of the recent corrective move is already in or not. In our previous Oil Investment Update we considered the major factors which had an impact on the price of crude. Back then they were clearly bearish and triggered further declines.
As a reminder, crude oil has traded lower as traders view the market as adequately supplied. The selloff in crude oil has been fueled by rising U.S. stockpiles as refiners have curbed their crude processing amid seasonal maintenance work and waning gasoline demand. However, last Wednesday, after the U.S. Energy Information Administration said in its weekly report that U.S. crude oil inventories rose by 1.6 million barrels in the week ended Nov. 1, we saw increases and crude oil gained 1.31%. Although total U.S. crude oil inventories rose to the highest level for the end of October on EIA records since 1930, the increase in crude-oil stockpiles was less than analysts had expected. Therefore, from this point of view, investors should not push the sell button in a hurry after the message that the inventories rose, but focus on whether the data are better or weaker than expected.
An additional bullish factor was a bigger than expected drop in stocks of distillate fuel, comprising diesel and heating oil. Stocks fell to the lowest level since May 3 as implied demand was reported at the highest level since mid-February 2008. These declining inventories of refined products bode well for crude oil, as refiners are expected to restart facilities after seasonal maintenance and begin to carve down an overhang in supply.
Just like a week ago, the second factor which had an important impact on light crude was the U.S. economic data. On Thursday, official data showed that the American economy grew in the third quarter at the quickest pace in a year. The U.S. economy grew at an annual rate of 2.8% in the three months to September, well above expectations for growth of 2%.
On the following day, the Labor Department said that U.S. payrolls advanced by 204,000 jobs last month, well above economists' forecast for a gain of 120,000. Readings for the prior two months were revised up by a total of 60,000, putting average job creation over the three-month span above a 200,000 pace, matching the strong gains recorded early in the year. Additionally, private-sector employers added 212,000 jobs in October, the strongest gain since February, suggesting companies didn't curtail hiring in the face of Washington turmoil.
The nation's unemployment rate, obtained through a separate survey of households, rose slightly to 7.3% from 7.2% in September. The small increase reflects employees who were furloughed during a 16-day shutdown but have since returned to work.
Positive data added to ongoing speculation that the Fed may start tapering its stimulus program, which is viewed as a key driver in boosting the price of commodities as it tends to depress the value of the dollar. Therefore, a cutback in stimulus by the Fed later this year would reduce the supply of dollars and make dollar-denominated assets such as oil more expensive for holders of other currencies. From this point of view, it would be a strong bearish factor for crude oil. On the other hand, stronger than expected figures suggest economic improvement, raising the prospect for stronger oil demand in the world's biggest energy consumer, and laying the groundwork for higher prices.
As you are going to see later on the daily chart, the recent days have formed a consolidation and crude oil has been trading in a narrow range, which is reflecting the indecision of traders.
Before we jump to the world of charts, please note that yesterday the price of light crude gained 0.71% after the West's failure to reach a nuclear deal with Iran reignited worries about Middle East crude supplies. Negotiations will resume on a lower-level on Nov. 20. While some diplomats believe a deal is still possible, U.S. lawmakers are trying to tighten sanctions on Iran which could push oil prices even higher.
Crude Oil
Having discussed the above, let’s now move on to the technical part of this week‘s Oil Investment Update and focus on the technical changes in the crude oil market. Just like a week ago, we take a look at charts in different time horizons to have a more complete picture of the current situation in the market.
Let’s start with a look at the monthly chart of light crude (charts courtesy by http://stockcharts.com).
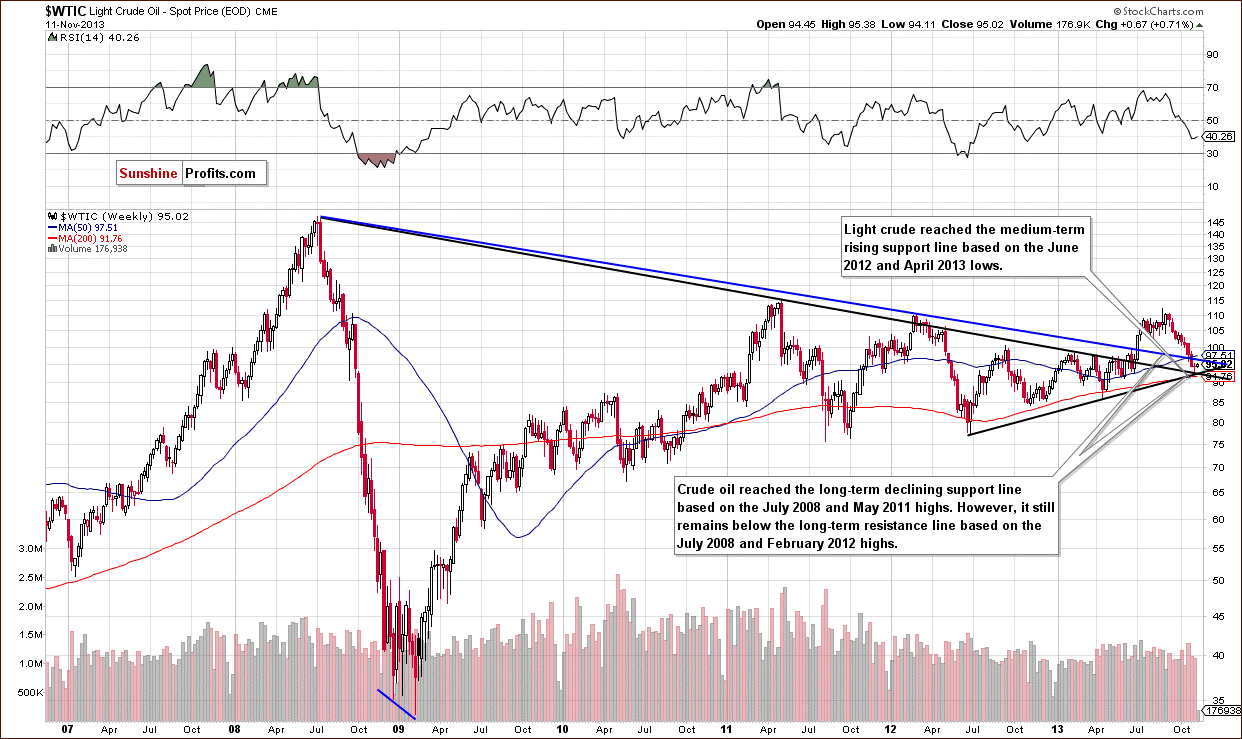
The situation in the long-term chart hasn’t changed much recently, and crude oil still remains between two long-term declining support/resistance lines. Therefore, what we wrote in our previous Oil Investment Update is still up-to-date today.
(…) the blue one is based on the July 2008 and February 2012 highs. When we take this line into account, we see that crude oil broke below it in the previous week, which is a bearish sign. However, if we take into account the black long-term support line (based on the July 2008 and May 2011 highs), we see that light crude still remains above it and the situation is not that bearish.
From this perspective, the picture is still unclear.
Now, let’s zoom in on our picture of the oil market and see the weekly chart.
Quoting our previous Oil Investment Update:
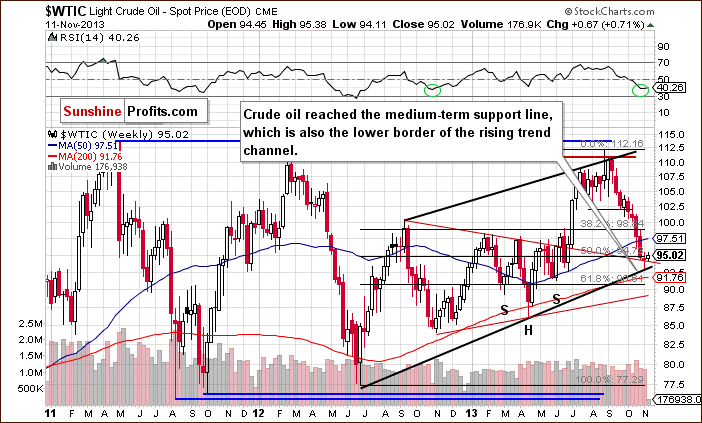
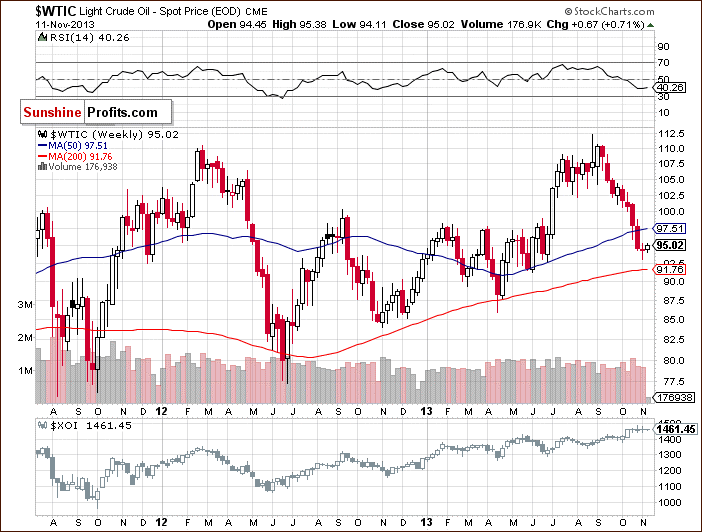
(…) the price reached the medium-term support line based on the September 2012 and January 2013 highs. If this support line encourages oil bulls to act, we may see a pullback in the near future. On the other hand, if they fail and crude oil declines once again, the next target for the sellers will be the medium-term rising support line based on the June 2012 and April 2013 lows (currently around $93 per barrel).
As you see on the above chart, we actually saw such price action in the previous week. After a drop below the medium-term support line based on the September 2012 and January 2013 highs, crude oil bounced off the medium-term support line, which is also the lower border of the rising trend channel. In this way, the breakdown below the support line was invalidated, which is a bullish sign. Additionally, on Monday, light crude came back above the previously-broken the 50% Fibonacci retracement level.
When we factor in the position of the RSI, we notice that the indicator dropped to its lowest level since October 2012. Back then, such a low reading on the RSI preceded a move up in crude oil. If history repeats itself once again, we may see further increases to at least the 50-week moving average (currently at $97.51).
Now, let’s check the short-term outlook.
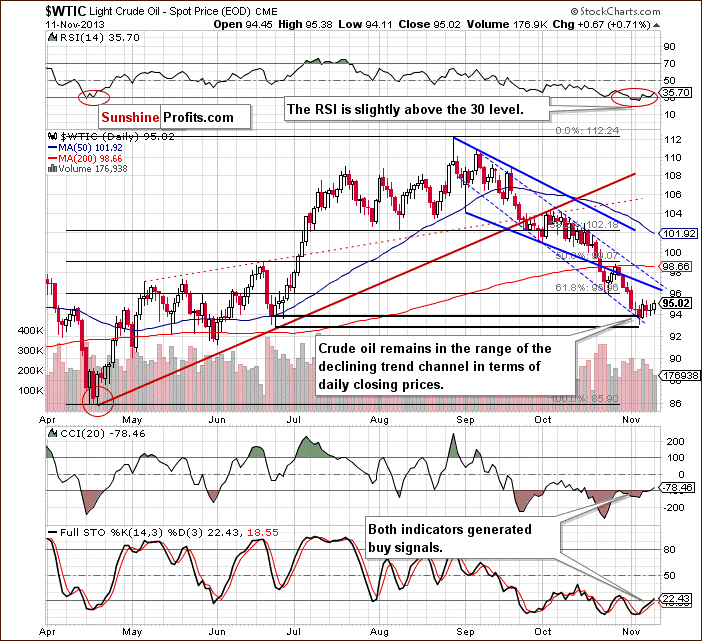
Last Tuesday, crude oil dropped below $94 and hit a new monthly low of $93.07. With this downward move, light crude reached a support level based on the bottom of the corrective move that we saw back in June (in terms of daily closing prices). Additionally, it reached the medium-term rising support line based on the June 2012 and April 2013 lows and the long-term support line based on the July 2008 and May 2011 highs. On top of that, the RSI declined once again and dropped below the 30 level to its lowest level since April.
The combination of all the above facts encouraged oil bulls to act and resulted in a pullback, which took the price of light crude slightly below $95. With this upward move, crude oil bounced off the lower border of the declining trend channel in terms of daily closing prices (marked with the blue dashed line) – similarly to what we saw at the beginning of October and, then again, at the end of the previous month. Although this support line prevented further declines, we didn’t see a sharp pullback in the following days and light crude was trading in a narrow range.
As you can see on the above chart, the recent days have formed a consolidation. Therefore, if the oil bulls push crude oil above last Wednesday’s top, we will likely see an upward move to the lower border of the declining trend channel (in terms of intraday lows – marked with the bold blue line) – currently around $96.44.
At this point, the position of the indicators is worth mentioning. The RSI bounced off the 30 level, which is a positive sign. Additionally, the Commodity Channel Index and Stochastic Oscillator generated buy signals. These positive circumstances should encourage buyers to realize the pro-growth scenario. However, if they fail, oil bears will likely test the strength of the November low, which currently intersects with the lower border the declining trend channel (in terms of daily closing process – marked with the blue dashed line).
Summing up, when we take into account the medium- and short-term picture, we see that there are positive factors supporting the bullish case. Firstly, crude oil reached the long- and medium-term support lines, which may trigger a bigger pullback. Additionally, the lower border of the declining trend channel in terms of daily closing prices and the bottom of the corrective move that we saw in June (also in terms of daily closing prices) still serve as support. On top of that, the RSI bounced off the 30 level and two other indicators generated buy signals. All the above provide us with bullish implications and, from this point of view, a move to the upside is still likely to be seen. However, it’s still too early to assume that the final bottom of the recent corrective move is already in.
Having discussed the current outlook for crude oil, let’s examine the NYSE Arca Oil Index (XOI) to find out what the current outlook for oil stocks is and to check if they confirm or invalidate the above analysis of the crude oil market.
Oil Stocks
Just like a week ago, we begin with the long-term chart.
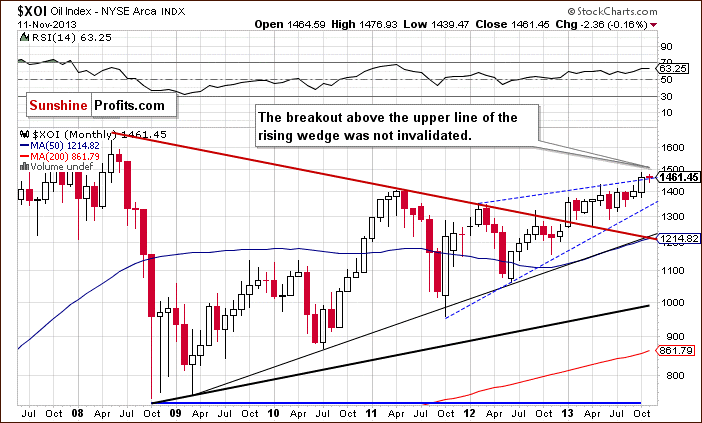
On the above chart, we see that the situation hasn’t changed much. In spite of the recent decline, the XOI remains above the upper line of the rising wedge. The breakout, however, is not yet confirmed.
Quoting our previous Oil Investment Update:
(…) in this area there’s a very important Fibonacci retracement level - 78.6% (close to 1,467) based on the entire May-October 2008 decline, which may slow the rally. However, if the buyers don’t give up and manage to push the oil stock index above this resistance, we will likely see further growth.
The XOI still remains above the previously-broken long-term declining resistance line based on the 2008 and 2011 highs and the breakout hasn’t been invalidated. Therefore, taking these observations into account, the situation is very bullish.
To see the current situation more clearly, let’s zoom in on our picture and move on to the weekly chart.
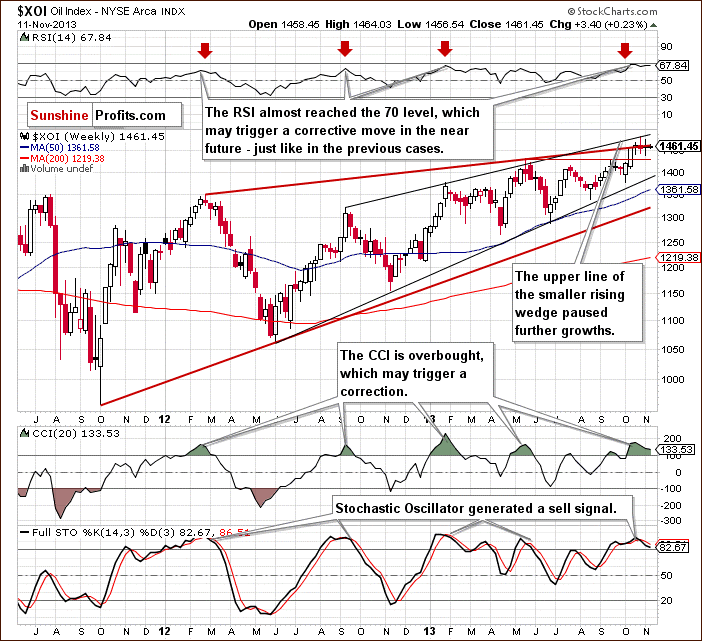
Looking at the above chart, we see that the upper line of the smaller rising wedge (marked with the black line) successfully stopped further growth and the oil stock index didn’t manage to continue its rally in the previous week. This show of weakness resulted in a decline, which took the XOI to the bottom of the recent corrective move. In spite of this drop, we saw a pullback and the oil stock index closed the week at the previously-broken upper line of the rising wedge (marked with the red line). Taking into account the fact that the weekly opening and closing price are similar, we can see on the above chart another doji candlestick, which is (according to theory) reflecting the indecision of traders.
We should still keep in mind that the RSI almost reached the 70 level, which may trigger a corrective move in the near future – similarly to what we saw in the previous months. Another factor which prescribes caution is the position of the CCI and Stochastic Oscillator. The first of them is overbought and the latter generated a sell signal.
Nevertheless, from the technical point of view, the medium-term uptrend is not threatened at the moment, and the situation remains bullish.
Now, let’s turn to the daily chart.
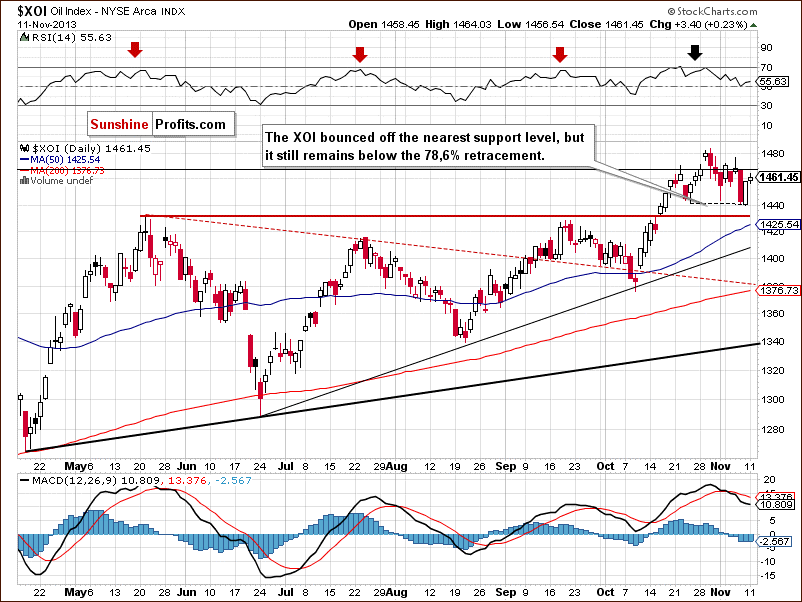
Looking at the above chart, we see that at the beginning of the previous week there were two attempts to come back above the 78.6% Fibonacci retracement level (close to 1,467) based on the entire May-October 2008 decline. However, they both failed and the XOI declined to the bottom of the recent corrective move. On Friday, this support level encouraged buyers to act, which resulted in a pullback. On Monday, we saw further improvement, but in spite of this growth, the oil stock index didn’t move above the 78.6% retracement, which still serves as strong resistance. Therefore, it seems that as long as the XOI remains below this level, further increases are limited.
Please note that MACD generated a sell signal for the first time since the beginning of October. We also saw similar situations at the end of May and at the beginning of August. In all previous cases the result was further deterioration. If history repeats itself once again we will likely see another corrective move in the coming days.
Summing up, from the long- and medium-term perspectives the outlook for oil stocks remains bullish and the uptrend is not threatened at the moment. However, taking into account the combination of a strong resistance, the position of the RSI and the short-term picture, we should keep an eye on the oil stock index because the sellers may trigger another correction in the coming days.
Crude Oil - Oil Stocks Link
Having discussed the current situation in crude oil and the oil stock index, let’s comment on the relationship between them.
Looking at the above chart, we clearly see that oil stocks remained quite close to the 2013 high in the previous week. In spite of the drop that we have seen in the recent days, they have been trading between the bottom of the last corrective move and the 2013 high. At the same time, crude oil declined once again and reached a new monthly low of $93.07. Although we saw some improvement in the recent days, crude oil remains visibly weaker in relation to oil stocks.
Ratio Analysis
Once we know the current relationship between crude oil and oil stocks, let’s take a closer look at the oil-to-oil-stocks ratio.
Quoting our previous Oil Investment Update:
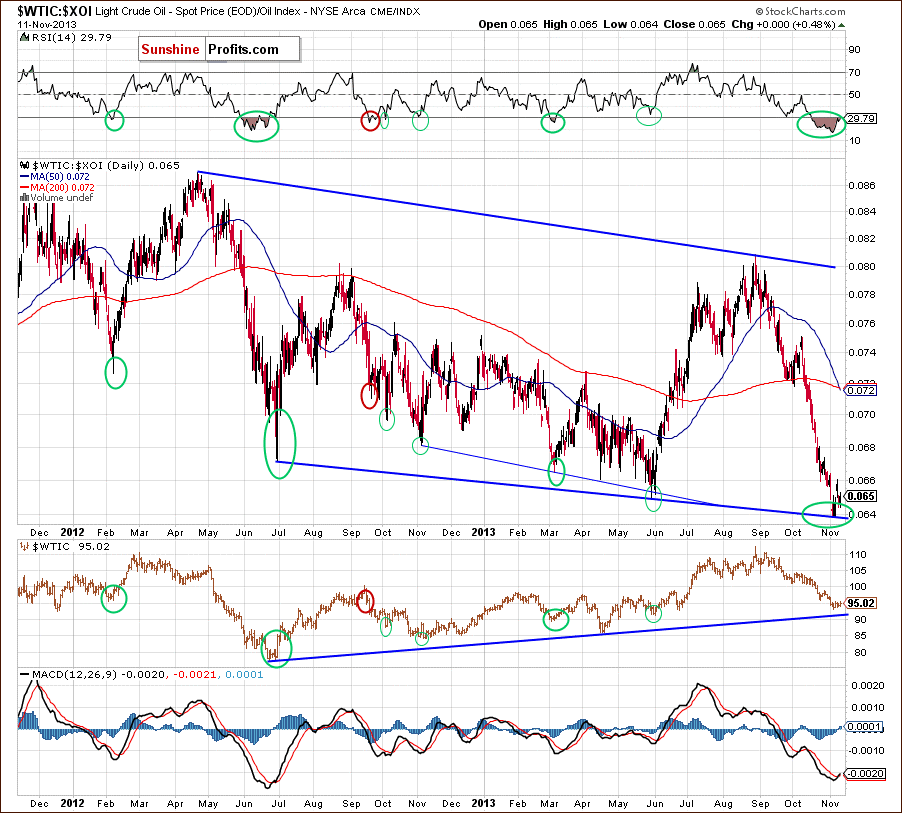
(…) in the recent days, the ratio has dropped to the long-term support line, which is an important support level. Taking into account the price action that we’ve seen in the past, it seems that a bigger pullback in crude oil is just around the corner. If history repeats itself once again, higher levels of the ratio will likely trigger a pullback in crude oil in the following days as well.
Looking at the above chart, we see that the ratio bounced off the above-mentioned long-term support line, which, according to assumptions, resulted in higher prices of light crude in the previous week. Please note that the RSI is still oversold, therefore higher levels of the ratio and further improvement in case of crude oil should not surprise us. Additionally, after the MACD dropped to its lowest level since June 2012, it generated a buy signal, which is another bullish factor.
Oil Stocks – Stocks Link
Before we summarize, we would like to focus on the relationship between oil stocks and the general stock market. Let’s start with the weekly chart.
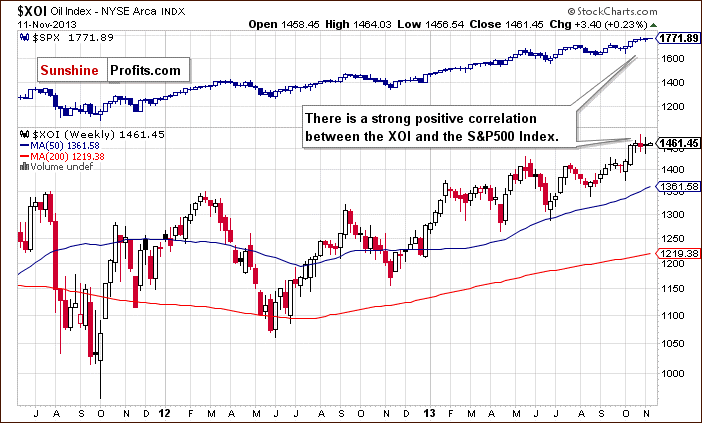
Looking at the above chart, we clearly see that the XOI and the S&P 500 have generally moved together in the recent years. However, there were periods of time when the S&P 500 index was stronger than the oil stock index. Such price action was clearly visible in September 2012. Back then, stocks managed to break above the previous 2012 top, but oil stocks only erased 90% of earlier losses. This divergence triggered a decline in both indices, but after this correction they continued their rally in the following weeks. Another similar situation occurred in July 2013. Nevertheless, we can conclude that there is a strong positive correlation between the XOI and the S&P 500 index.
Taking this fact into account, let’s examine the short-term picture.
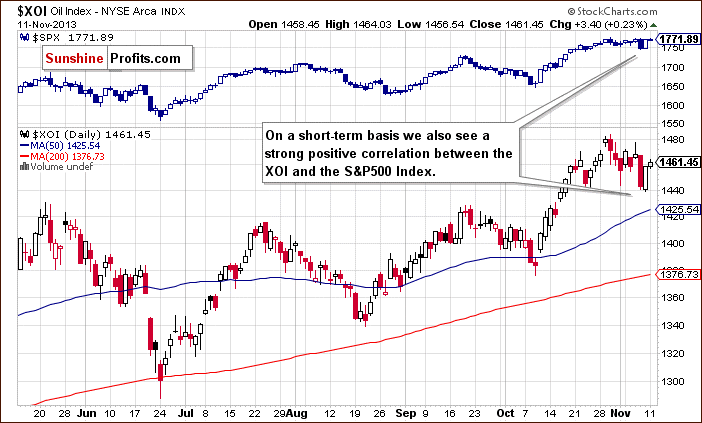
On the above chart, we see that a strong positive correlation remains in place also on a short-term basis. After the October rally, we saw a correction which pushed both indices slightly below the bottom of the previous corrective move. However, in case of the S&P 500 the Friday pullback was visibly stronger. Although yesterday we saw further improvement in both indices, the XOI remains weaker in relation to the S&P500. Is it possible that this negative divergence between them will trigger another corrective move in both indices – similarly to what we have seen in the past on the weekly chart?
Taking into account the relationship described above, it seems important to discuss the current situation in the general stock market. The weekly chart of the S&P 500 index was featured in our latest Premium Update and you will find it below, along with a quote:
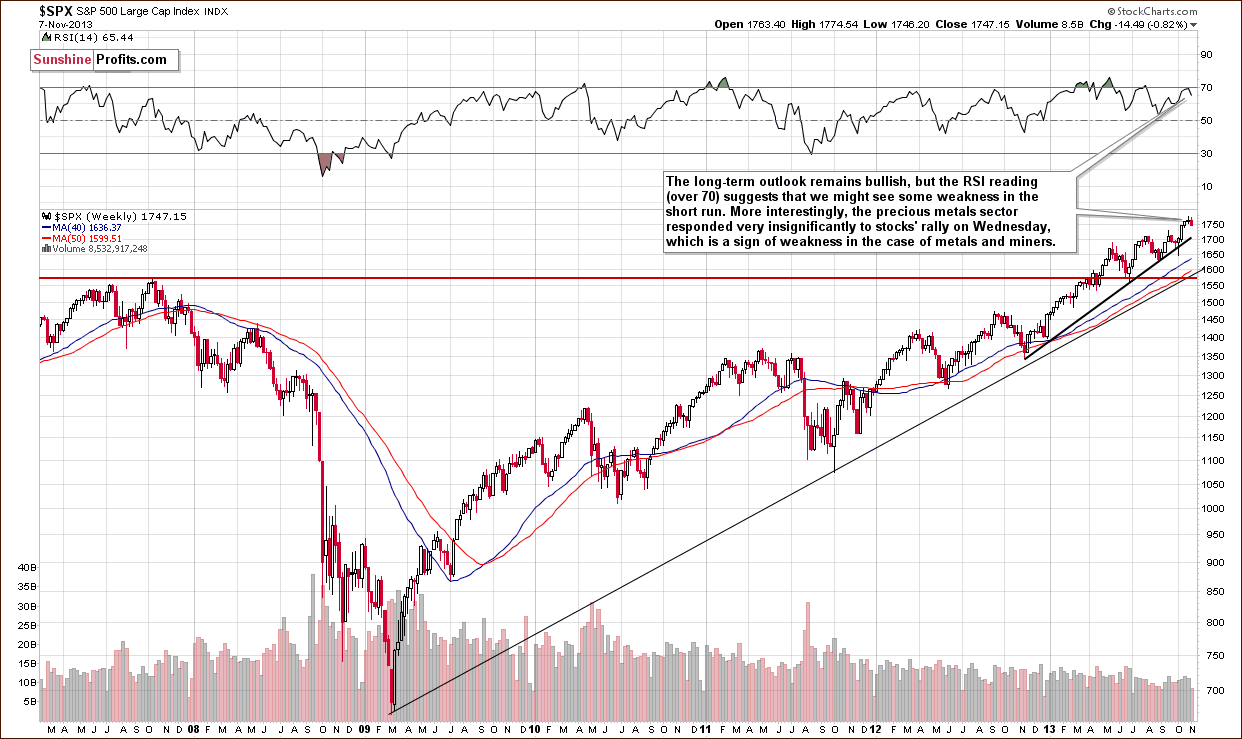
On the above chart we see that the S&P500 Index moved higher in recent days and almost touched the October top on Wednesday. From this point of view, the long-term outlook remains bullish. However, the RSI reading (over 70) suggests that we might see some weakness in the short term.
(…) it’s not a crystal-clear signal, though. There were times when stocks managed to rally despite overbought RSI readings. It seems to us that it’s likely a short-term sell signal after all. The reason is that the currency markets (USD and Euro Indices) reached their major turning points (not only the short-term ones) and this can change things temporarily on the US stock market as well.
As mentioned earlier, yesterday the S&P500 moved higher once again, but it didn’t manage to break above a strong resistance zone created by the Oct. 30 and Nov. 7 highs. If the buyers do not break above it, we will likely see a double (or even a triple) top, which may encourage sellers to act.
At this point, our Friday’s Oil Trading Alert seems to be worth mentioning:
(…) Stocks have recently been moving in tune with their True Seasonal patterns and if this tendency continues (and the XOI-stocks link remains in place), then we can expect both the general stock market and oil stocks to decline in the coming weeks.
Summing up, since the general stock market is set to decline, we might see some weakness in oil stocks as well - at least based on the link between oil stocks and the general stock market.
Summary
Looking at all charts of light crude, we can see the following:
- Crude oil reached very important support levels created by the long-, medium, and short-term support lines.
- The daily RSI bounced off the 30 level and the weekly indicator dropped to its lowest level since October 2012.
- The daily CCI and Stochastic Oscillator generated buy signals.
- The oil-to-oil-stocks ratio is still oversold as indicated by the RSI. Additionally, the MACD dropped to its lowest level since June 2012 and after that it generated a buy signal.
All the above provide us with bullish implications and from this point of view a move to the upside is still likely to be seen. However, taking into account the fact that we haven’t seen a bigger pullback so far, in our opinion it’s still too early to assume that the final bottom of the recent corrective move is already in.
The biggest event of last week, in case of oil stocks, was the breakdown below the 78.6% Fibonacci retracement level. Although we’ve seen a pullback in the recent days, the XOI hasn’t managed to come back above 1,467. Therefore, it seems that as long as the oil stock index remains below this level, further increases are limited. Another factor, which prescribes caution is the position of the indicators. We should keep an eye on the oil stock index because the sellers may trigger another correction in the coming days – especially when we factor in its tight link to the general stock market.
In this case, if the negative correlation between the WTI and XOI remains in place, we may see further improvement in light crude. Please note that this scenario is in tune with the medium-, short-term picture and the position of the light-crude-to-oil-stock-index ratio.
Very short-term outlook: bearish
Short-term outlook: bearish
MT outlook: bearish
LT outlook: unclear
Trading position (short-term): Taking into account the medium- and short-term picture, and the position of the indicators, we do not suggest opening any positions yet.
This completes this week’s Oil Investment Update. Our next Oil Investment Update is scheduled for Tuesday, Nov. 19, 2013. Oil Trading Alerts subscribers will additionally receive similar but shorter alerts on a daily basis (or more than once a day when the situation requires it).
Thank you.
Nadia Simmons
Sunshine Profits' Crude Oil Expert
Oil Investment Updates
Oil Trading Alerts

