
Is It Time for Growth or Final Bottom in Crude Oil?
Looking at the chart of crude oil from today’s point of view, we can say that the first days of the new month have been hard for oil bulls. After the breakdown below the lower border of the declining trend channel buyers didn’t manage to stop oil bears. The bears showed their claws on Thursday and pushed the price below the October low. This event resulted in a heavy decline, which took light crude below $95. On top of that, yesterday we saw further deterioration and crude oil dropped to a new monthly low of $94.06. Taking these facts into account, investors are probably wondering where the final bottom is. Before we try to answer this question, let’s consider the major factors which had a great impact on the price of crude oil in the previous week.
Just like a week ago, the selloff in crude oil has been fueled by rising U.S. stockpiles, which have climbed roughly 8% over the past six weeks as refiners have curbed their crude processing amid seasonal maintenance work and waning gasoline demand. Last Wednesday, the U.S. Energy Information Administration said crude inventories rose by another 4.1 million barrels in the week ended Oct. 25. Total inventories now stand at 383.9 million barrels and government data this week could show that stockpiles finished October at their highest level since 1930.
Taking the above into account, we can conclude that crude oil has traded lower as traders view the market as adequately supplied. Even output declines in OPEC member Libya, home to Africa’s largest oil reserves, have not contributed much upside to oil prices. Investors looked ahead to the release of fresh weekly information on U.S. stockpiles of crude and refined products to gauge the strength of oil demand in the world’s largest oil consumer.The American Petroleum Institute will release its inventories report later in the day, while Wednesday’s government report could show crude stockpiles rose by 1.8 million barrels. Please note that if history repeats itself once again and inventories rise more than expected, it will likely put downward pressure on prices.
The second factor which had an important impact on light crude was the U.S. economic data. Although the Federal Reserve left its $85-billion-a-month asset purchase program in place following its monthly policy meeting, it didn’t give clear indication whether it would start scaling back stimulus at the December meeting or continue it into the start of 2014. Therefore, investors still look out for U.S. data reports to gauge if they will strengthen or weaken the case for the Fed to reduce its bond purchases.
At the end of the previous week, the Institute of Supply Management's Manufacturing Purchasing Managers Index rose to 56.4 in October from 56.2 in September, defying expectations for a decline to 55.0. The report came a day after data showed that manufacturing activity in the Chicago region expanded at the fastest rate in 30 years in October, while a separate report showed that U.S. initial jobless claims fell in line with expectations last week.
This stronger than expected data raised speculation that the Fed may start tapering stimulus sooner than expected (in December, instead of March as many currently expect) and pushed the price of light crude lower. As a reminder, expectations that the Fed might start curbing its bond purchases by the end of this year had fuelled declines in the prices of riskier assets before investor focus shifted to the wobbly fiscal situation in Washington from late September.
Investors eyed the release of key U.S. economic data later in the week to help assess the timing for a reduction in the Fed’s bond-purchasing program. Please note that the U.S. is set to release preliminary data on third quarter economic growth on Thursday, while October’s highly-anticipated nonfarm payrolls report is scheduled for Friday. Economists are betting uncertainty over the partial government shutdown last month held hiring to a modest 125,000. If that resulted in a higher jobless rate, the Fed might be inclined to wait until next year to ease up on its stimulus.
Crude Oil
Having discussed the above, let’s now move on to the technical part of this week‘s Oil Investment Update and focus on the technical changes in the crude oil market. Just like a week ago, we take a look at charts in different time horizons to have a more complete picture of the current situation in the market.
Let’s start with a look at the monthly chart of light crude (charts courtesy by http://stockcharts.com).
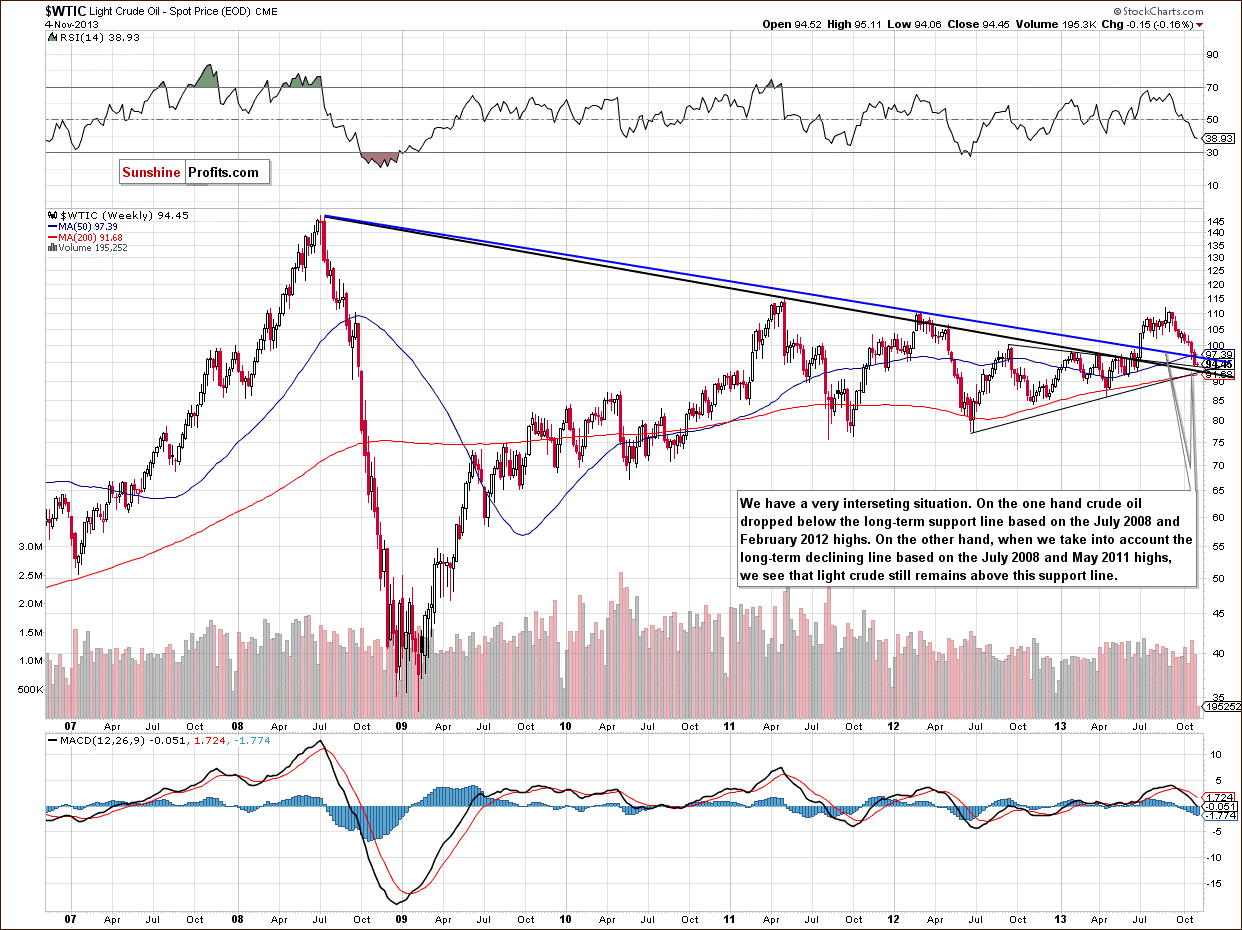
As you see on the above chart, there are two long-term declining support lines. The blue one is based on the July 2008 and February 2012 highs. When we take this line into account, we see that crude oil broke below it in the previous week, which is a bearish sign. However, if we take into account the black long-term support line (based on the July 2008 and May 2011 highs), we see that light crude still remains above it and the situation is not that bearish. Therefore, from this perspective, the picture is unclear at the moment.
Now, let’s zoom in on our picture of the oil market and see the weekly chart.
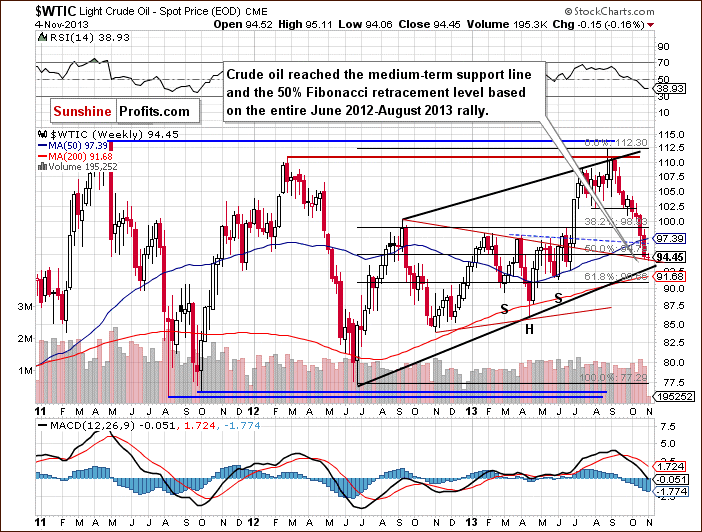
Looking at the above chart, we see that the price of crude oil declined once again in the previous week and dropped below $95. Yesterday, we saw further deterioration and light crude hit a new monthly low of $94.06. In this way crude oil slipped below the 50% Fibonacci retracement level based on the entire June 2012-August 2013 rally. However, the breakdown is not confirmed at the moment. With this downward move the price reached the medium-term support line based on the September 2012 and January 2013 highs. If this support line encourages oil bulls to act, we may see a pullback in the near future. On the other hand, if they fail and crude oil declines once again, the next target for the sellers will be the medium-term rising support line based on the June 2012 and April 2013 lows (currently around $93 per barrel).
Now, let’s check the short-term outlook.
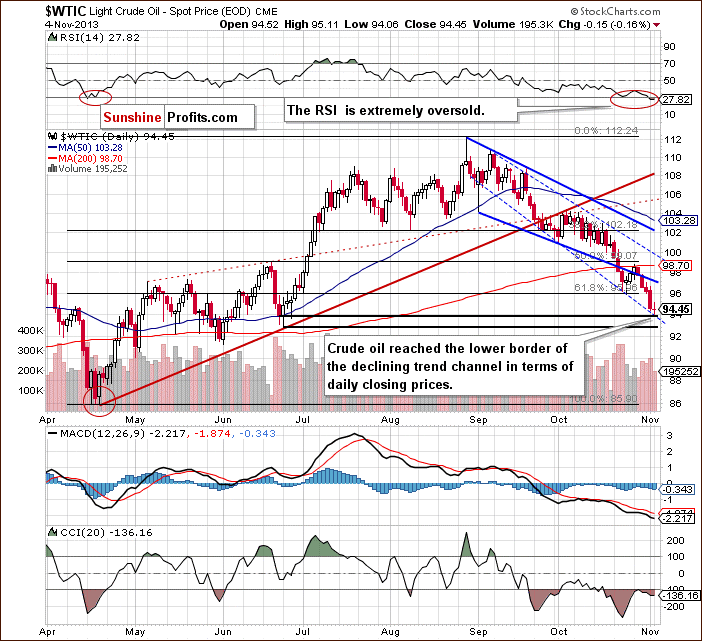
On the above chart, we see that oil bulls didn’t manage to push the price of crude oil above the 200-day moving average at the beginning of the previous week. This strong resistance stopped further growth and encouraged sellers to trigger another downward move. On Wednesday, light crude declined below the lower border of the declining trend channel (in terms of intraday highs), which resulted in a test of the October low the following day. Unfortunately, on Friday oil bulls didn’t manage to push the price higher - it didn’t even reach the previously-broken lower border of the declining trend channel. This show of weakness encouraged sellers to act and resulted in a heavy decline, which took the price below the October low. With this downward move, light crude dropped below $95 and reached the lower border of the declining trend channel in terms of daily closing prices. Yesterday, we saw another drop which resulted in a new monthly low of $94.06.
In spite of this decline, light crude still remains above the lower border of the declining trend channel in terms of daily closing prices. It’s worth mentioning that this line successfully stopped the recent corrective move, as seen on the chart. Additionally, light crude almost reached a support level based on the bottom of the corrective move that we had seen in June (in terms of daily closing prices). What’s interesting, when we factor in the Fibonacci price projections, we notice that the downward move from Oct. 3 to Nov. 4 is similar to the corrective move that we saw from Sept. 6 to Sept. 30. It’s worth noting that after the September decline we saw a pullback, therefore if history repeats itself, we may see similar price action in the coming days.
At this point, it’s worth mentioning that the RSI dropped below the 30 level to its lowest level since April and is extremely oversold. Back then, such a low value of the indicator had a positive impact on light crude – after the RSI moved to the 30 level, we saw a pullback in the following days. Looking at the above chart, we can assume that we might see similar price action in the near future – especially when we take into account a positive divergence in the Commodity Channel Index.
Summing up, from the long-term perspective the situation in crude oil is unclear. Although the situation is bearish from the medium-term point of view, light crude reached the declining medium-term support line, which may trigger a bigger pullback. Additionally, on the short-term basis crude oil is extremely oversold – the RSI dropped below the 30 level to its lowest level since April. On top of that, light crude reached the lower border of the declining trend channel in terms of daily closing prices and the 50% Fibonacci retracement level based on the entire June 2012-August 2013 rally. Taking these facts into account, further declines may be decelerated in the coming days.
Having discussed the current outlook for crude oil, let’s examine the NYSE Arca Oil Index (XOI) to find out what the current outlook for oil stocks is and to check if they confirm or invalidate the above analysis of the crude oil market.
Oil Stocks
Just like a week ago, we begin with the long-term chart.
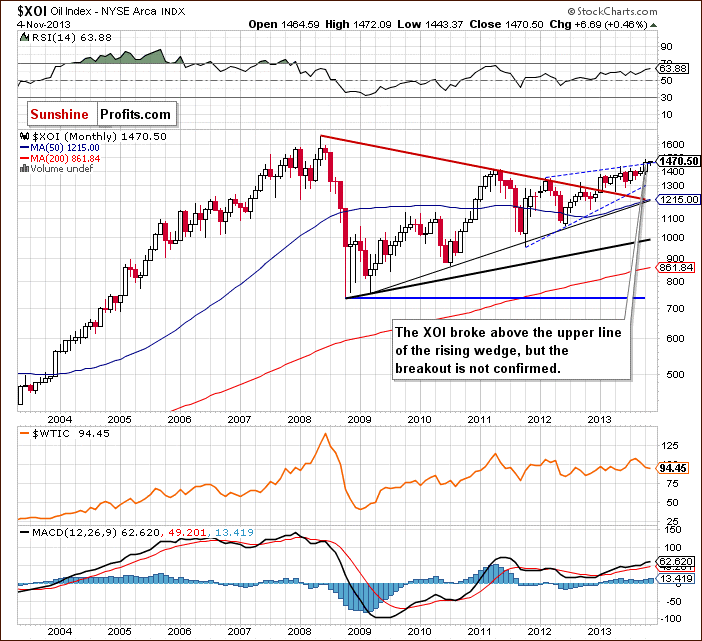
On the above chart, we see that the situation hasn’t changed much. The XOI remains above the upper line of the rising wedge. The breakout, however, is not yet confirmed.
Quoting our previous Oil Investment Update:
(…) in this area there’s a very important Fibonacci retracement level - 78.6% (close to 1,467) based on the entire May-October 2008 decline, which may slow the rally. However, if the buyers don’t give up and manage to push the oil stock index above this resistance, we will likely see further growth.
The XOI still remains above the previously-broken long-term declining resistance line based on the 2008 and 2011 highs and the breakout hasn’t been invalidated. Therefore, taking these observations into account, the situation is very bullish.
To see this more clearly, let’s zoom in on our picture and move on to the weekly chart.
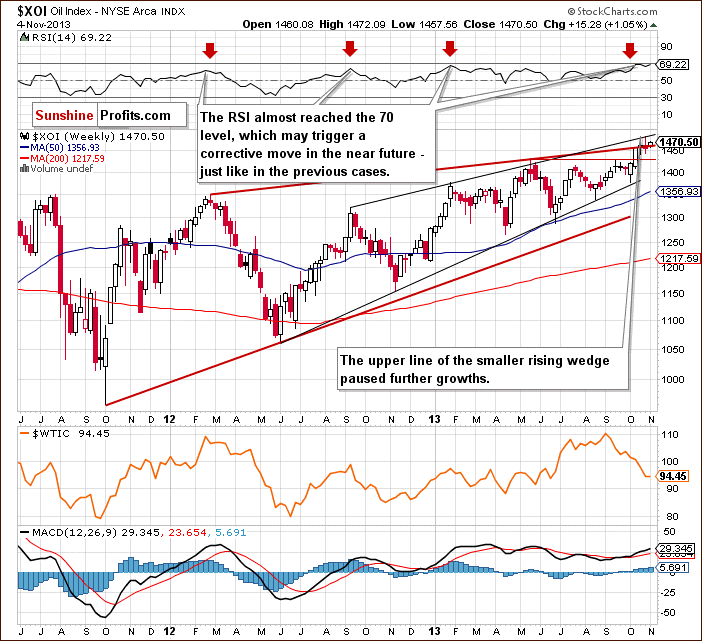
Looking at the above chart, we see that the oil stock index continued its rally in the previous week and hit a new 2013 high at 1,483.
Quoting our previous Oil Investment Update:
(…) if the buyers manage to push the XOI higher, further increases may be restrained by the upper line of the smaller rising wedge (marked with the black line) around 1,480.
As you see on the weekly chart, last week this resistance successfully stopped further growth and the XOI declined below the upper line of the rising wedge (marked with the bold red line). Although the breakout above this line was invalidated, buyers didn’t give up. Yesterday they managed to push the oil stock index above this line once again. Therefore, we may see further growth to at least the 2013 high.
However, we should keep in mind that the RSI almost reached the 70 level. This situation may trigger a corrective move in the near future. Please note that we saw similar price action several times in the previous months.
Nevertheless, from the medium-term point of view, the uptrend is not threatened at the moment, and the situation remains bullish.
At this point, we’ll focus on the relationship between light crude and the oil stocks.
When we take a look at the above charts and compare the price action in both cases, we see that oil stocks were stronger in the previous week once again. Although they declined in the second half of the previous week, on Wednesday they reached a new 2013 high at 1,483. What happened with the price of crude oil at the same time? Light crude declined once again and hit a new four-month low of $94.36. Additionally, on Friday oil stocks bounced off the bottom of the recent corrective move at 1,441, which encouraged buyers to act and resulted in a pullback. Yesterday, we saw a continuation of the upswing and oil stocks closed the day above the 78.6% Fibonacci retracement level. Meanwhile, light crude dropped once again and hit a new monthly low of $94.06, which clearly shows its weakness in relation to oil stocks.
Now, let’s turn to the daily chart.
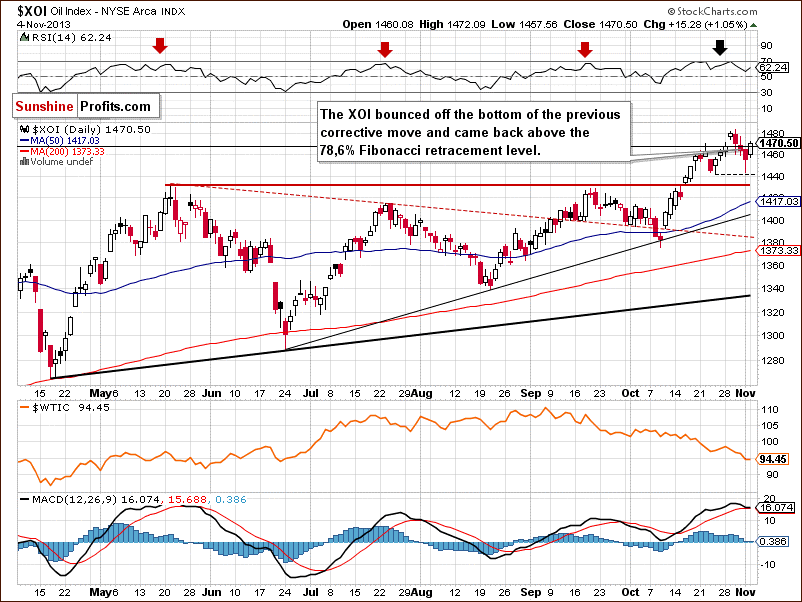
Looking at the above chart, we see that at the beginning of the previous week, the XOI broke above the Oct. 28 high and climbed to a new monthly top at 1,481. On Wednesday, the oil stock index continued its rally and hit a fresh monthly high at 1,483. With this growth, oil stocks moved above the 78.6% Fibonacci retracement level (close to 1,467) based on the entire May-October 2008 decline. However, this improvement was only temporary and the breakout was invalidated in the following days. This was a bearish sign, which triggered further declines. In this way, the XOI dropped to its weekly low at 1,443. As you see on the above chart, slightly below this level is the bottom of the recent corrective move. This support level encouraged buyers to act and resulted in a pullback to 1,455. Yesterday, we saw further improvement and the XOI climbed above the previously-broken 78.6% Fibonacci retracement level (close to 1,467) based on the entire May-October 2008 decline.
Please note that the RSI dropped below the 70 level and still has some space for further growth. Therefore, if the buyers do not give up, we will likely see a continuation of the recent upswing and the nearest resistance level is the 2013 high.
Now, let’s comment on the relationship between the WTI and XOI in the short term.
At the beginning of the previous week, we saw strong negative correlation between light crude and the oil stocks. Crude oil declined below the lower border of the declining trend channel once again and dropped to a level slightly above the October low. At the same time, the oil stock index continued its rally and reached a new 2013 high. The relationship between the WTI and XOI reversed in the second half of the previous week and we noticed declines on both daily charts. On Friday, crude oil declined through the session and hit a new four-month low. Meanwhile, oil stocks dropped but then pulled back sharply. Yesterday, we saw negative correlation between the WTI and XOI once again. The oil stock index continued an upward move and climbed above the previously-broken 78.6% Fibonacci retracement level. At the same time crude oil extended the decline and dropped to a new monthly low.
Summing up, from the long-, medium- and short-term perspectives the outlook for oil stocks remains bullish and the uptrend is not threatened at the moment. Taking into account the combination of a strong resistance and the position of the RSI, we should keep an eye on the oil stock index because the sellers may trigger another correction in the coming days. However, if they fail and oil stocks confirm the breakout above the 78.6% Fibonacci retracement level and successfully break above the 2013 high, we will likely see further growth to at least the psychological barrier at 1,500. If it is broken, the next strong resistance level will be around 1,560. Looking at the relationship between light crude and the oil stock index in the previous week, we see that although there were days when the WTI and the XOI moved in the same direction, negative correlation remains in place.
Ratio Analysis
Once we know the current relationship between crude oil and oil stocks, let’s take a closer look at the light-crude-to-oil-stock-index ratio.
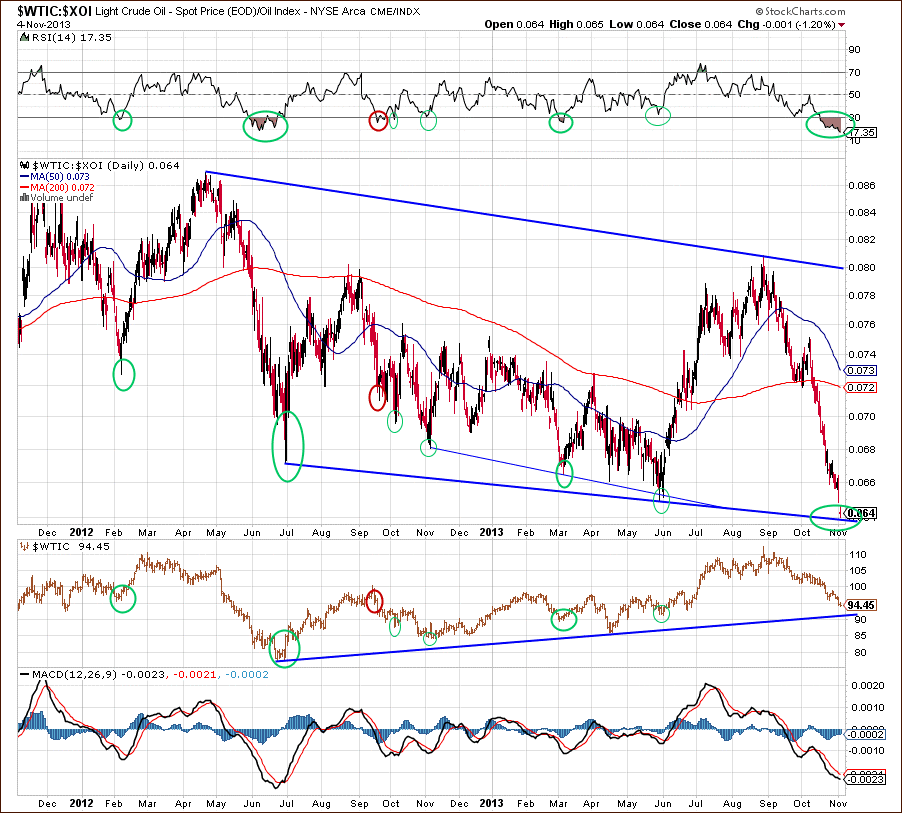
Looking at the above chart, we clearly see that from the end of August the ratio has declined and reached the long-term support line in the recent days. Additionally, the RSI dropped to its lowest level since June 2012 and now it’s extremely oversold.
Back then, such a low value of the indicator had a positive impact on light crude. After the RSI moved below the 30 level, we saw a pullback in the ratio in the following days. What’s interesting, this increase coincided with higher prices of light crude.
When we take a closer look at the above chart, we clearly see that there have been many similar situations in the past. In October 2012 and then in November a pullback in the ratio triggered a pullback in crude oil. Earlier this year, we saw such price action too. In March, when the RSI dropped below the 30 level and then moved higher, we also saw increases in the ratio and in crude oil.
In June, the ratio dropped below the short-term declining support line based on the November 2012 and March 2013 lows, but this deterioration was only temporary. In the following days, we noticed a sharp pullback, which pushed higher not only the ratio, but also light crude. Back then, it resulted in the June-August rally.
As mentioned earlier, in the recent days, the ratio has dropped to the long-term support line, which is an important support level. Taking into account the price action that we've seen in the past, it seems that a bigger pullback in crude oil is just around the corner. If history repeats itself once again, higher levels of the ratio will likely trigger a pullback in crude oil in the following days as well.
Summary
In the previous week, crude oil was weaker in relation to oil stocks once again. Strong negative correlation between light crude and the XOI was visible especially at the beginning of the previous week and then again on Monday. Back then, lower prices of crude oil were accompanied by higher values of the oil stock index. These circumstances resulted in a breakdown not only below the lower border of the declining trend channel, but also below the October low in case of crude oil. Meanwhile, oil stocks continued their rally and reached a new 2013 high. If this relationship remains in place, we may see similar price action in the following days. In this case, if the XOI breaks above the 2013 high and continues its rally, we will likely see lower prices of crude oil.
However, taking into account the combination of a strong resistance and the position of the weekly RSI, we should keep an eye on the oil stock index because the sellers may trigger another correction in the coming days. In this case we may see further improvement in light crude. Please note that this scenario is in tune with the short-term picture and the position of the light-crude-to-oil-stock-index ratio.
Finally, the oil-to-oil-stocks ratio is at an extreme low, as indicated by the RSI. This could very well result in the end of the underperformance and strong performance of crude oil. Overall, the picture remains unclear.
Very short-term outlook: bearish
Short-term outlook: bearish
MT outlook: bearish
LT outlook: unclear
Trading position (short-term): Taking into account the short-term picture and the position of the RSI, we do not suggest opening short positions yet.
This completes this week’s Oil Investment Update. Our next Oil Investment Update is scheduled for Tuesday, Nov. 12, 2013. Oil Trading Alerts subscribers will additionally receive similar but shorter alerts on a daily basis (or more than once a day when the situation requires it).
Thank you.
Nadia Simmons
Sunshine Profits' Crude Oil Expert
Oil Investment Updates
Oil Trading Alerts

