
Another hard week for oil bulls is behind us. In the previous week we saw significant deterioration. The price of crude oil not only dropped below the psychological barrier of $100, but also reached a new four-month low of $95.95. The buyers might have managed to push light crude higher at the end of the last week, but, overall, light crude finished the week with a 3% loss and a third weekly decline.
Before we jump into the world of charts, let’s consider major factors which had a great impact on the price of crude oil in the previous week.
Firstly, the price of crude oil has been largely dictated by the amount of supply in the U.S. Therefore, Monday’s data from the EIA, which showed that U.S. crude stockpiles grew more than expected in the week to Oct. 11, pushed light crude lower. On the following day, data from the American Petroleum Institute showing crude stocks building at Cushing, Oklahoma, also helped to trigger selling of crude oil. Additionally, on Wednesday the price of light crude accelerated declines after the U.S. Energy Information Administration said in its weekly report that U.S. oil supplies rose more-than-expected in the week ended Oct. 18.
Taking the above into account, we can conclude that last week’s build put a lot of pressure on the oil market and pushed crude oil to a new four-month low. What’s interesting, on Friday, crude oil ended higher as traders bet that increasing refinery operations and a major new Midwest pipeline will slow the rise in U.S. crude stockpiles, which confirmed that the amount of supply in the U.S is still the key driver for crude oil. Therefore, investors should keep an eye on data from the American Petroleum Institute late on Tuesday and weekly oil inventory data from the Energy Information Administration on Wednesday.
The second factor, which had an important impact on light crude was the U.S. economic data. Investors have closely been looking out for U.S. data reports recently to gauge if they will strengthen or weaken the case for the Fed to reduce its bond purchases. Expectations that the Fed might start curbing its bond purchases by the end of this year had fuelled declines in the prices of riskier assets before investor focus shifted to the wobbly fiscal situation in Washington from late September.
Meanwhile, the disappointing data points came after a government report showed that U.S. jobs growth had slowed in September, even before the start of the 16-day government shutdown. Crude oil extended declines after preliminary data showed that U.S. manufacturing activity fell to a 12-month low of 51.1 in October from a reading of 52.8 in September. Additionally, a separate report from the U.S. Department of Labor showed that the number of individuals filing for initial jobless benefits declined by 12,000 last week to a seasonally adjusted 350,000. On Friday, data showed that core durable goods orders declined for the third consecutive month in September, while another report showed that U.S. consumer sentiment fell to the lowest level in almost a year this month.
The above (weaker than expected) numbers raised concerns over the U.S. economic outlook and the impact on future oil demand prospects. They also bolstered expectations that the Federal Reserve would postpone plans to start scaling back its asset purchase program until at least the beginning of next year. Therefore, this week, investors will be focused on the outcome of Wednesday’s Fed policy setting meeting.
And speaking of economic data… On Monday, U.S. data showed that industrial production rose at the fastest pace in seven months in September, which boosted the demand outlook and pushed crude oil to its highest level since Oct. 23.
Additionally, yesterday, light crude rose after Reuters reported that exports from Libya had fallen to the lowest level in six weeks after operations at its western port of Zawia had been suspended at the weekend. Crude exports dropped to approximately 250,000 barrels per day over the weekend, from an overall capacity of 1.25 million barrels per day. These circumstances revived supply concerns and boosted the price of light crude, just like earlier this year.
Please note that the oil market will also keep an eye on a two-day meeting of experts from Iran and six world powers on Wednesday. According to Reuters, western diplomats say the meeting, scheduled to take place a week before the next round of negotiations in Geneva in November, could be instrumental in defining the contours of any preliminary agreement on Iran's uranium enrichment campaign.
Crude Oil
Having discussed the above, let’s now move on to the technical part of this week‘s Oil Investment Update and focus on the technical changes in the crude oil market. Just like a week ago, we take a look at charts in different time horizons to have a more complete picture of the current situation in the market.
Let’s start with a look at the monthly chart of light crude (charts courtesy by http://stockcharts.com).
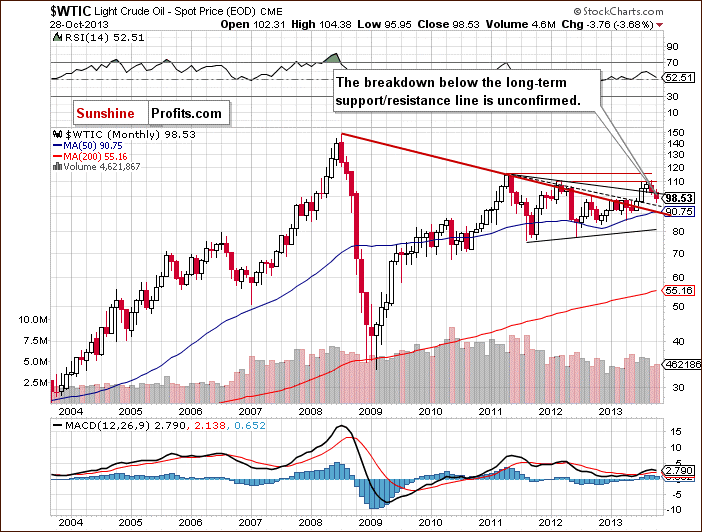
On the above chart we see that the situation hasn’t changed much recently. Crude oil remains below the long-term declining support/resistance line based on the September 2012 and March 2013 highs (the upper black line). However, the breakdown below this line is unconfirmed at the moment. Please note that despite this downward move, crude oil still remains above the long-term declining resistance line based on the July 2008 and May 2011 highs (bold red line).
From this perspective, the picture remains bullish.
Now, let’s zoom in on our picture of the oil market and see the weekly chart.
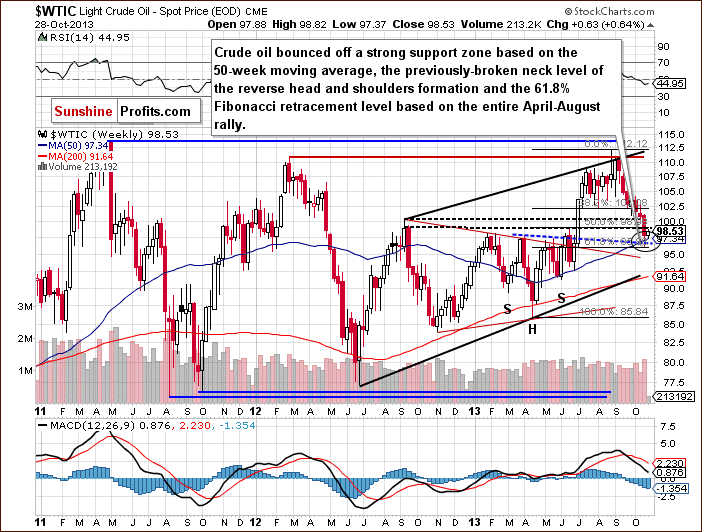
Looking at the above chart, we see that the price of crude oil declined once again in the previous week and reached a new monthly low of $95.95. With this downward move light crude dropped to a strong support zone based on the 50-week moving average, the previously-broken neck level of the reverse head and shoulders formation and the 61.8% Fibonacci retracement level based on the entire April-August rally. This area (marked with a black ellipse) encouraged oil bulls to act and resulted in a pullback in the second half of the last week. In spite of this growth, light crude finished the week with a 3% loss and a third weekly decline.
On Monday, although crude oil almost reached the 50-week moving average (currently at $97.34), this strong support triggered an upward move, which pushed the price slightly below the resistance level based on the September 2012 high (in terms of weekly closing prices).
From this point of view, the situation is mixed. On the one hand, we saw a drop to a new monthly low, which is a bearish sign. On the other, crude oil reached a strong support zone, which may trigger a bigger pullback this week.
Now, let’s check the short-term outlook.
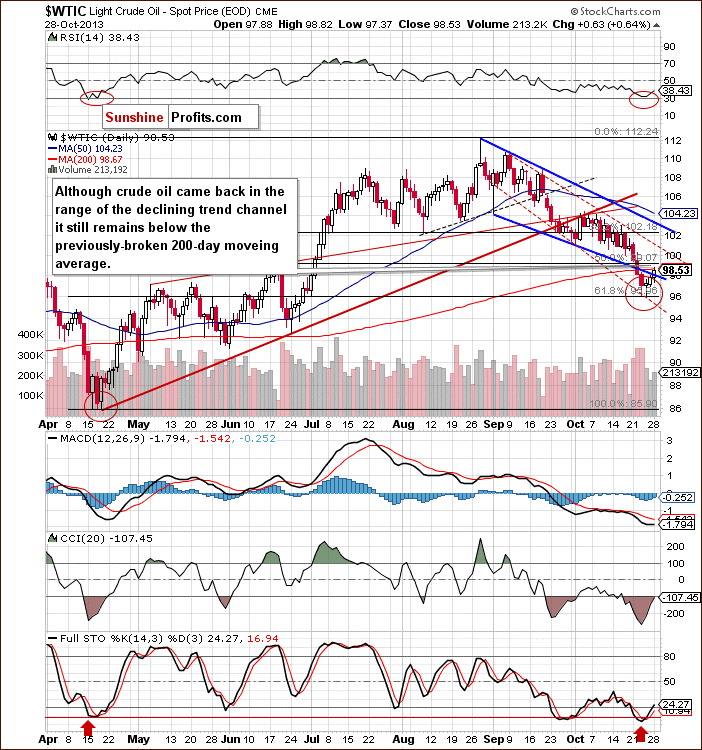
On the above chart, we see that at the beginning of the previous week oil bulls didn’t manage to hold the price of crude oil above the 50% Fibonacci retracement level based on the entire April-August rally. This significant show of weakness resulted in further deterioration in the following days. Light crude not only slipped below the 200-day moving average on Tuesday, but also broke below the lower border of the declining trend channel. On Wednesday, crude oil extended declines and reached the 61.8% Fibonacci retracement level based on the entire April-August rally. Next day, we saw another attempt to break below this level, which resulted in a new monthly low. In spite of this drop, oil bears failed and didn’t manage to close the day below it.
As you see on the above chart, these unsuccessful attempts had a positive impact on the price. They triggered an upswing, which took light crude to the previously-broken lower border of the declining trend channel on Friday. Although this strong resistance stopped gains and crude oil closed last week below it, yesterday we saw further improvement. Oil bulls pushed the price above this line and broke above the 200-day moving average (only on an intraday basis). In this way, the price came back in the range of the declining trend channel, which is a first positive change in the short-term outlook.
Please note that in the previous week, the RSI dropped to its lowest level since April. Back then, such a low value of the indicator had a positive impact on light crude. After the RSI moved to the 30 level, we saw a pullback in the following days. Looking at the above chart, we can assume that we’ll likely see similar price action in the near future – especially when we take into account the position of other indicators (the Stochastic Oscillator has already generated a buy signal and the Commodity Channel Index is close to doing the same).
Summing up, although crude oil dropped below the lower border of the declining trend channel in the previous week, this deterioration was only temporary. Yesterday, the breakdown was invalidated and the price came back in the range of the channel. Please note that light crude reached the previously-broken 200-day moving average, which still serves as resistance. If it is broken, we will likely see further growth to at least $101 per barrel. On the other hand, if the buyers show their weakness, oil bears will likely trigger another corrective move and test the October low. However, taking into account the position of all indicators and the fact that light crude bounced off a strong support zone, it seems that the pro-growth scenario is more likely.
Having discussed the current outlook for crude oil, let’s examine the NYSE Arca Oil Index (XOI) to find out what the current outlook for oil stocks is and to check if they confirm or invalidate the above analysis of the crude oil market.
Oil Stocks
We begin with the long-term chart and almost immediately see that the situation has improved.
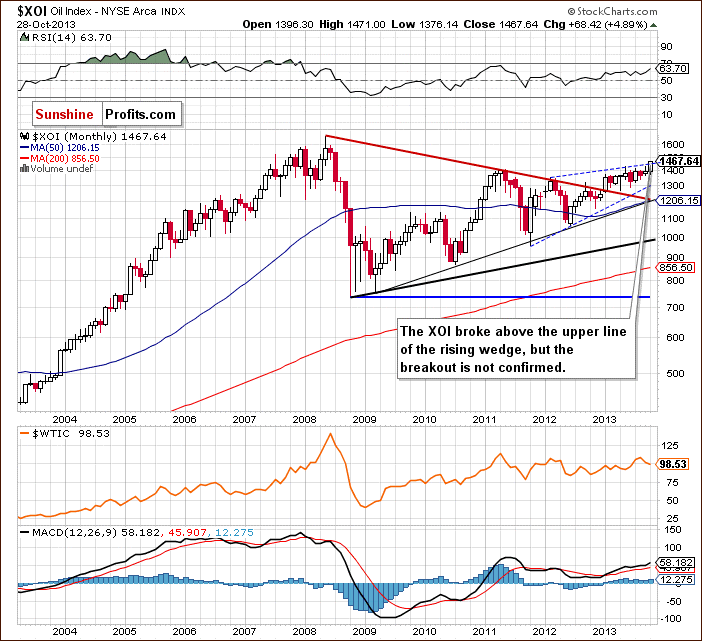
On the above chart we see that the XOI broke above the upper line of the rising wedge. The breakout, however, is not yet confirmed. Please note that in this area there’s a very important Fibonacci retracement level - 78.6% (close to 1,467) based on the entire May-October 2008 decline, which may slow the rally. However, if the buyers don’t give up and manage to push the oil stock index above this resistance, we will likely see further growth.
The XOI still remains above the previously-broken long-term declining resistance line based on the 2008 and 2011 highs and the breakout hasn’t been invalidated. Therefore, taking these observations into account, the situation is very bullish.
To see this more clearly, let’s zoom in on our picture and move on to the weekly chart.
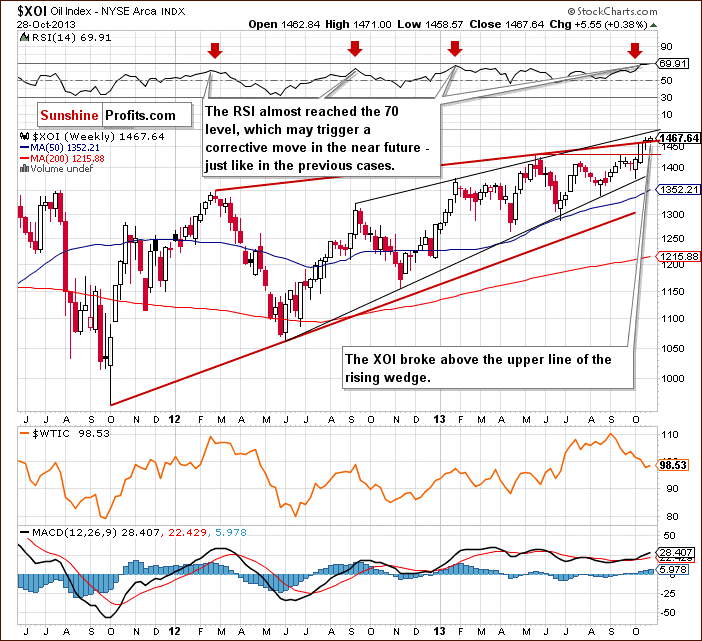
As you can see on the above chart, the oil stock index continued its rally in the previous week and broke above the upper line of the rising wedge (marked with the red bold line). However, the breakout is not confirmed at the moment.
At this point, it’s worth mentioning that this area is reinforced by the 100% Fibonacci price projections (at 1,465). In this case, we take into account three data points: the August low, September top and October low. Therefore, further increases may be restrained by this resistance zone. Additionally, the RSI almost reached the 70 level, which may trigger a corrective move in the near future. Please note that we saw similar price action several times in the previous months.
Nevertheless, from the medium-term point of view, the uptrend is not threatened at the moment, and the situation remains bullish. It’s worth noting that even if the buyers manage to push the XOI higher, further increases may be restrained by the upper line of the smaller rising wedge (marked with the black line) around 1,480.
At this point, we’ll focus on the relationship between light crude and the oil stocks.
When we take a look at the above charts and compare the price action in both cases, we see that oil stocks were stronger in the previous week once again. They broke not only above the upper line of the rising wedge, but also reached a new monthly high at 1,470.
What happened with the price of crude oil at the same time? Light crude declined once again and reached a new monthly low of $95.95, which clearly showed its weakness in relation to oil stocks. However, the beginning of this week looked quite similar for both oil and oil stocks. We saw increases in both cases that pushed the XOI to a new monthly high at 1,471 and crude oil in the range of the declining trend channel.
Now, let’s turn to the daily chart.
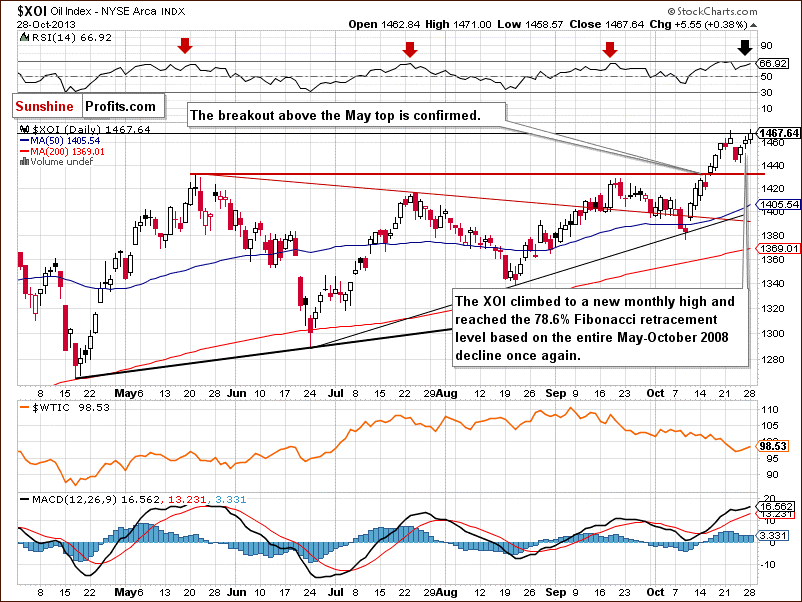
Looking at the above chart, we see that at the beginning of the previous week, the XOI broke above the Oct. 18 high and climbed to a new monthly top at 1,470. In this way, the XOI broke above the 78.6% Fibonacci retracement level (close to 1,467) based on the entire May-October 2008 decline. However, this strong resistance level stopped further increases and encouraged sellers to trigger a correction. Although they pushed the oil stock index to 1,441, this deterioration was only temporary and oil stocks rebounded at the end of the week.
Yesterday, the oil stock index continued its rally and hit a fresh monthly high at 1,471. With this growth, oil stocks reached the 78.6% Fibonacci retracement level (close to 1,467) based on the entire May-October 2008 decline once again. If the breakout above this strong resistance is confirmed and the buyers push the XOI higher, we may see an increase to at least 1,480.
However, we should keep in mind that the RSI almost reached the 70 level. Additionally, when we take a closer look at the daily chart, we notice a negative divergence between the indicator and the XOI, which is a bearish sign. Therefore, we may see a corrective move in the near future. Please note that we saw similar price action several times in the previous months (marked with red arrows on the above chart).
Please note that the nearest support level is the bottom of the recent corrective move at 1,441. The next support lies at 1,428-1,430 and is based on the May and September highs.
Now, let’s comment on the relationship between the WTI and the XOI in the short term.
At the beginning of the previous week, we saw strong negative correlation between light crude and the oil stocks. Crude oil declined below the 50% Fibonacci retracement level and broke below the lower border of the declining trend channel. At the same time, the oil stock index continued its rally and reached a new monthly high. The relationship between the WTI and the XOI changed on Wednesday when we noticed declines on both daily charts. On Thursday, crude oil hit a new monthly low. Meanwhile, oil stocks hit a bottom of the corrective move. In the following days we saw growths in both cases.
Summing up, from the long-, medium- and short-term perspectives the outlook for oil stocks remains bullish and the uptrend is not threatened at the moment. Taking into account the combination of a strong resistance and the position of the RSI, we should keep an eye on the oil stock index because the sellers may trigger another correction in the coming days. However, if they fail and oil stocks confirm the breakout above the 78.6% Fibonacci retracement level, we will likely see further growth to at least 1,480. If it is broken, the next strong resistance level will be around 1,560. Looking at the relationship between light crude and the oil stock index in the previous week, we see that after weeks of negative correlation the WTI and the XOI are now moving in the same direction.
Once we know that, let’s take a closer look at the chart below and check the link between crude oil and the U.S. currency in the short term.
Crude Oil – U.S. dollar Link
Quoting our previous Oil Investment Update:
(…) on Thursday, the dollar and crude oil dropped together. In case of crude oil, we saw a new monthly low. What’s interesting, on the following day we also saw a new October low for the U.S. dollar.
Looking at the above chart, we see that in the previous week we had the same situation. On Thursday light crude hit its new October low and on Friday we also saw a new monthly low for the U.S. currency.
Therefore, we can conclude that crude oil and the dollar displayed positive correlation in the previous week once again. If this relationship remains in place and we see a rebound in the greenback, we will likely see a pullback in crude oil in the following days as well.
Taking into account the relationship described above, it seems important to discuss the current situation in the U.S. dollar. The short-term picture for the USD Index was featured in our latest Premium Update and you will find it below, along with a quote:
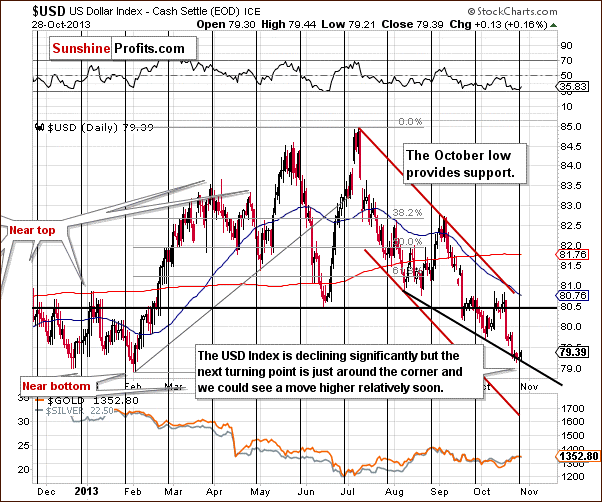
On the daily chart, we see that the USD Index broke below the previous October’s low and reached the short-term support line based on the August 8 and the October 3 lows.
As can be seen on the above chart, there is a cyclical turning point just around the corner. Therefore, we could see a reversal of the current bearish tendency in coming weeks. This can lead to a bigger pullback, especially when we take into account the fact that the USD Index remains in a short-term downtrend.
Summing up, since the USD Index is set to rally, we might see some strength in the crude oil sector as well - at least based on the USD - crude oil link.
Summary
In the previous week, crude oil was weaker in relation to oil stocks once again. Strong negative correlation between light crude and the XOI was visible especially at the beginning of the previous week. Back then, lower prices of crude oil were accompanied by higher values of the oil index. These circumstances resulted in a breakdown below the 50% Fibonacci retracement level and the lower border of the declining trend channel in case of crude oil. Meanwhile, oil stocks continued their rally and reached a new monthly high. Looking at the daily charts, we see that this strong negative correlation reversed on Wednesday and we saw similar price action in both oil and oil stocks in the following days. Although, the WTI and the XOI are moving in the same direction at the moment, it seems that after weeks of negative correlation it’s still too early to say if this is a meaningful reversal of the current tendency or just a temporary phenomenon.
Taking the above into account, we should consider two scenarios.
The first of them assumes that the positive correlation is only temporary and we’ll see a return to a negative relationship between them once again. In this case, if the XOI breaks above the 78.6% Fibonacci retracement level and continues its rally, we will likely see lower values of crude oil. On the other hand, if the buyers fail and the oil index declines, we may see further improvement in light crude.
The second scenario assumes that the positive correlation will remain in place. In this case, if the XOI breaks above the 78.6% Fibonacci retracement level and continues its rally, we will likely see a rally in crude oil as well. However, if the oil index declines, we’ll see another downward move in light crude.
As mentioned earlier, it’s too early to claim that the recent price action is an important reversal of the tendency that we have seen in the recent weeks. Therefore, we should keep an eye on this relationship in the following days to find more clues about future price movements in crude oil and oil stocks.
Very short-term outlook: mixed with bullish bias
Short-term outlook: bearish
MT outlook: mixed
LT outlook: bullish
Trading position (short-term): We do not suggest opening any positions yet. Taking into account the very short-term picture, the situation is still unclear.
This completes this week’s Oil Investment Update. Our next Oil Investment Update is scheduled for Tuesday, Nov. 5, 2013. Oil Trading Alerts subscribers will additionally receive similar but shorter alerts on a daily basis (or more than once a day when the situation requires it).
Thank you.
Nadia Simmons
Sunshine Profits' Crude Oil Expert
Oil Investment Updates
Oil Trading Alerts

