
- Crude Oil and Its Connections with the U.S. Dollar
- Crude Oil
- Oil Stocks
- Crude Oil – Gold Link
- Summary
Crude Oil and Its Connections with the U.S. Dollar
Looking at the chart of crude oil from today’s point of view, we can say that last week was hard for the buyers. Although light crude still remains in the narrow range between $100 and $104 per barrel, oil bears managed to push crude oil to its new monthly low of $100.03. In the previous week, light crude lost 0.86% and this is its lowest weekly close since June. Before we jump into the world of charts, let’s consider recent circumstances which had a great impact on the price of crude oil.
For the most of the previous week traders were focusing on news out of Washington. Every positive news triggered gains and light crude came back to the previously-broken 38.2% Fibonacci retracement level. However, although the U.S. Senate reached an agreement to increase the country's borrowing limit and concerns that a debt crisis would weigh on crude demand eased, the price of crude oil dropped slightly above $100.
Light crude was under selling pressure after data from the American Petroleum Institute showed crude inventories at the Cushing, Oklahoma, hub rose for the first time since early July, while overall U.S. crude stockpiles gained more than double forecasts in a Reuters poll of analysts for a build of 2.2 million barrels. Taking the above into account, we clearly see that API build put a lot of pressure on the oil market and that surplus definitely weighed on prices. Therefore, investors should keep an eye on weekly oil inventory data for week-ending Oct. 18 from the Energy Information Administration on Thursday, Oct. 24.
Signs of progress around talks over Iran's nuclear program also pressured prices. The United States described two days of negotiations as the most serious and candid to date after Western diplomats said Iran hinted it was ready to scale back sensitive atomic activities to secure urgent sanctions relief. According the EIA, Iran holds the world's fourth-largest proven oil reserves and the world's second-largest natural gas reserves. International sanctions are redefining the Iranian energy sector, and the lack of foreign investment and technology is affecting the sector profoundly. Therefore, some analysts have questioned whether Iran could quickly ramp up production even if sanctions are lifted swiftly.
Crude Oil
Having discussed the above, let’s now move on to the technical part of this week‘s Oil Investment Update and focus on the technical changes in the crude oil market. Just like a week ago, we take a look at charts in different time horizons to have a more complete picture of the current situation in the oil market.
Let’s start with a look at the monthly chart of light crude (charts courtesy by http://stockcharts.com).
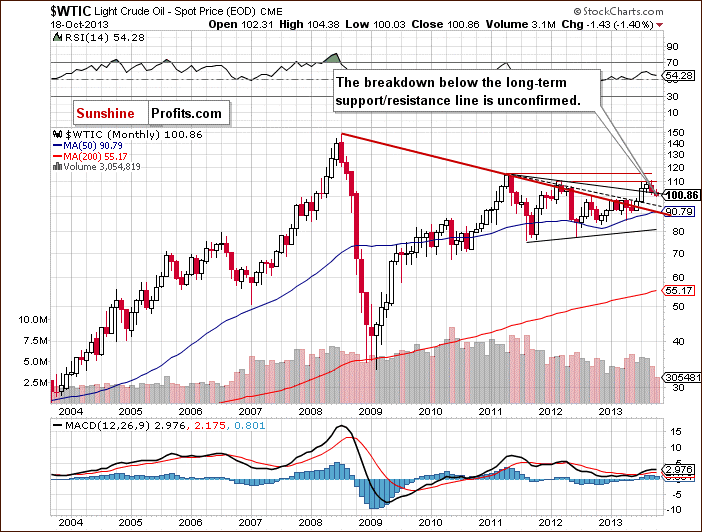
On the above chart we see that crude oil dropped below the long-term declining support/resistance line based on the September 2012 and March 2013 highs (the upper black line). However, the breakdown below this line is not confirmed at the moment. Please note that despite this downward move, crude oil still remains above the long-term declining resistance line based on the July 2008 and May 2011 highs (bold red line).
From this perspective, the picture remains bullish.
Now, let’s zoom in on our picture of the oil market and see the weekly chart.
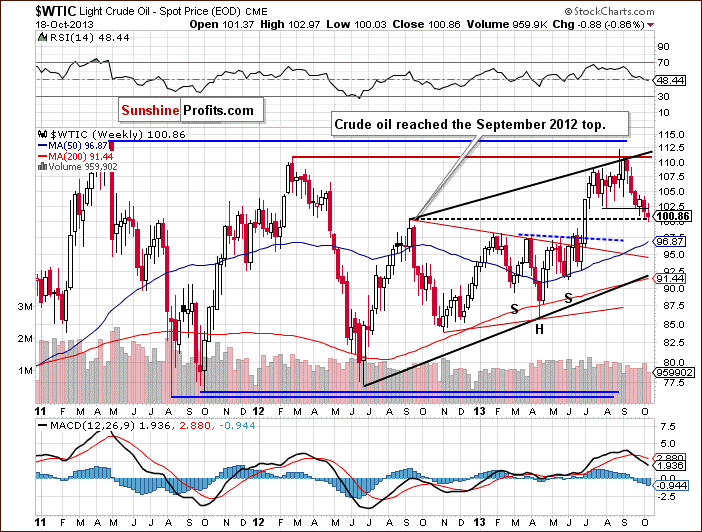
Looking at the above chart, we see that the price of crude oil declined once again in the previous week and dropped below the October low. In this way, light crude slipped to a new monthly low of $100.03 and closed last week at its lowest level since June.
As you can see on the weekly chart, crude oil reached the September 2012 top (in terms of intraday highs). This support level may encourage oil bulls to act and if this happens, we will likely see a pullback to around $104. However, if this zone is broken, the next target level for the sellers will be close to $99.
From this point of view, the situation is still mixed.
Now, let’s check the short-term outlook.
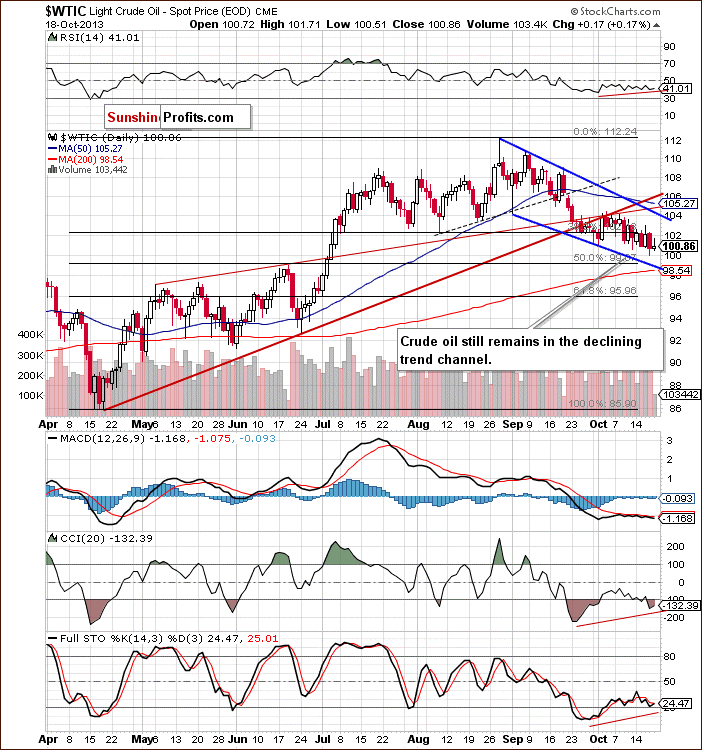
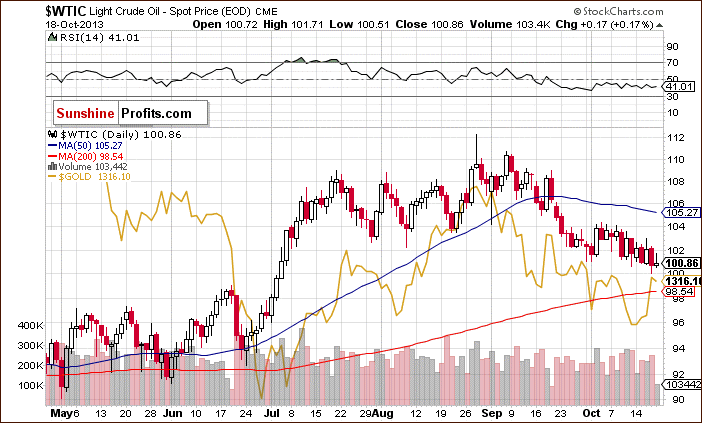
On the above chart, we see that the situation has deteriorated since our last Oil Investment Update was published. Since the beginning of the previous week oil bulls and bears have pushed the price of light crude above or below the 38.2% Fibonacci retracement level. However, neither the buyers nor the sellers have had enough strength to trigger another bigger move. Finally, oil bears won and we saw a drop to a new monthly low. Additionally, the sellers closed the previous week below the 38.2% Fibonacci retracement level and the breakout is confirmed, therefore another attempt to test the psychological barrier of $ 100 should not surprise us.
At this point, it’s worth mentioning that crude oil still remains in the declining trend channel. If the oil bears manage to push the price below $100, we will likely see further declines to the lower border of the trend channel (currently slightly above $99), which intersects with the 50% Fibonacci retracement level and the June high.
Looking at the above chart, we see positive divergences between all three indicators and the price of light crude. Taking the above facts into account, it seems that the current corrective move is quite limited.
Summing up, crude oil dropped below the 38.2% Fibonacci retracement level and the breakdown is confirmed, which suggest that further declines are quite likely. However, we should keep in mind that light crude reached the psychological barrier of $ 100 and remains above the September 2012 top, which is a medium-term support level. Additionally, there are positive divergences between three indicators (the RSI, the Commodity Channel Index and the Stochastic Oscillator) and the price of light crude. Taking the above into account and combining it with the fact that crude oil remains in the declining trend channel, it seems that further declines are quite limited.
Once we know the current outlook for crude oil, let’s examine the NYSE Arca Oil Index (XOI) to find out what the current outlook for oil stocks is and to check if they confirm or invalidate the above analysis of the crude oil market.
Oil Stocks
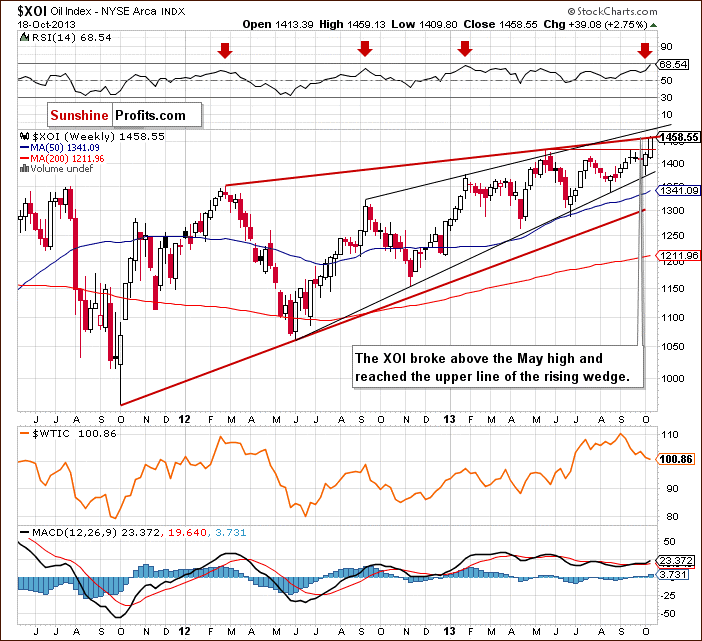
We begin with the long-term chart and almost immediately see that the situation has improved.
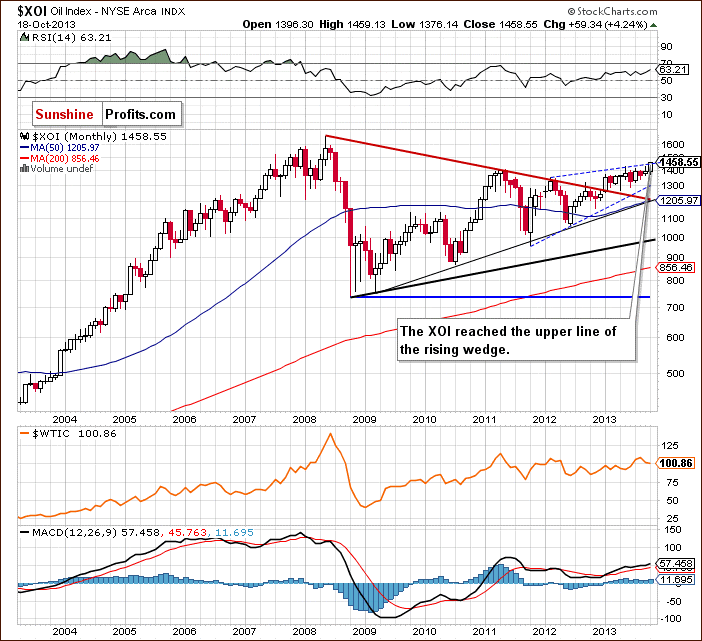
On the above chart we see that the XOI broke above the May 2013 high and reached the upper line of the rising wedge. Please note that in this area there’s a very important Fibonacci retracement level - 78.6% (close to 1,467) based on the entire May-October 2008 decline, which may slow the rally. However, if the buyers don’t give up and manage to push the oil stock index above this resistance, we will see further growth and the next target level will be around 1,560.
The XOI still remains above the previously-broken long-term declining resistance line based on the 2008 and 2011 highs and the breakout hasn’t been invalidated. Therefore, taking these observations into account, the situation is very bullish.
To see this more clearly, let’s zoom in on our picture and move on to the weekly chart.
Quoting our previous Oil Investing Update:
(…) the recent corrective move has taken oil stocks to the medium-term support line (marked in black), which is also the lower border of the rising wedge. As you see on the weekly chart this strong support line stopped declines once again. Taking this fact into account, further growth is quite likely.
As you can see on the above chart, the oil stock index continued its rally in the previous week and broke not only above the September high, but also above the May top. In this way, it also reached the upper line of the rising wedge (marked with the red bold line). At this point, it’s worth mentioning that this resistance is reinforced by the 100% Fibonacci price projections (at 1,454). In this case, we take into account three data points: the Oct. 3, 2011 low, Feb. 27, 2012 top and Jun. 4, 2012 low. Therefore, further increases may be restrained by this strong resistance zone.
The proximity of the above resistance may encourage oil bears to go short and trigger a correction. In this case, the first support zone would be around 1,428-1,430 (the May and September highs). The second support level would be at 1,400 and the next one would be the medium-term support line (currently close to 1,380).
From this point of view, the medium-term uptrend is not threatened, and the situation remains bullish. It’s worth noting that even if the buyers manage to push the XOI higher, further increases may be restrained by the upper line of the smaller rising wedge (marked with the black line), which intersects with the 78.6% Fibonacci retracement level (close to 1,467) based on the entire May-October 2008 decline and forms a strong resistance level.
At this point, we’ll focus on the relationship between light crude and the oil stocks.
When we take a look at the above charts and compare the price action in both cases, we clearly see that oil stocks were stronger in the previous week once again. They broke not only above the September high, but also above the May top, which resulted in the highest weekly close since June 2008. What happened with the price of crude oil at the same time? Light crude declined once again and closed at its lowest level since June. Additionally, it dropped to a new October low, which clearly shows its weakness in relation to oil stocks.
Now, let’s turn to the daily chart.
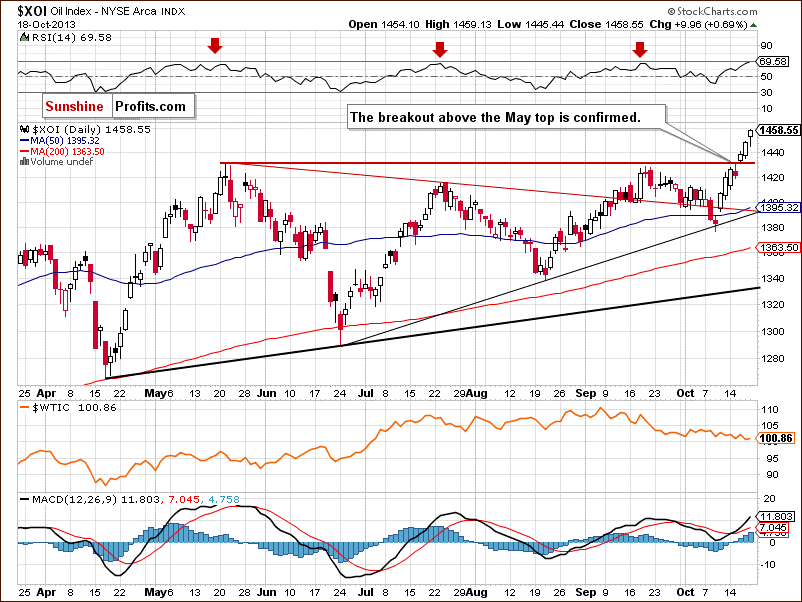
Looking at the above chart, we see that at the beginning of the previous week, the XOI broke above the September high and reached the May top. This strong resistance level encouraged sellers to trigger a correction. Although they pushed the oil stock index below 1,420, this deterioration was only temporary. On Wednesday, after a higher open, oil stocks broke above the May high and continued the rally in the following days.
As mentioned earlier, the nearest resistance is the upper line of the smaller rising wedge (marked with the black line on the weekly chart), which intersects with the 78.6% Fibonacci retracement level (close to 1,467) based on the entire May-October 2008 decline.
The nearest support is based on the previously-broken May and September highs. The next one is based on the declining resistance/support line, which currently almost intersects with the 50-day moving average (currently around 1,395). This area is also reinforced by the bullish morning star candlestick pattern.
Now, let’s comment on the relationship between the WTI and the XOI in the short term.
In the previous week, we saw strong negative correlation between light crude and the oil stocks. Although there was a small decline on Tuesday, which pushed the oil index below the September high, the sellers didn’t have enough strength to trigger a bigger corrective move. These circumstances encouraged buyers to act and resulted in a breakout above the May high and a rally in the following days. Please note that the breakout is now confirmed. At the same time, oil bulls didn’t manage to push the price of crude oil above the 38.2% Fibonacci retracement level, which resulted in further deterioration and a new monthly low. Additionally, the breakdown is confirmed, which is a bearish sign.
Summing up, from the long-, medium- and short-term perspectives the outlook for oil stocks remains bullish and the uptrend is not threatened at the moment. Taking into account the relationship between light crude and the oil stock index in the previous week, we clearly see that the oil stocks still remain stronger in relation to crude oil.
Once we know the above relationship, let’s take a closer look at the chart below and check the link between crude oil and gold.
Crude Oil – Gold Link
Looking at the above chart, we see that both commodities rose together on Monday and Wednesday, however, in the case of crude oil, sellers managed to push the price to a new monthly low on Thursday. At the same time, we saw a sharp pullback in gold, which took it to a new weekly high, which means that the yellow metal was clearly stronger in relation to light crude in the previous week.
Taking the above into account, we see that right now crude oil doesn’t follow gold higher even on a short-term basis – it doesn’t seem that gold could push oil much higher in the near term if the outlook for the yellow metal were positive. Is it positive?
Let’s take a closer look at the medium-term outlook for gold. Let’s turn to its weekly chart.
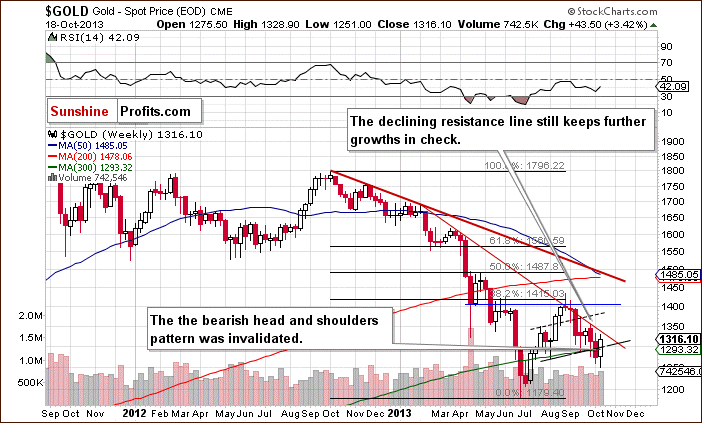
On the above gold chart, we can see that the head and shoulders pattern was invalidated “once again”. Although the invalidation by itself is a bullish sign, we should keep in mind that the declining resistance line based on the October 2012 and February highs still keeps further growth in check. It stopped gold bulls in September and earlier this month.
From this point of view, it seems that as long as there is no confirmed breakout above this line, further increases are not likely. Therefore, in spite of the recent show of strength, the medium-term outlook remains bearish.
Before we summarize our today’s Oil Investment Update, we have decided to examine the relationship between crude oil and the U.S. currency in the short term. At the beginning of the month crude oil prices were supported by a weaker U.S. dollar as commodities priced in the dollar became less expensive for holders of other currencies. Did this relationship remain in place in the following days? Let’s take a closer look at the chart below.
Crude Oil – U.S. dollar Link
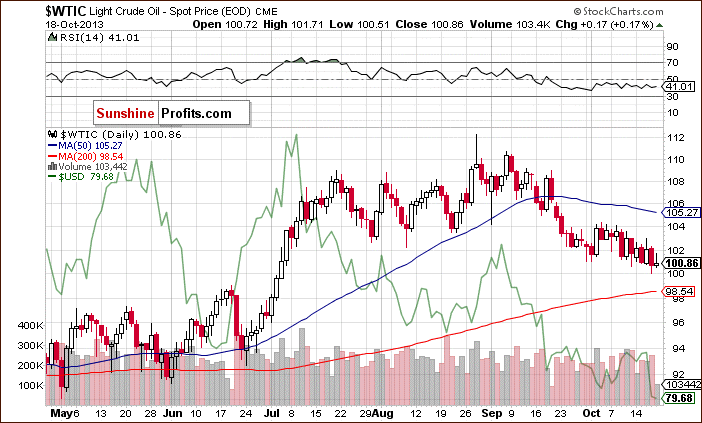
On the above chart we see that at the beginning of the month the dollar was under selling pressure as a U.S. government shutdown began. These circumstances resulted in a downward move, which took the U.S. currency to its lowest level since February. At the same time, crude oil rose to its monthly high of $104.38, which confirmed a strong relationship between them. However, it seems that in the following days this negative correlation waned. Although there were several days in which a stronger dollar triggered lower prices of crude oil, we almost immediately saw an invalidation of this tendency. Additionally, on Thursday, the dollar and crude oil dropped together. In case of crude oil, we saw a new monthly low. What’s interesting, on the following day we also saw a new October low for the U.S. dollar.
Looking at the above chart, we see that a weaker U.S. dollar hasn’t always been so bullish for crude oil. Please note that a big part of the June-July rally in light crude coincided with higher values of the dollar. We saw similar price action in both cases in mid-June, in August and then again at the beginning of September. It seems that in this period of time, a stronger dollar pushed light crude higher, not lower. What’s interesting, when the U.S. currency declined it usually triggered corrective moves in light crude in the following days. It was clearly visible at the beginning of September. Please note that the whole September-October decline in the dollar didn’t result in a rally in crude oil. Therefore, we can conclude that although there are short periods of time when the price of light crude is supported by a weaker dollar, overall, they have been positively correlated in the recent months. If this relationship remains in place and we see a rebound in the greenback, we will likely see a pullback in crude oil in the following days as well.
The medium-term picture for the USD Index was featured in our latest Premium Update, but given the relationship described above, it seems important to discuss the dollar itself also here. You will find the medium-term USD Index chart below, along with bits from the said Premium Update:
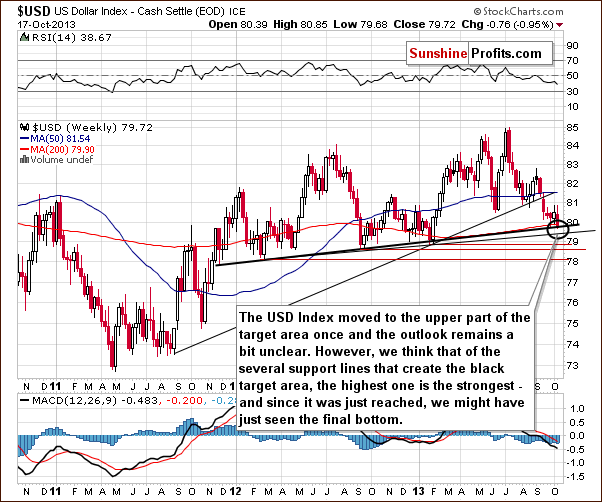
On the above chart, we see that the USD Index reached the upper part of the target area (marked with a black ellipse) once again. Additionally, the dollar dropped to the medium-term support line based on the February, September 2012 and January 2013 lows (a bold black line), which means that the final bottom of the recent corrective move might be already in or we we’ll see it soon, without an additional significant decline.
Even if the USD Index moves lower - to the next support line based on the September 2012 and the January lows (currently around 79.5), it still will be in the target area. Therefore, from this perspective, the situation will not change much. As long as the dollar remains above this level, further declines will likely be very limited. We would need to see a confirmed breakdown below this level to change the outlook to bearish.
Summing up, since the USD Index is set to rally, we might see some strength in the crude oil sector as well - at least based on the USD - crude oil link.
Summary
In the previous week, crude oil was clearly weaker in relation to oil stocks and strong negative correlation between light crude and the oil index was even more visible than earlier this month. The XOI broke not only above the September high, but also above the May top, which resulted in the highest weekly close since June 2008. Additionally, the breakout is confirmed now (in terms of daily closing prices). Consequently, further growth (to at least 1,467) is still likely. What happened with the price of crude oil at the same time? Oil bulls didn’t manage push the price of crude oil above the 38.2% Fibonacci retracement level, which resulted in further deterioration and a new monthly low. Please note that the breakdown below the above Fibonacci retracement level is confirmed, which is a bearish sign. Therefore, another attempt to test the psychological barrier of $ 100 should not surprise us. Taking the above facts into account, it seems that lower prices of crude oil may be accompanied by higher values of the oil index. However, we should keep in mind that oil stocks reached a very strong resistance zone and light crude dropped to important support, which may result in a reversal of the current trend. Therefore, we should pay special attention to both light crude’s and oil stock’s behavior in the coming days.
Looking at the relationship between crude oil and gold, we notice further negative divergences. Although both commodities rose together on Monday and Wednesday, on Thursday the price action was quite different. Crude oil saw a drop to a new monthly low, meanwhile the yellow metal climbed to its new weekly high. Taking into account the current situation in both commodities and their support and resistance levels, it seems that this negative correlation between them may last in the following days.
Please note that although crude oil confirmed the breakdown below the 38.2% Fibonacci retracement level, it still remains above the psychological support of $100 per barrel and the September 2012 high, which together form a strong support. At the same time, the yellow metal remains below the declining resistance line which has already successfully stopped buyers several times.
Very short-term outlook: bearish
Short-term outlook: mixed with bearish bias
MT outlook: mixed
LT outlook: bullish
Trading position (short-term): We do not suggest opening short positions yet. If we see a breakdown below the lower border of the declining trend channel (based on the Sept. 3 and Sept. 30 lows), we will consider opening speculative short positions.
This completes this week’s Oil Investment Update. Our next Oil Investment Update is scheduled for Tuesday, Oct. 29, 2013. Oil Trading Alerts subscribers will additionally receive similar but shorter alerts on a daily basis (or more than once a day when the situation requires it).
Thank you.
Nadia Simmons
Sunshine Profits' Crude Oil Expert
Oil Investment Updates
Oil Trading Alerts

