
Crude Oil
Looking at the chart of crude oil from today’s point of view, we can conclude that September was a hard month for oil bulls. After the June-August rally, which resulted in a new 17-month high, the situation in the oil market deteriorated. The price of light crude dropped from the September high at $110.70 to a new monthly low at $102.20 per barrel. With this move crude oil lost 4.62% and closed the previous week slightly above a strong support zone. Before we jump in to the world of charts, let’s take a look at the recent circumstances which had a great impact on the price of crude oil.
The first bearish factor, which resulted in a corrective move was Russia’s proposal to help put Syria's chemical weapons under international control. The major factor which drove the price of light crude in August and earlier this month faded.
In the following week we had the Fed’s unexpected statement, which triggered enthusiasm in the markets. However, prices began to fall after investors realized that the world’s largest economy isn’t yet strong enough to withstand the withdrawal of monetary stimulus.
Crude oil gave up earlier gains and dropped below $107 in the following days as Libya's production recovered to nearly 40% of pre-war capacity after protesters agreed to reopen major western fields.
At the beginning of the previous week, we saw further declines as South Sudan pipeline exports increased to 240,000 barrels per day. 170,000 bpd came from fields in Upper Nile state producing the heavy sour Dar Blend, its main crude product. The rest comes from oilfields in Unity, where output is mixed to produce the light sweet Nile Blend. Additionally, Iraq boosted output from its Rumaila field after plugging a leaking pipeline, although planned work continued to keep a lid on exports from OPEC's No. 2 producer after Saudi Arabia.
Speaking of the Saudi Arabia… Last week, Saudi Arabian Oil Minister Ali al-Naimi further allayed supply fears when he said the market had enough supply and prices were at a favourable level, affirming the willingness of the world's top crude exporter to meet shortages.
What about the supply picture in the U.S.?
On Wednesday, the U.S. Energy Information Administration weekly inventory data showed a 2.6 million barrel build in domestic crude inventories, which was an additional bearish factor, that pushed the price of light crude lower.
These circumstances, in conjunction with Iran's "constructive" talks with the United Nations about its nuclear program, pushed the price of crude oil down.
In our previous previous Oil Investment Update we wrote that another factor, which also influenced the price of light crude, was a positive tone in U.S.-Iranian relations. Since Iranian President Hassan Rouhani decided to meet in New York with world powers and talk about Teheran’s nuclear program, the oil market has been watching closely all the US-Iran news. Last Monday, President Rouhani said that this nuclear program was not for weapon making. It’s worth mentioning that Iran consistently has defended its right to enrich uranium as part of a civilian nuclear energy and medicine program, but the United States and its allies have sought an end to higher-grade uranium enrichment that could be a step away from the production of weapons-grade material.
Last Tuesday, both presidents spoke at the United Nations General Assembly, but there was no handshake between them. Despite this fact, two days later, Iran's new government began its first talks on Teheran’s nuclear program with the United States and five other world powers. It was a very uncommon meeting between top officials of the United States and Iran, which have been estranged since Iran's 1979 Islamic Revolution that toppled the U.S. ally shah Mohammad Reza Pahlavi. This event led to the U.S. Embassy hostage crisis in Tehran, when 52 Americans were held hostage for 444 days.
Although, ther was no hanshake on Tuesday, both presidents spoke by telephone in the highest-level contact between the two countries in three decades on Friday.
At this point, it’s worth mentioning that President Rouhani said that Iran would bring a plan to resolve the decade-long dispute over Tehran's nuclear program to an October meeting with the six powers in Geneva.
Iranians are hoping to see relief from the painful U.S., European Union and U.N. sanctions for refusing to suspend its uranium enrichment program.
According to EIA, in 2012, Iran's exports of crude oil and lease condensate dropped to their lowest level since 1986 as the United States and the European Union tightened sanctions targeting Iran's oil sector. Now, Iran is earning around $100 million from oil sales a day as opposed to $250 million two years ago.
Sanctions affecting investment in Iran's oil sector have also been tightened and resulted in cancellation of new projects by several foreign companies; they also negatively affected existing projects. Following the implementation of sanctions in late-2011 and mid-2012, Iranian oil production dropped dramatically. Although Iran had been subject to four earlier rounds of United Nations sanctions, these much-tougher measures passed by the United States and the European Union have severely hampered Iran's ability to export its oil, which directly affected its production of petroleum and petroleum products.
Further sanctions were implemented against the Central Bank of Iran, while the EU imposed an embargo on Iranian oil and banned European protection and indemnity clubs (P&I Clubs) from providing Iranian oil carriers with insurance and reinsurance. The implementation of insurance-related sanctions was particularly effective in stemming Iranian exports, which affected not only European importers but also Iran's Asian customers who were forced to temporarily halt imports.
In August 2012, Iran's monthly crude oil production fell below Iraq's for the first time since 1989. In this way, Iraq became OPEC's No. 2 producer after Saudi Arabia.
Finishing this part of today‘s Update, we come back to the first bearish factor… On Friday, the United States and Russia reached an agreement on a draft U.N. Security Council resolution aimed at ridding Syria of its chemical weapons arsenal after weeks of diplomatic deadlock. In this way, fears over a disruption to supplies from the Middle East continued to fade away.
Having discussed the news about Iran, let’s now move on to the technical part of this week‘s Oil Investment Update and focus on the technical changes in the crude oil market. Just like a week ago, we take a look at the charts in different time horizons to have a more complete picture of the current situation in the oil market.
Let’s start with a look at the monthly chart of light crude (charts courtesy by http://stockcharts.com).
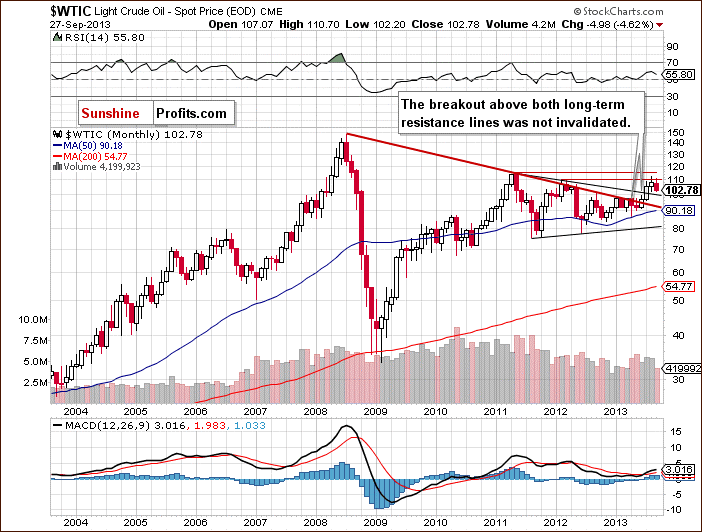
The situation in the long-term chart hasn’t changed much recently and most of what we wrote in our last Oil Investment Update is still up-to-date today.
(…) light crude still remains above the two long-term declining resistance lines: one of them (bold red line) is based on the July 2008 and the May 2011 highs, and the second one is based on the September 2012 and March 2013 highs (the upper black line).
From this perspective the picture is bullish and the breakout above these two long-term declining resistance lines hasn’t been invalidated.
Now, let’s zoom in on our picture of the oil market and see the weekly chart.
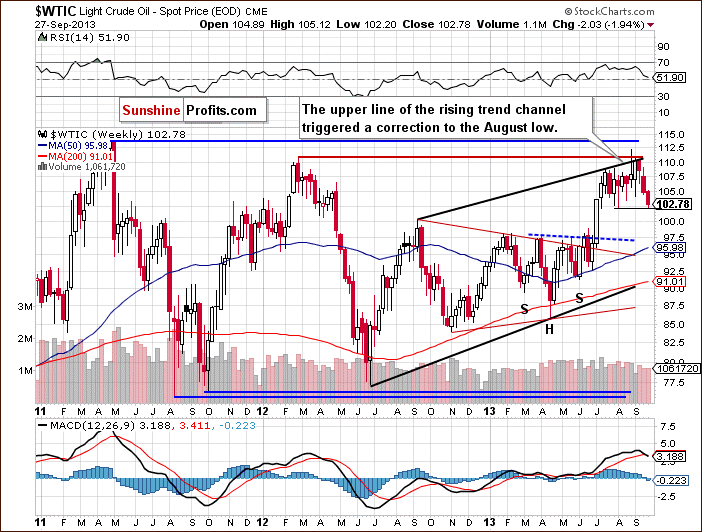
On the above weekly chart, we see further deterioration. The price of crude oil declined once again in the previous week and slipped slightly below the August 5 low. In this way, light crude dropped to a new monthly low after three unsuccessful attempts to break above the strong resistance zone based on the March 2012 top and the upper border of the rising trend channel.
Crude oil still remains in the upper part of the rising trend channel, but a new September low right before our eyes just doesn’t look too bullish. Therefore, from this point of view, the situation is still mixed.
Now, let’s check the short-term outlook.
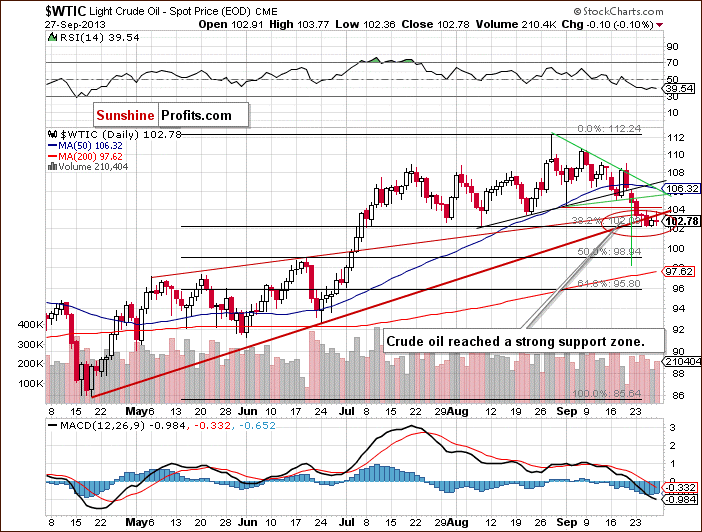
On the above chart we see that the situation has deteriorated since our last Oil Investment Update was published. On Monday, the price of light crude dropped below the September low, which encouraged sellers to act and resulted in further declines in the following days.
On Wednesday, oil bears showed their claws and pushed crude oil to its new monthly low at $102.20 per barrel. Light crude not only declined below the August low and the 38.2% Fibonacci retracement level on an intra-day basis, but also closed below the rising medium-term support line.
Despite these circumstances, the buyers have managed to hold the monthly low, which has some bullish implications for the very short-term picture.
On the other hand, we saw two attempts to move above the previously-broken rising medium-term support line, but they both failed and crude oil closed the whole week below it. Please note that the breakdown was confirmed, which has bearish implications for the very short term. Additionally, the breakdown below the 50-day moving average and the short-term rising support line was also confirmed.
Please note that the nearest strong support is the zone based on the August low and the 38.2% Fibonacci retracement level. If it is broken, the next one support zone will be slightly below $100 per barrel where the 50% Fibonacci retracement level intersects with the June high.
Summing up, although there has been a downward move in the recent days, which took the price of light crude to a new monthly low, technically, the situation hasn’t changed much. As long as crude oil remains above the previously mentioned strong support zone the uptrend is not threatened.
Once we know the current outlook for crude oil, let’s examine the NYSE Arca Oil Index (XOI) to find out what the current outlook for the oil stocks is and to check if they confirm or invalidate the above analysis of the crude oil market.
Oil Stocks
We begin with the long-term chart and almost immediately see that the situation has improved.
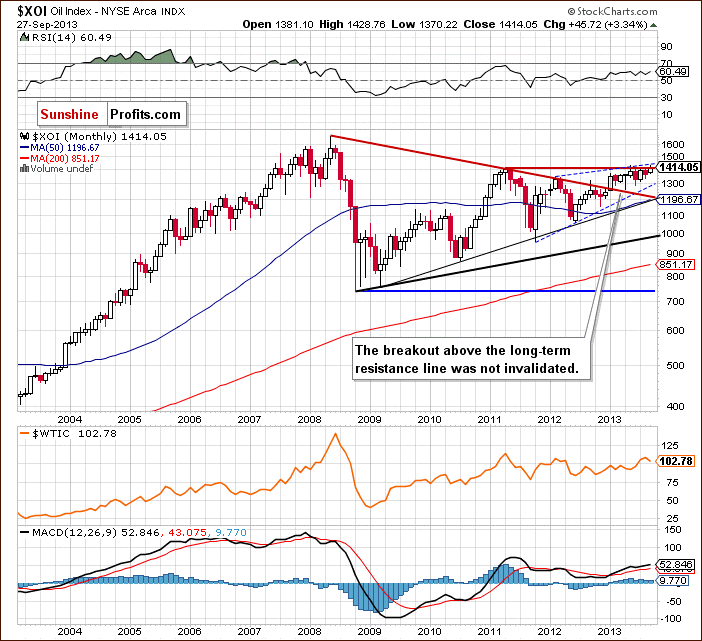
The XOI not only broke above the July top, but it also broke above the May 2011 high. If the buyers hold the oil index above 1,400 today, this will be the highest monthly close since June 2008.
Additionally, the XOI is still above the previously-broken long-term declining resistance line based on the 2008 and 2011 highs and the breakout hasn’t been invalidated. The oil index also remains in the range of the rising trend channel.
Taking these observations into account, the situation is still bullish.
To see this more clearly, let’s zoom in on our picture and move on to the weekly chart.
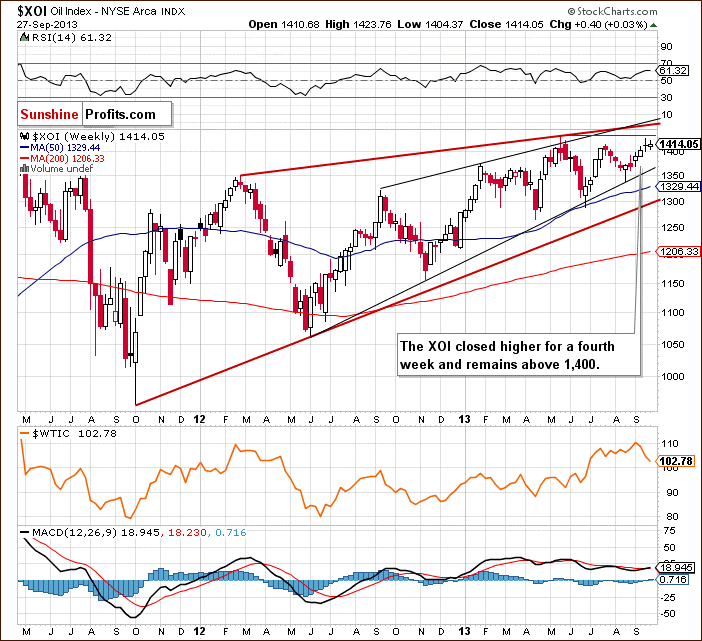
Looking at the above chart, we see that the oil stock index remains above the July peak (in terms of weekly closing prices), but the breakout is unconfirmed at the moment. It’s worth noting that the XOI closed higher for a fourth week and is still close to the May top. On top of that, when we take into account weekly closing prices, we notice that this is the highest weekly close since June 2008.
Quoting from our previous Oil Investment Update:
Taking the above into account, we should carefully keep an eye on the oil index. The proximity of the above resistance level may encourage oil bears to go short and trigger a correction. In this case, the first support will be around 1,400.
Please note that even if the buyers do not give up and manage to push the XOI higher, further increases may be retained by the upper line of the rising wedge (currently close to 1,450).
The medium-term uptrend is not currently threatened, and the situation remains bullish.
At this point, we’ll focus on the relationship between light crude and the oil stocks.
When we take a look at the above charts and compare price action in both cases, we clearly see that oil stocks were stronger in the previous week once again. They closed higher for a fourth week and remain above the July peak (in terms of weekly closing prices). What happened with the price of crude oil at the same time? Light crude declined and closed lower for a third week. Additionally, it dropped to a new September bottom on Wednesday, which clearly shows its weakness in relation to the oil stocks.
Now, let’s turn to the daily chart.
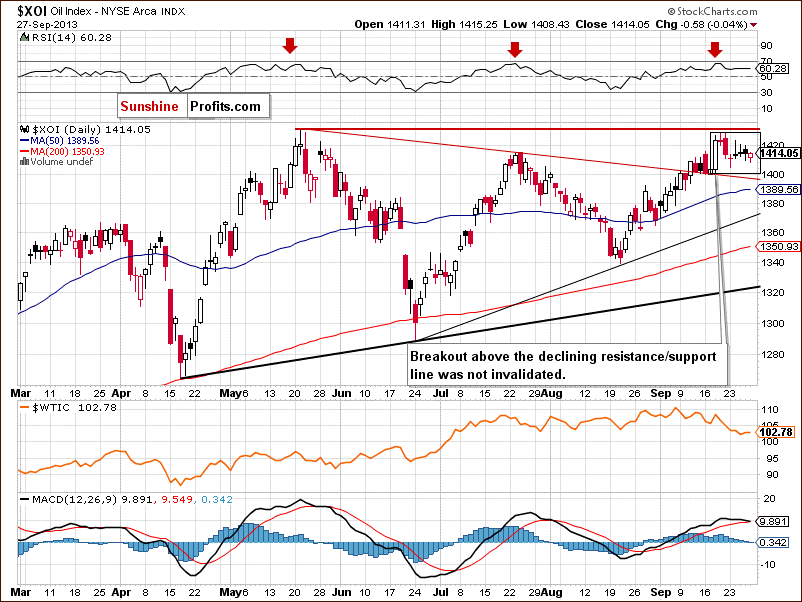
As you see on the above chart, the situation didn’t change much in the previous week. After a breakout above the declining resistance/support line based on the May and July highs, the oil stock index remains in the consolidation. At this point we should consider two scenarios. If the buyers manage to push the XOI above the September high, we will likely see another upward move, which may result in a breakout above the May high.
On the other hand, this strong resistance and may encourage sellers to go short. In this case, we may see a corrective move to at least 1,400. If the oil index drops below this level, we could see further declines .
Please note that the nearest support is the bottom of the current consolidation (the 1,400 level). The second one is the previously-broken declining resistance/support line (around 1,396), the next one the 50-day moving average (currently at 1,389.56). Going even lower, we have a support zone based on the August 27 and August 30 lows (1,361-1,364), and a further one based on the August 21 bottom and the 61.8% retracement level (1,338-1,339).
Now, let’s comment on the relationship between the WTI and the XOI in the short term. This time, we see a negative divergence between the price action in light crude and the oil stocks. Although we saw declines on Monday (in both cases), the rest of the week looked completely different. We’ve been seeing a consolidation in oil stock in the recent days and the NYSE Arca Oil Index is trading between the September 18 low and the September high. Meanwhile, in the case of crude oil we saw further deterioration which resulted in a new monthly low.
Summing up, from the long- and medium-term perspectives the outlook for oil stocks remains bullish and the uptrend is not threatened at the moment. Taking into account the relationship between light crude and the oil stock index in the previous week, we can conclude once again that the oil stocks remain stronger in relation to crude oil .
The above creates a very interesting opportunity for those of you who are using options as a speculative vehicle. As we explained in the report on taking advantage of corrections with options, at times a certain outcome can become more likely (based on technical reasons, like relative performance of a given part of the sector) but at the same time it is seen as less likely from the purely theoretical point of view. Option prices are determined by a number of factors and volatility of the underlying asset is one of them. Consequently, if oil declines (but, at the same time, it is quite obvious that it’s going to move higher once again) and oil stocks do nothing, this might create an interesting opportunity for option traders – options on oil stocks should become cheaper because of the decreased volatility and, at the same time, poised to rally even more than oil if their outperformance stays in place. With lower price at the beginning, the trade using these options should be much more profitable than in the case of options on crude oil itself.
Of course, this situation can be reversed and an analogous opportunity would emerge if we had a shorting opportunity after a move higher in oil stocks and no visible move in oil. In this case, it would be oil that would provide the opportunity as it would be more likely to decline more significantly.
Please note that this is not the case right now (none of the abovementioned situations) – the outlook is too unclear to open speculative positions in our view, however, the divergence can create a unique opportunity for option traders, so we are giving you the early heads-up.
Speaking of relationships, let’s take a closer look at the chart below and check the link between crude oil and gold. Let’s examine the daily chart.
Crude Oil – Gold Link
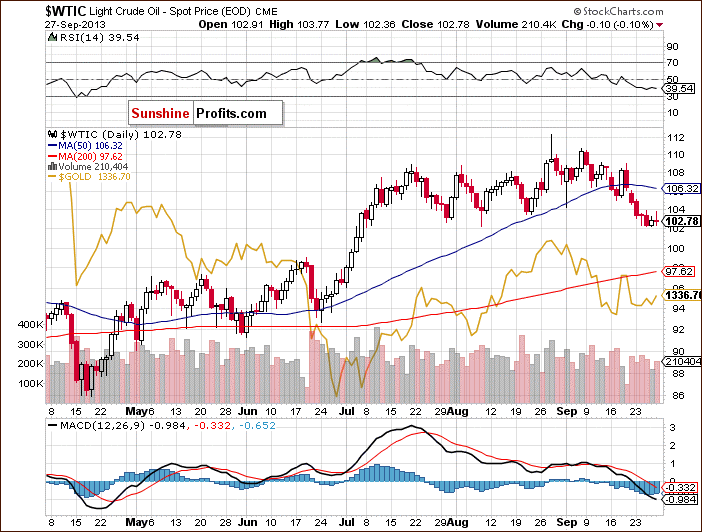
Looking at the above chart, we see similar price action in both commodities at the beginning of the previous week. They declined on Monday and hit new lows on Tuesday. However, in the case of gold, we saw a pullback in the following days. Meanwhile, crude oil declined and reached a new monthly low, which means that the yellow metal was stronger in relation to light crude once again.
Gold and crude oil moved quite closely together, but right now crude oil doesn’t follow gold higher even on a short-term basis – it doesn’t seem that gold could push oil much higher in the near term if the outlook for the yellow metal were positive. Is it positive?
Let’s take a closer look at the medium-term outlook for gold. Let’s turn to its weekly chart.
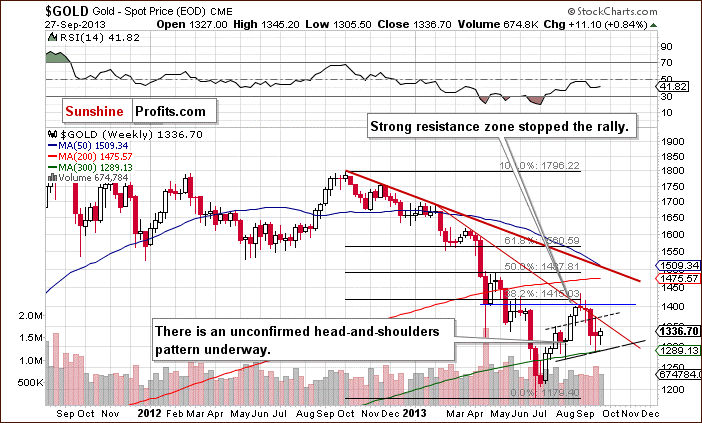
As you see on the above chart, gold still remains below the declining resistance line (based on the October 2012 and February highs), which successfully stopped growths earlier this month. Although there were three breakouts above this line, they all failed and the price of the yellow metal dropped below this line. If history repeats itself, we may see another unsuccessful attempt to move above this line in the coming week.
What is more, when we take a closer look at the weekly chart, we see an unconfirmed bearish head and shoulder pattern underway. According to theory, if gold drops below the neck level (currently close to $1,290), the price target for the pattern will be around $1,140.
From this point of view, it seems that the space for another upward move is quite limited. At this point, it’s worth noting that even if gold continues its rally and moves close to the dashed line (currently close to $1,375) or even to $1,400, the medium-term outlook will remain bearish.
Summary
In the previous week, the weakness of oil in relation to oil stocks was even more visible than earlier this month. The oil index closed higher for a fourth week and, what’s most interesting, this was its highest weekly close since June 2008. Additionally, if the buyers manage to hold the XOI above 1,400, it will be the highest monthly close since June 2008. Meanwhile, crude oil not only lost its major allies (the 50-day moving average and the short-term rising support line), but it also declined below the medium-term rising support line. Additionally, the breakdown is confirmed and light crude has hit its new monthly low.
Looking at the relationship between crude oil and gold, we notice another negative divergence. In spite of the connection that we saw in previous month, in this case, gold was stronger in relation to light crude, which means that gold may not impact the price of crude oil in a positive way in the coming weeks.
However, we should still keep in mind that the recent decline in crude oil is just slightly bigger than the previous ones and light crude remains in a strong support zone. Therefore, the uptrend is not threatened at the moment. At the same time, the downtrend in gold remains in place and the yellow metal remains below the declining resistance line, which successfully stopped buyers earlier this month. This means that gold is not likely to push crude oil much higher in the short term.
Very short-term outlook: bearish
Short-term outlook: mixed
MT outlook: mixed
LT outlook: bullish
Trading position (short-term): we do not suggest opening short positions at the moment. Although the situation is still bearish on a very short-term basis, the trade looks risky because of the strong support zone. We do not suggest opening long positions either, because there has been no breakout above the medium-term support/resistance line and the price of crude oil may test the strength of the previously mentioned strong support.
This completes this week’s Oil Investment Update. Our next Oil Investment Update is scheduled for Monday, Oct 7, 2013. Oil Trading Alerts subscribers will additionally receive similar but shorter alerts on a daily basis (or more than once a day when the situation requires it).
Thank you.
Nadia Simmons

