

Briefly: In our opinion, full (150% of the regular full position) speculative short positions in gold, silver and mining stocks are justified from the risk/reward perspective. This position was originally featured on Jan. 12, 2017 at 3:49PM.
For several years, it’s almost always been the case that gold and the Japanese yen moved together – both up and down. Last week, both moved up, but only gold moved above the previous highs. Is gold leading the yen higher or has the rally in gold already run its course (as mining stocks’ weakness seems to imply)?
Let’s take a closer look at the charts (charts courtesy of http://stockcharts.com).
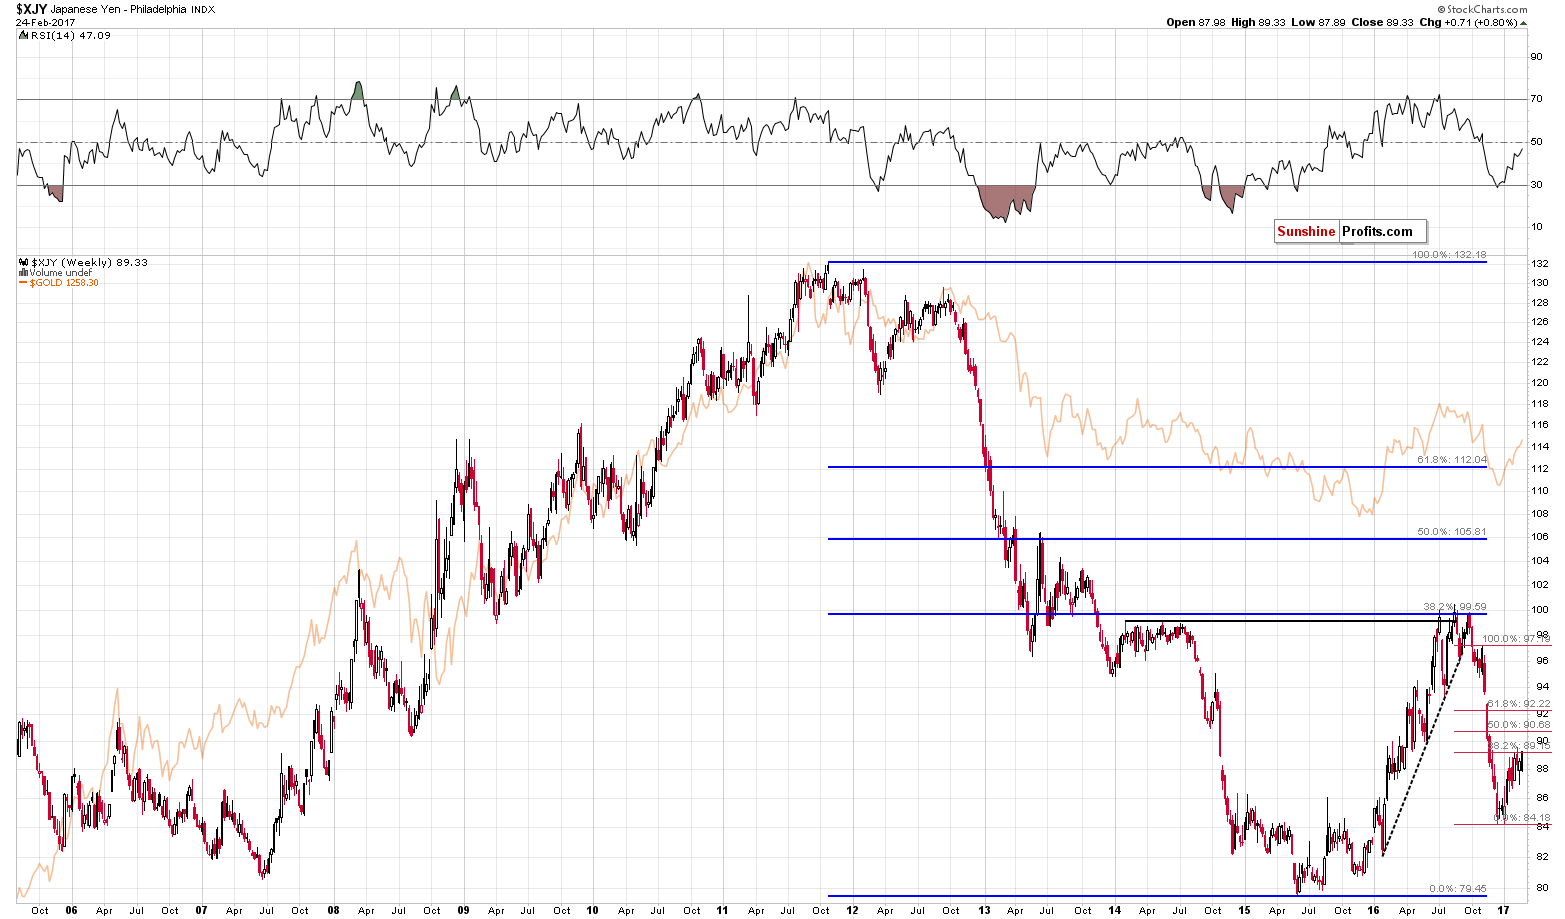
From the long-term point of view, we see that the yen once again moved to the 38.2% Fibonacci retracement and the recent high. Since there was no breakout, the outlook didn’t improve.
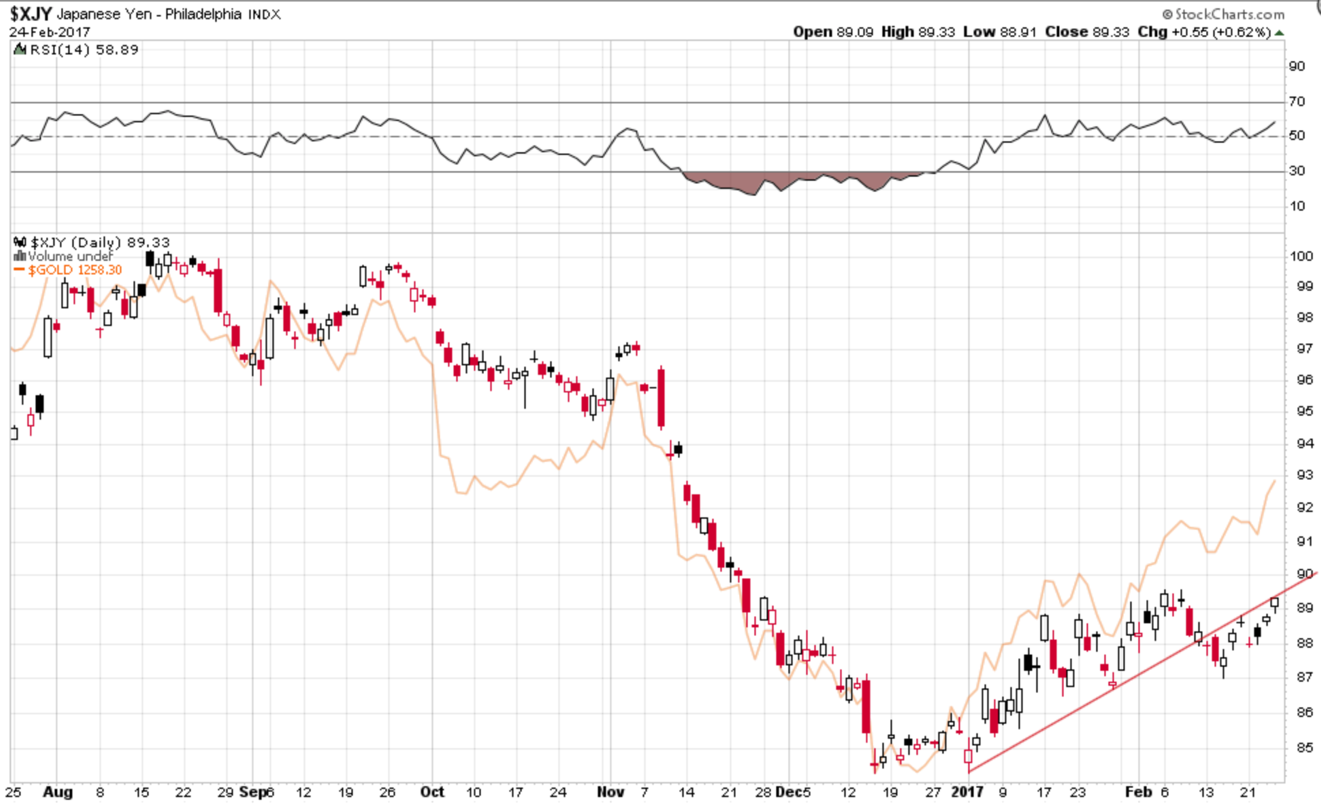
From the short-term point of view, we additionally see that the yen also moved to the rising resistance line, which is another reason to think that the rally in yen is over or very close to being over. Will gold manage to rally without the yen? That’s very unlikely as practically all big moves were seen simultaneously in both markets. The implications for the gold market are therefore bearish.
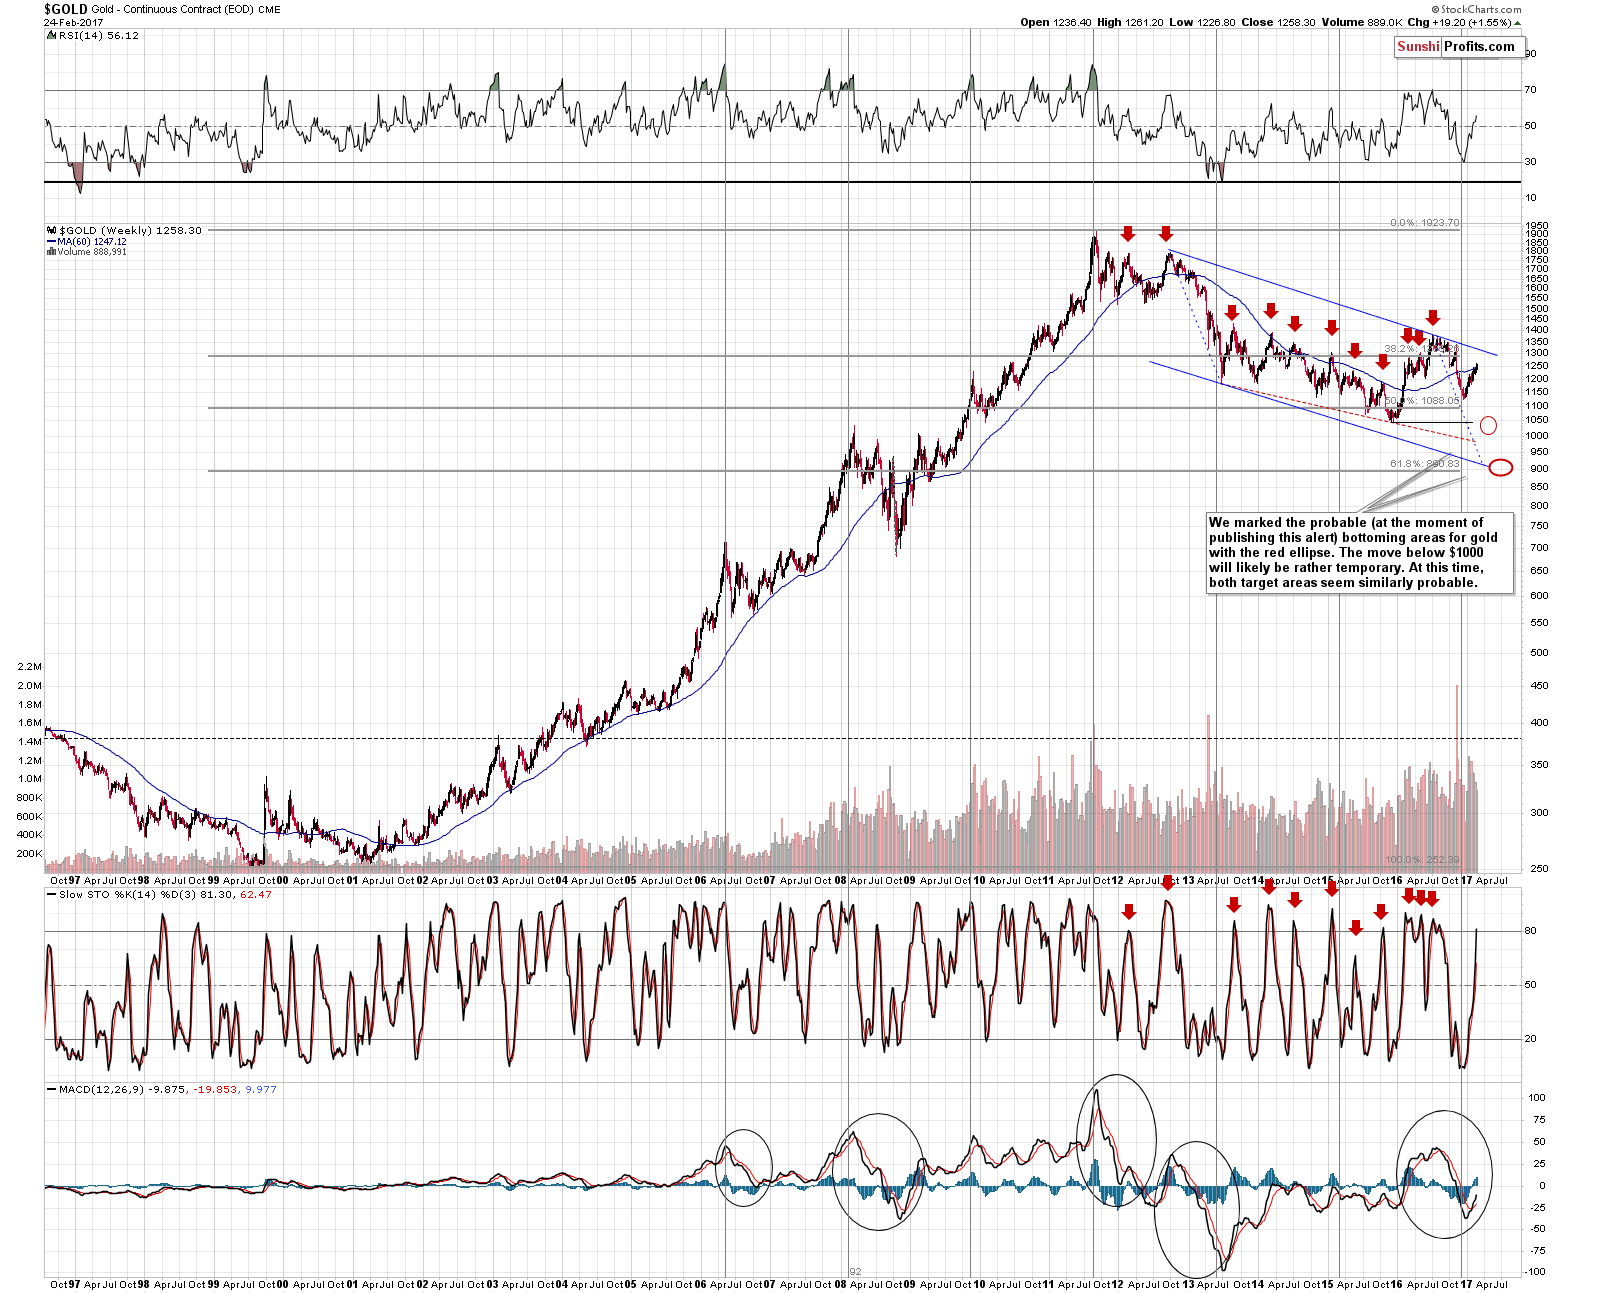
Speaking of gold, we see that it rallied about $19 last week. What’s particularly special about that? The comparison with what happened in gold stocks.
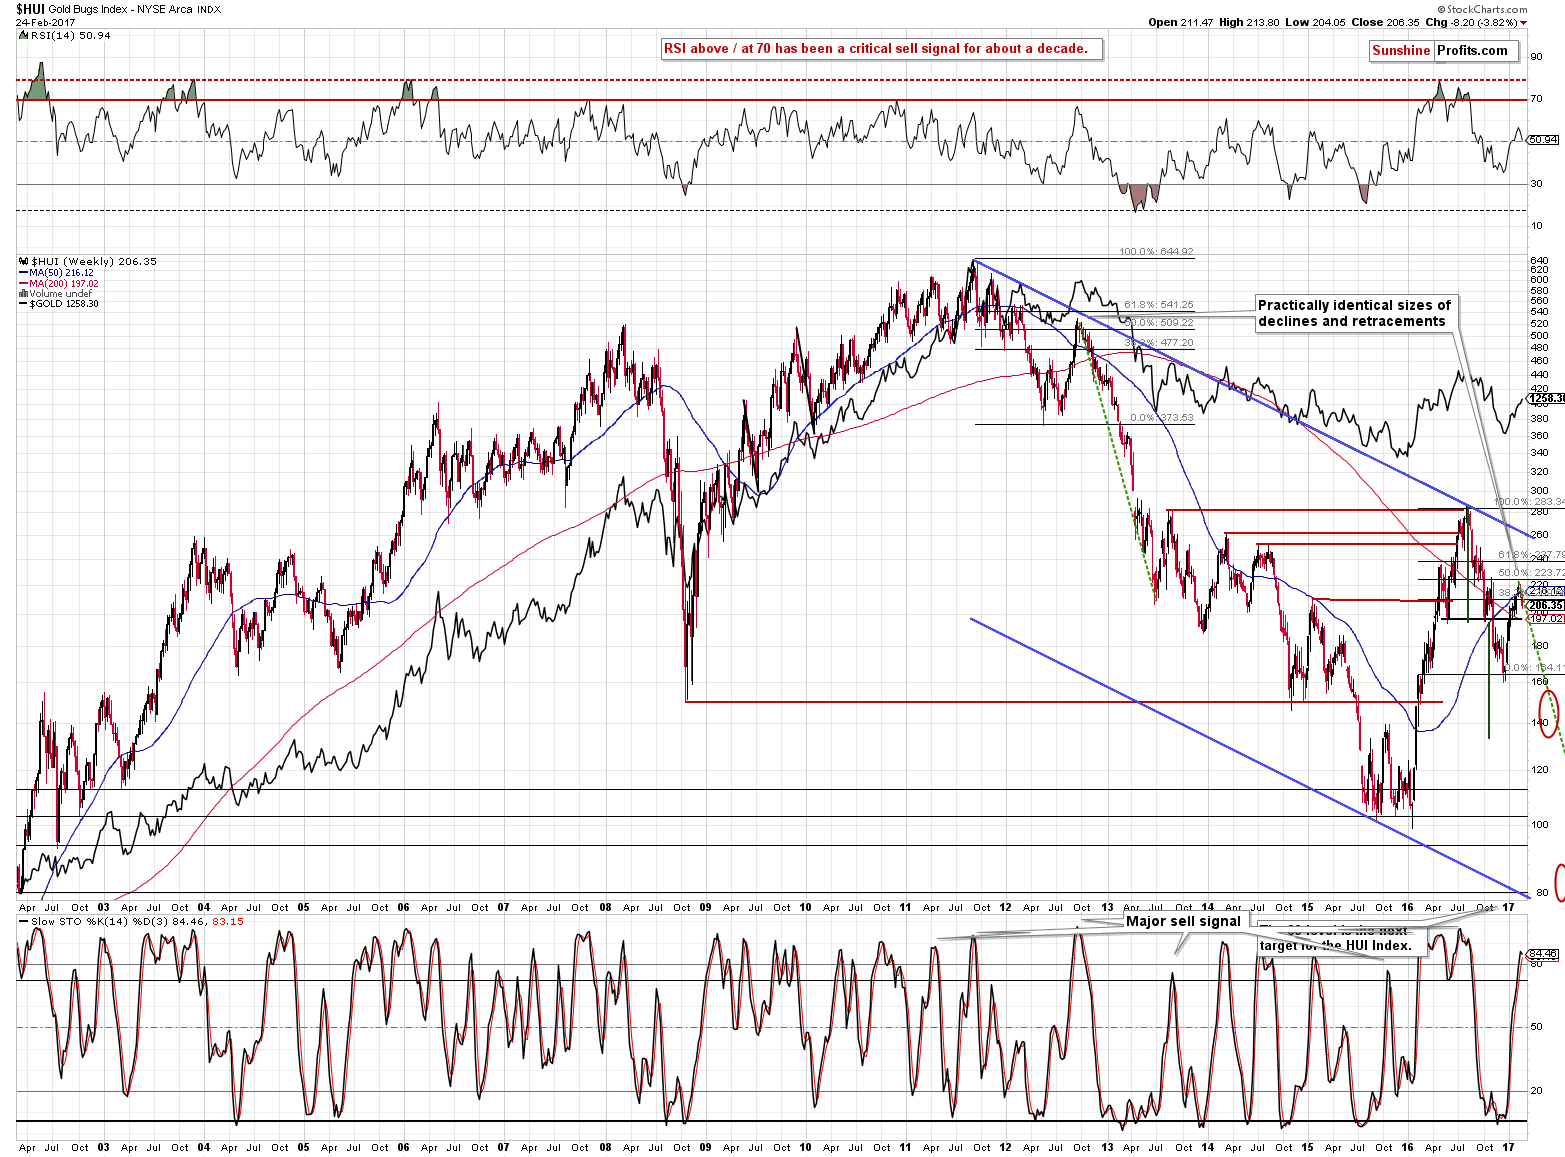
The HUI Index declined 8 index points (almost 4%) despite having very strong reasons to move higher. Not only did gold rally, but we also saw higher prices of stocks in general (highest weekly close ever in case of the S&P and DJIA) – miners should have rallied strongly and they weren’t just responding weakly – they declined, which is rather extreme. We saw something similar in 2012 and 2013, before the huge plunge in gold.
The above chart features something less visible but still very important. The size of the decline that followed the 2011 top and the size of the subsequent rebound (in the second half of 2012) is practically identical to the decline that we saw in the second half of 2016 and the current rebound. Back in 2012 gold stocks formed a local top after retracing about 50% of the previous decline and it appears that exactly the same thing happened also this time.
But the question remains if the top in metals was just formed or not. The upswing in gold and volume in GLD makes it quite likely.
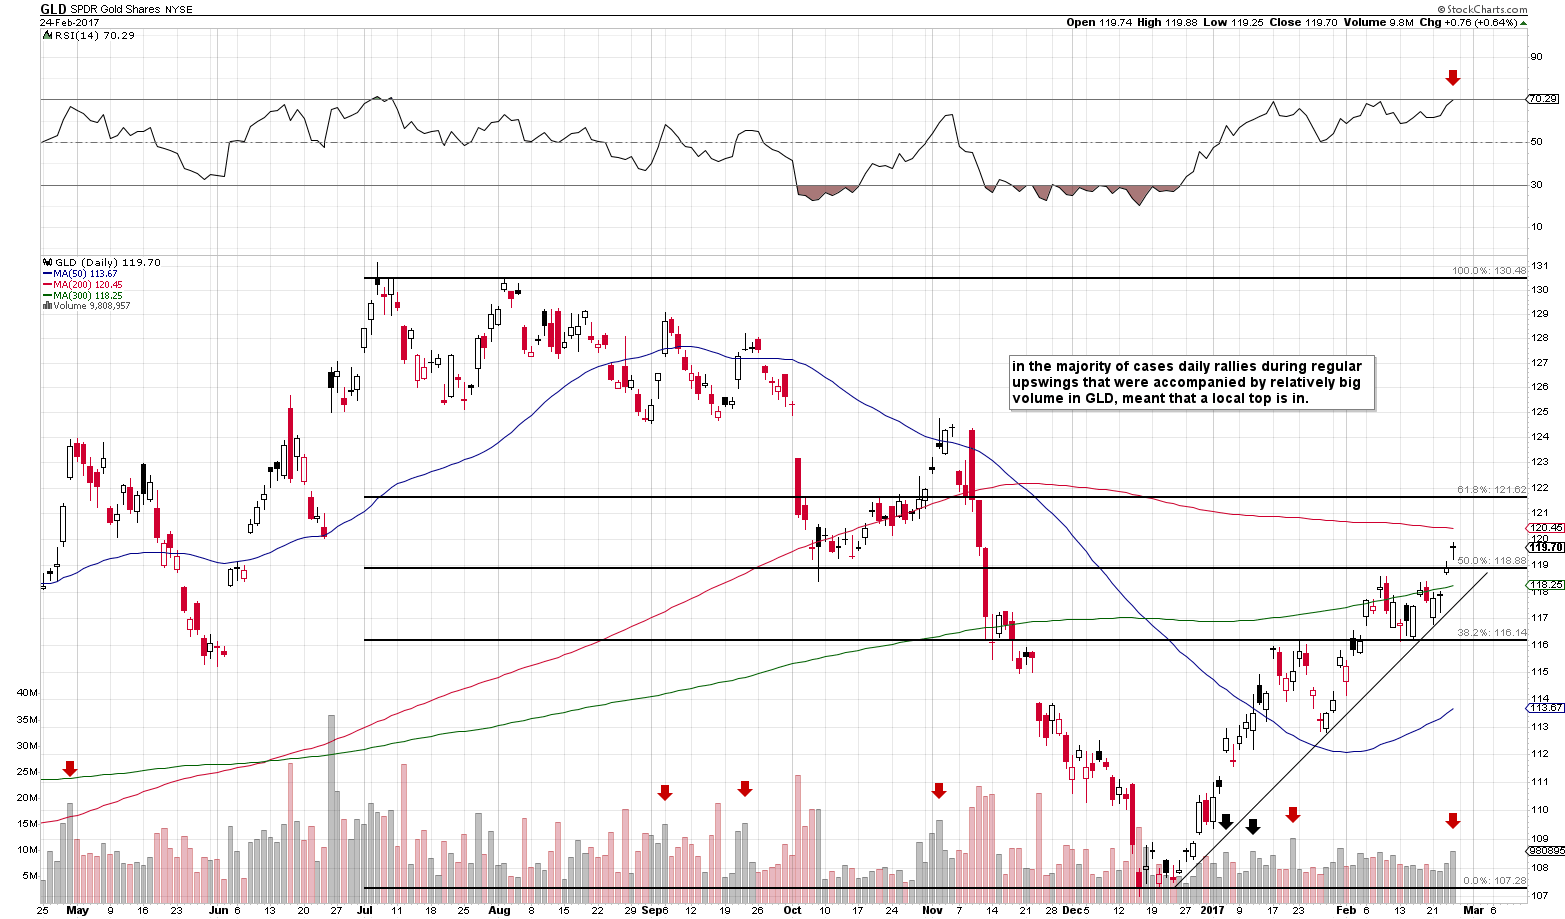
As you can see on the above chart, it was quite often the case that spikes in volume in GLD marked turning points if GLD was after a rather stable short-term rally. This appears to be the case right now, which is a bearish sign.
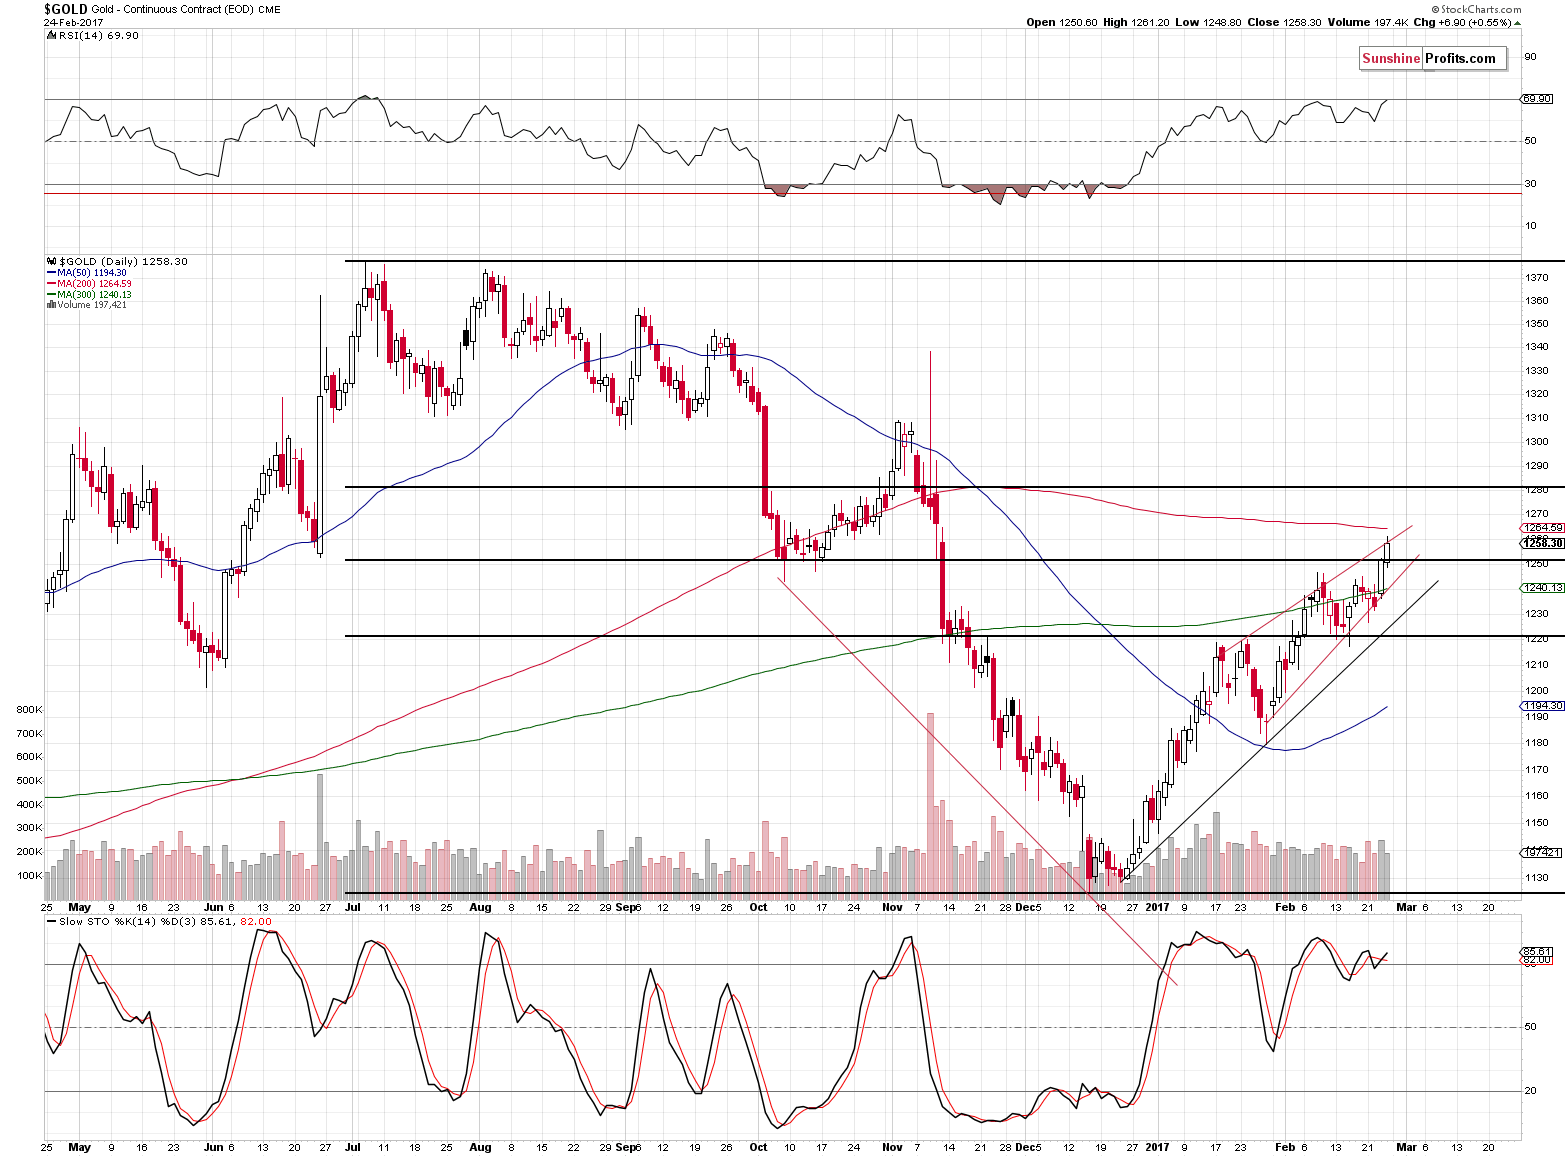
Gold moved to the upper border of the rising wedge pattern (based on closing prices), which could also mean that gold will reverse right away. That’s not the strongest bearish factor in place, but still, it’s something to keep in mind along with other – more important – factors.
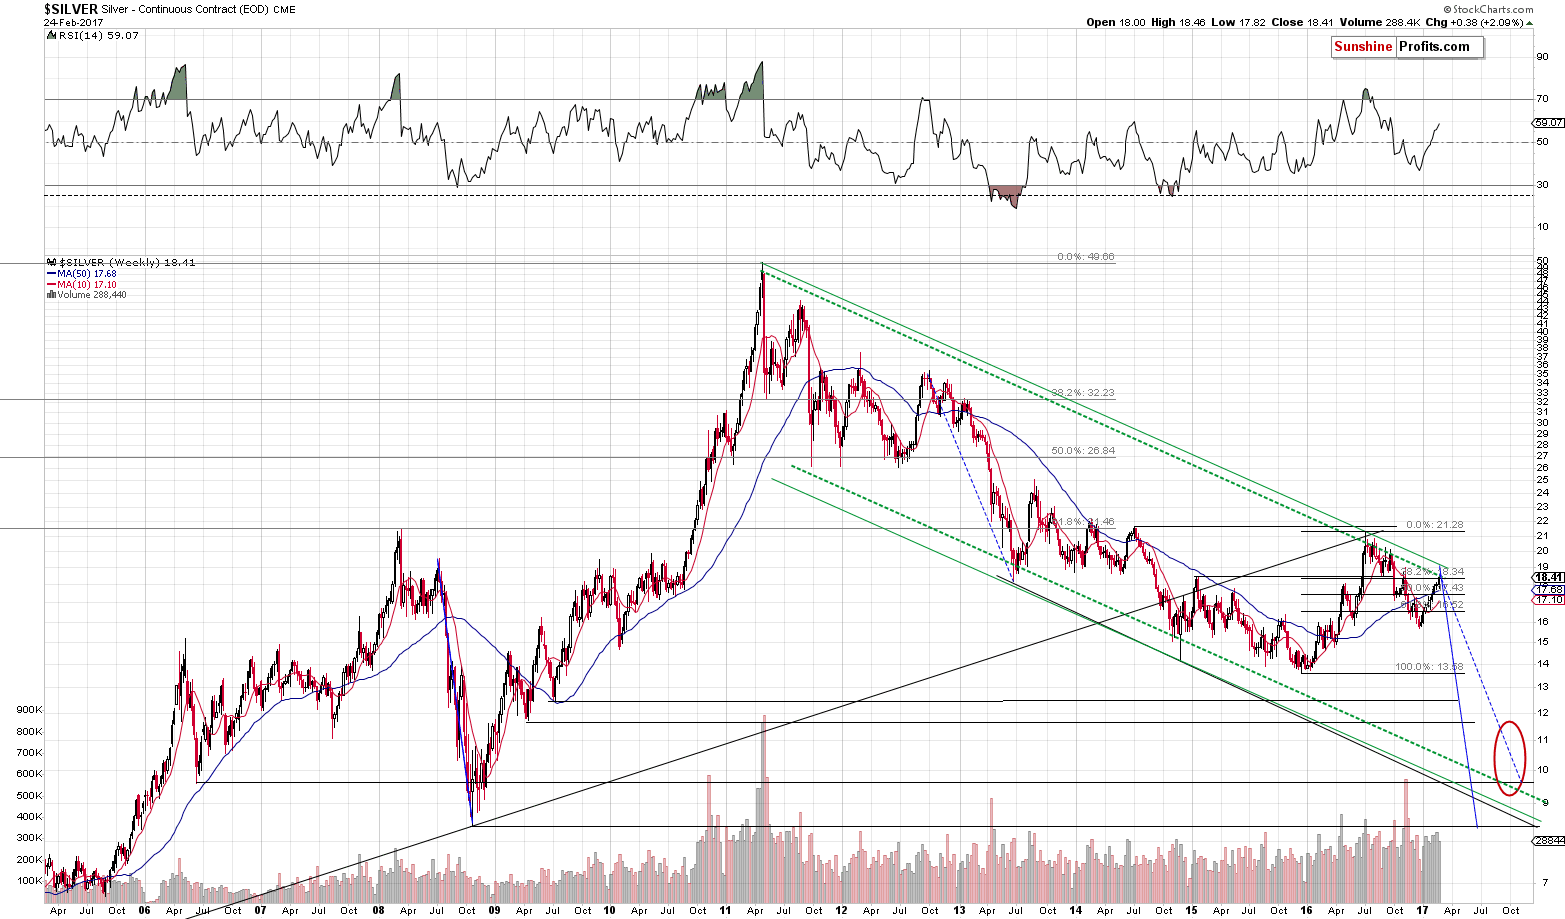
The interesting thing that happened in silver is that it moved to the long-term resistance line based on the weekly closing prices (green dashed line).
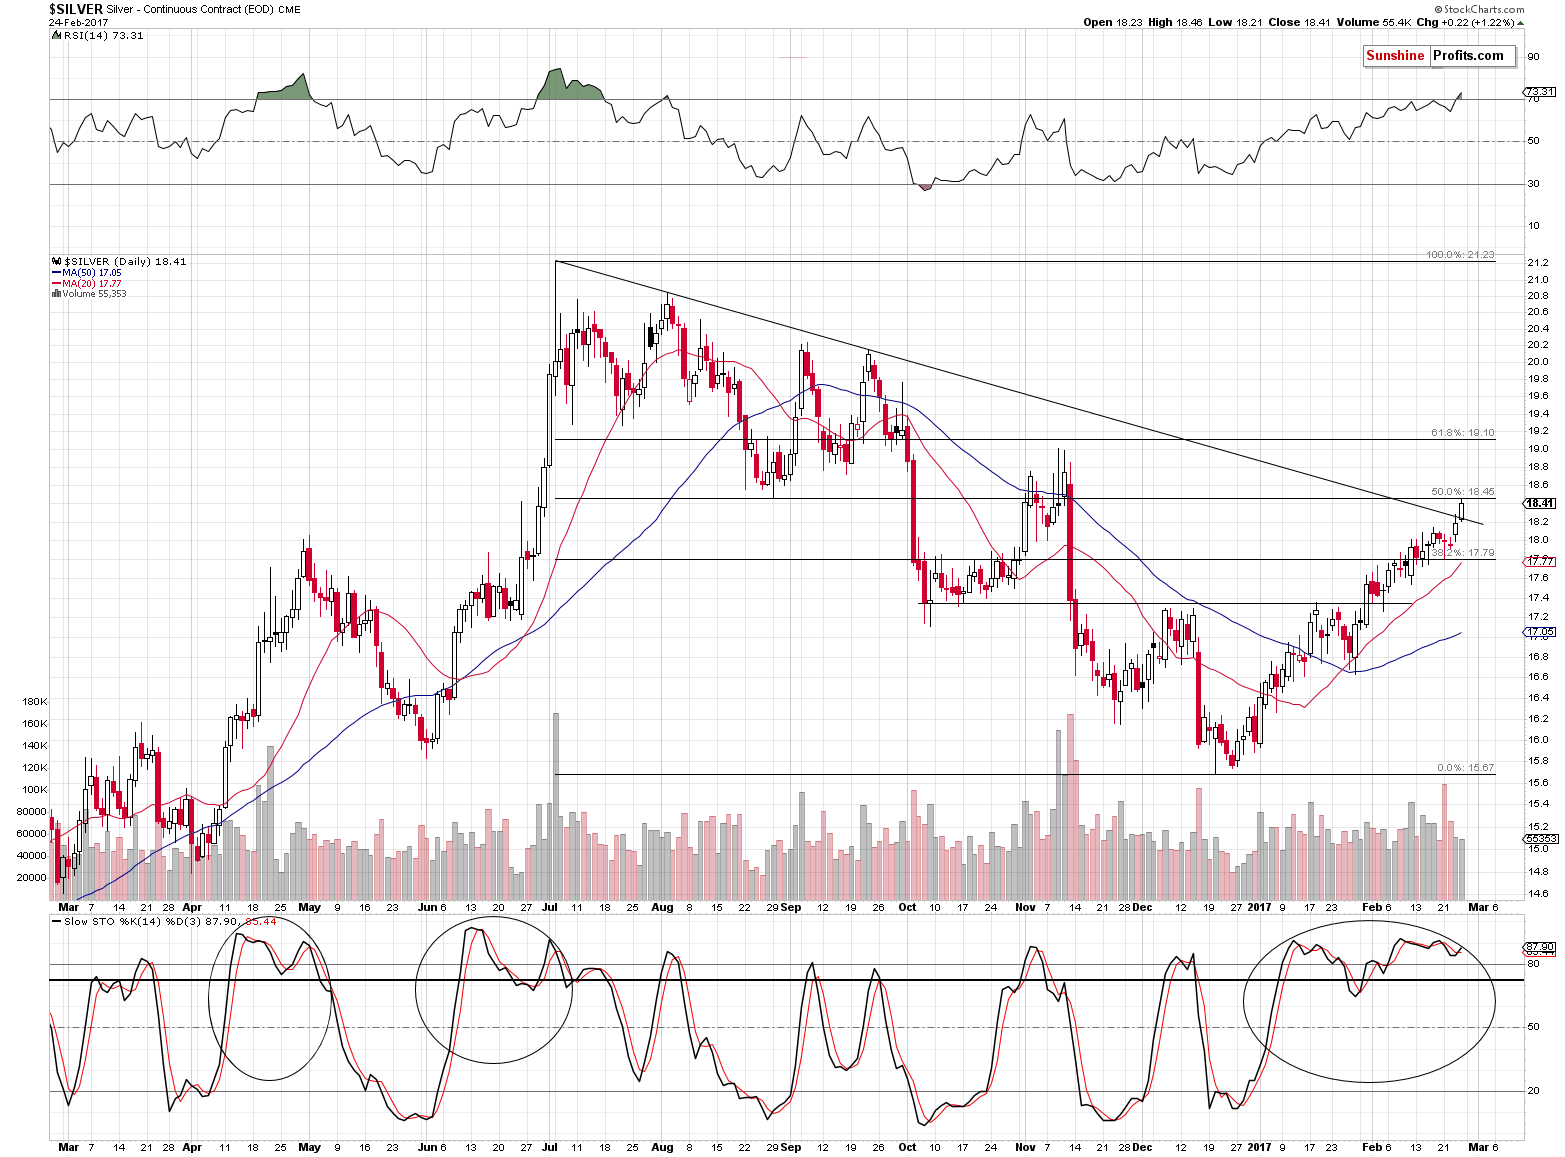
From the short-term point of view, however, we saw a small breakout and a move to the 50% Fibonacci retracement. Silver’s small breakout is not confirmed – that was only one daily close above the declining support/resistance line and the volume that accompanied it wasn’t big. So, did silver’s breakout change the outlook? No, as silver tends to provide fake signals if they are not accompanied by analogous ones from gold and mining stocks – and let’s not forget that mining stocks declined last week (also on Friday) which is exactly the opposite of a bullish confirmation.
Summing up, the bearish outlook for the precious metals sector remains in place. While the daily price changes are not particularly meaningful (except the miners’ underperformance – its implications are meaningful and bearish), the long- and medium-term signals that are very important (being highly effective in the past) continue to paint a very bearish picture for the precious metals sector for the upcoming weeks and months.
As always, we will keep you – our subscribers – informed.
To summarize:
Trading capital (supplementary part of the portfolio; our opinion): Short positions (150% of the full position) in gold, silver and mining stocks are justified from the risk/reward perspective with the following stop-loss orders and initial target price levels / profit-take orders:
- Gold: exit-profit-take level: $1,063; stop-loss: $1,273; initial target price for the DGLD ETN: $81.88; stop-loss for the DGLD ETN $48.17
- Silver: initial target price: $13.12; stop-loss: $18.67; initial target price for the DSLV ETN: $46.18; stop-loss for the DSLV ETN $19.87
- Mining stocks (price levels for the GDX ETF): initial target price: $9.34; stop-loss: $26.34; initial target price for the DUST ETF: $143.56; stop-loss for the DUST ETF $21.37
In case one wants to bet on junior mining stocks' prices (we do not suggest doing so – we think senior mining stocks are more predictable in the case of short-term trades – if one wants to do it anyway, we provide the details), here are the stop-loss details and initial target prices:
- GDXJ ETF: initial target price: $14.13; stop-loss: $45.31
- JDST ETF: initial target price: $104.26; stop-loss: $10.78
Long-term capital (core part of the portfolio; our opinion): No positions (in other words: cash)
Insurance capital (core part of the portfolio; our opinion): Full position
Please note that the in the trading section we describe the situation for the day that the alert is posted. In other words, it we are writing about a speculative position, it means that it is up-to-date on the day it was posted. We are also featuring the initial target prices, so that you can decide whether keeping a position on a given day is something that is in tune with your approach (some moves are too small for medium-term traders and some might appear too big for day-traders).
Plus, you might want to read why our stop-loss orders are usually relatively far from the current price.
Please note that a full position doesn’t mean using all of the capital for a given trade. You will find details on our thoughts on gold portfolio structuring in the Key Insights section on our website.
As a reminder – “initial target price” means exactly that – an “initial” one, it’s not a price level at which we suggest closing positions. If this becomes the case (like it did in the previous trade) we will refer to these levels as levels of exit orders (exactly as we’ve done previously). Stop-loss levels, however, are naturally not “initial”, but something that, in our opinion, might be entered as an order.
Since it is impossible to synchronize target prices and stop-loss levels for all the ETFs and ETNs with the main markets that we provide these levels for (gold, silver and mining stocks – the GDX ETF), the stop-loss levels and target prices for other ETNs and ETF (among other: UGLD, DGLD, USLV, DSLV, NUGT, DUST, JNUG, JDST) are provided as supplementary, and not as “final”. This means that if a stop-loss or a target level is reached for any of the “additional instruments” (DGLD for instance), but not for the “main instrument” (gold in this case), we will view positions in both gold and DGLD as still open and the stop-loss for DGLD would have to be moved lower. On the other hand, if gold moves to a stop-loss level but DGLD doesn’t, then we will view both positions (in gold and DGLD) as closed. In other words, since it’s not possible to be 100% certain that each related instrument moves to a given level when the underlying instrument does, we can’t provide levels that would be binding. The levels that we do provide are our best estimate of the levels that will correspond to the levels in the underlying assets, but it will be the underlying assets that one will need to focus on regarding the signs pointing to closing a given position or keeping it open. We might adjust the levels in the “additional instruments” without adjusting the levels in the “main instruments”, which will simply mean that we have improved our estimation of these levels, not that we changed our outlook on the markets. We are already working on a tool that would update these levels on a daily basis for the most popular ETFs, ETNs and individual mining stocks.
Our preferred ways to invest in and to trade gold along with the reasoning can be found in the how to buy gold section. Additionally, our preferred ETFs and ETNs can be found in our Gold & Silver ETF Ranking.
As always, we'll keep you - our subscribers - updated should our views on the market change. We will continue to send out Gold & Silver Trading Alerts on each trading day and we will send additional Alerts whenever appropriate.
The trading position presented above is the netted version of positions based on subjective signals (opinion) from your Editor, and the Tools and Indicators.
As a reminder, Gold & Silver Trading Alerts are posted before or on each trading day (we usually post them before the opening bell, but we don't promise doing that each day). If there's anything urgent, we will send you an additional small alert before posting the main one.
=====
Latest Free Trading Alerts:
This month, the World Gold Council (WGC) released a new edition of Gold Investor, its publication on the gold market. What can we learn from the report?
WGC’s February Gold Investor: Do Something!
S&P 500 index gained 0.2% on Friday, following a short-term downward correction and bounce off support level. Is this a topping pattern or just consolidation before another leg up? Is holding short position still justified?
Stock Trading Alert: Short-Term Uncertainty As Stocks Fluctuate Along New Record High
=====
Hand-picked precious-metals-related links:
US Mint Releases New Fort Knox “Audit Documentation”. The First Critical Observations.
10 mines still making good money if the gold price falls 50%
Australia's 2016 gold output highest since 1999: survey
=====
In other news:
Dollar treads water as investors eye Trump speech
Populism Is Shaking the Edifice of Central Bank Independence
Proposed Trump Budget to Hike Defense Spending, Cut EPA
Pound Drops as May Reported to Brace for New Scottish Referendum
Euro zone sentiment edges higher in Feb as expected
=====
Thank you.
Sincerely,
Przemyslaw Radomski, CFA
Founder, Editor-in-chief, Gold & Silver Fund Manager
Gold & Silver Trading Alerts
Forex Trading Alerts
Oil Investment Updates
Oil Trading Alerts

