

Briefly: In our opinion, full (150% of the regular full position) speculative short positions in gold, silver and mining stocks are justified from the risk/reward perspective. This position was originally featured on Jan. 12, 2017 at 3:49PM.
Gold rises on uncertainty and the greater the latter is, the higher the price of gold is likely to be – that’s intuitive. The question is: “How do we define what uncertainty precisely is, how do we measure it and how can we apply it to the current situation?” That’s what we discuss in today’s alert.
What’s not so intuitive about the positive link between gold and uncertainty is that when the uncertainty is extremely high… it tops, just like the price of gold. So, while high levels of uncertainty may indicate higher gold prices on the horizon, extremely high readings regarding uncertainty, may indicate lower gold prices in the following months. After all, the uncertainty doesn’t stay at extreme levels for long (at least that was the case in the past 20 years).
The question is: “How we can measure uncertainty?” The straightforward answer is: “In a way which measures its trading implications”. The more complex answer is that we need to measure it in a way that allows us to use it as a tool for sentiment analysis. One way is to check for headlines on major websites and in popular media in general, however, that’s not very quantitative. One way is to use an algorithm and check how often the word “uncertainty” is present in news. The more frequently it is mentioned, the greater the uncertainty really is. Another way would be to use an index dedicated to measuring uncertainty. The chart below features both approaches.
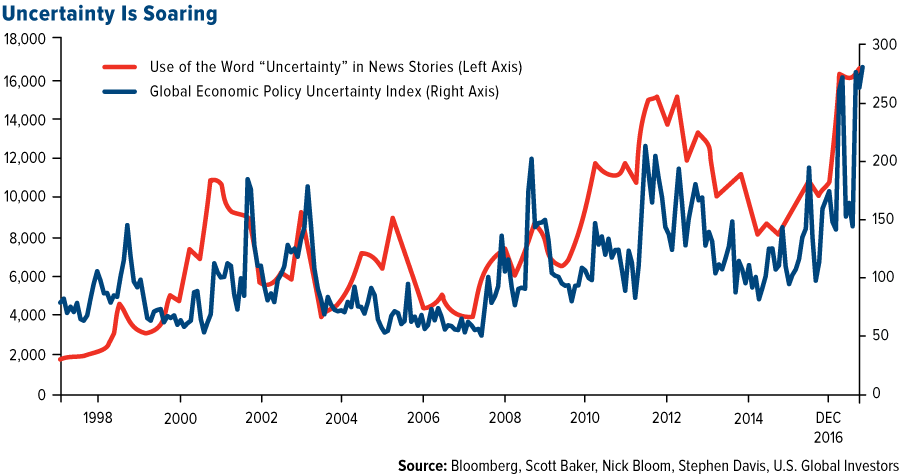
Both measures usually confirm each other, which adds to their credibility (note: there’s an error on the chart that doesn’t change anything regarding the implications: the final date marked on the horizontal axis should simply be 2016, not DEC 2016 – the entire dataset ends at DEC 2016). Let’s compare the above with the long-term gold chart (courtesy of http://stockcharts.com).
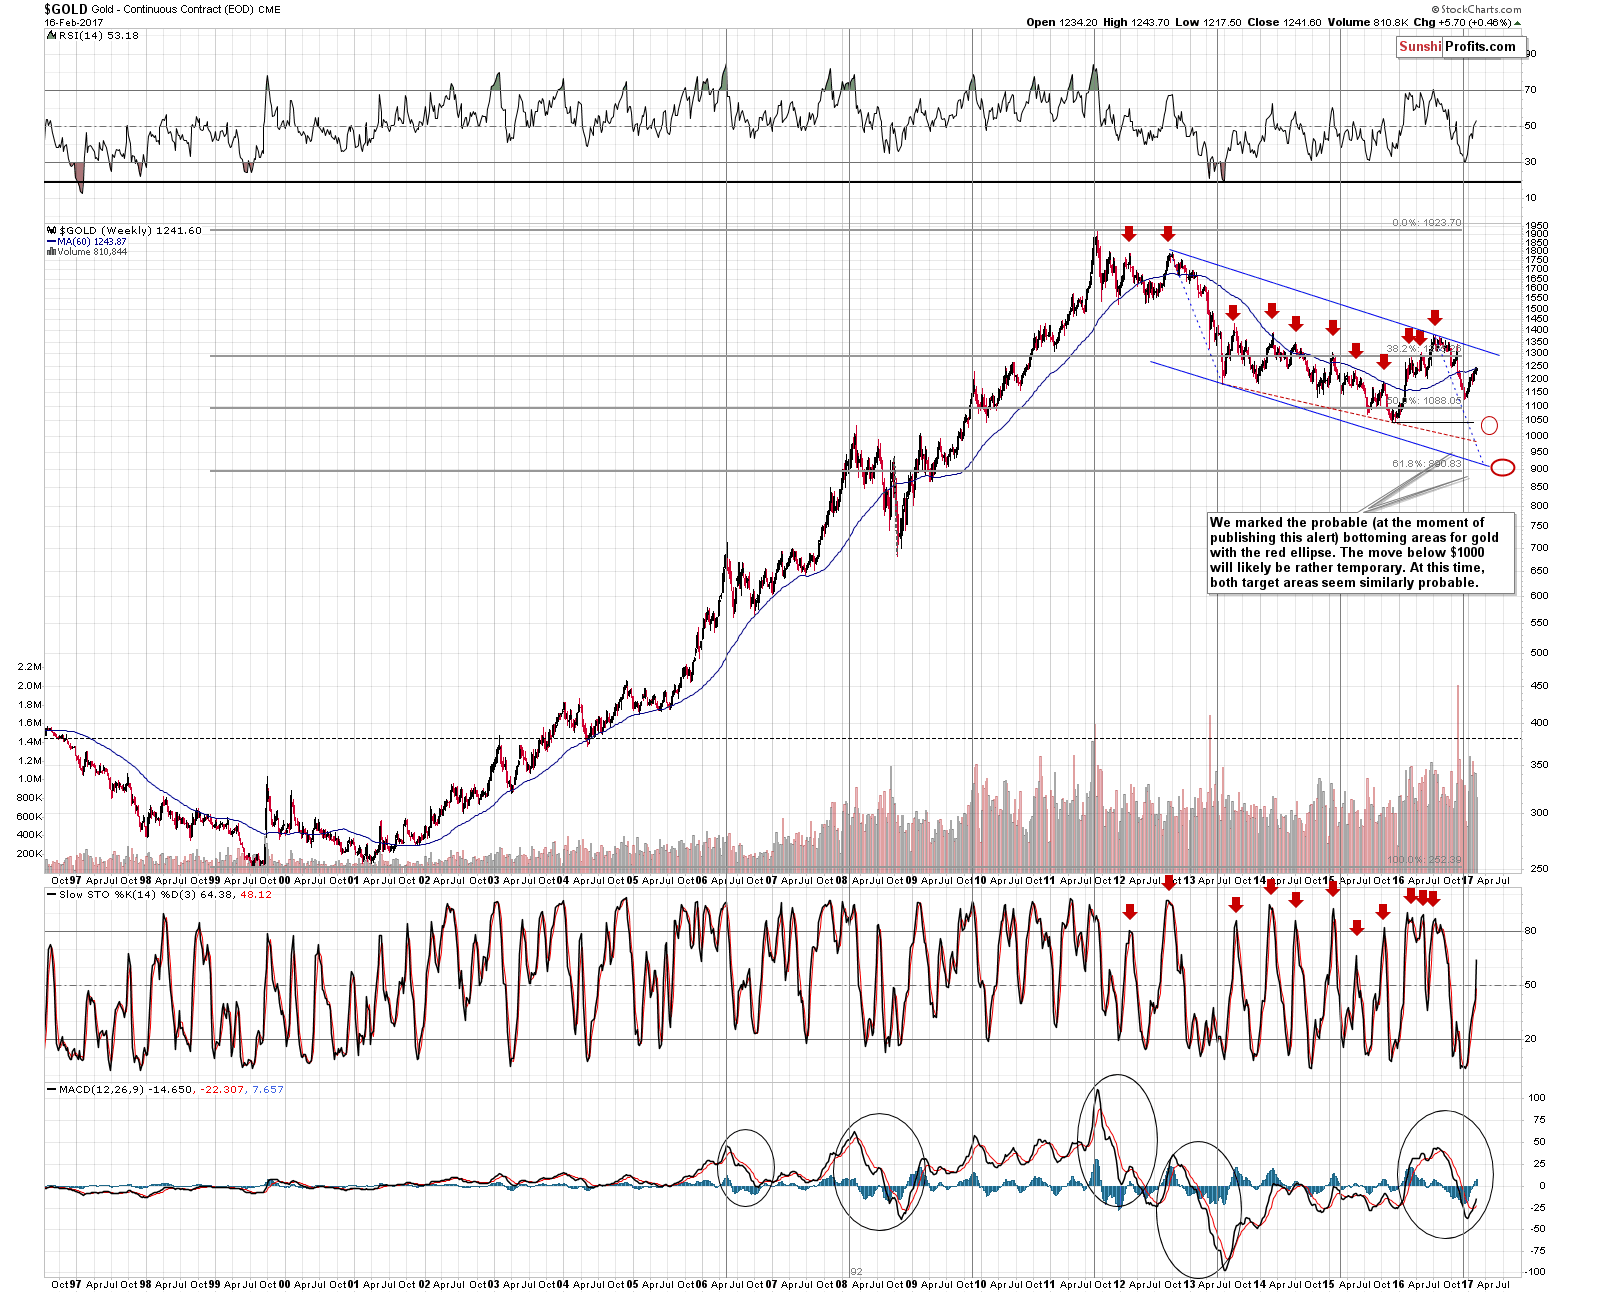
Let’s see what happened with gold when uncertainty soared:
- Mid-1998: gold declined in the following weeks, and the key top was formed along with the red line (use of the word “uncertainty”).
- Final quarter of 2000: gold declined and formed the final bottom in the following quarter.
- Beginning of 2003: gold topped in a profound way.
- Early 2005 (weak signal as it was not confirmed by both tools): gold started a several-month-long consolidation.
- Early 2008: gold topped in a profound way.
- Second half of 2008: gold once again topped in a profound way.
- Mid-2010: local top.
- Mid-2011 (very strong signal – confirmed by high readings from both tools): THE top in gold.
- Mid-2012 and second half of 2012 (high readings with 2 local tops): the final top in gold before the huge 2013 plunge.
- Second half of 2013: first post-plunge top.
- Mid-2016: yearly high.
- Now: ???
As you can see above, the efficiency of the spikes in the uncertainty indicators as sell signals for gold is extraordinary (they worked practically in almost all cases even though gold was in a long-term uptrend for most of the time).
The best time to buy gold is when hope, not fear or uncertainty, dominates the market (if one examined the starting dates of gold’s biggest medium-term rallies, they would see that it was accompanied by low uncertainty readings).
The current (it’s about 1.5 month old, but very likely up-to-date given gold’s move higher this year) extremely high reading of both “uncertainty indicators” very strongly suggests that gold is about to decline and that the decline will not be small or average. The only comparable levels of uncertainty were seen when gold topped in 2011. What’s particularly interesting is after both tools spiked, gold still managed to move higher for a few weeks and then topped. We are missing a few weeks of data (this year) and gold rallied in the meantime. If the history repeats itself, we can expect the major top to form any day now – or it could be the case that it’s already behind us.
Consequently, there is yet another major long-term signal besides the long-term picture for the USD Index and the investors’ sentiment at the 2015 bottom to think that another huge downswing in gold is just around the corner.
As far as the short-term charts and developments are concerned, gold, silver and miners moved higher yesterday and the volume that accompanied the (relatively small) upswing was also relatively small. Consequently, it doesn’t seem that yesterday’s session changed much, if anything. Today’s (weekly) closing prices along with weekly volume levels should provide more details – we’ll discuss them our next alert.
Summing up, the current sentiment readings regarding uncertainty are saying that the price of gold is already at very high levels and as uncertainty subsides, gold should decline. Since the uncertainty levels that were reached exceeded those that accompanied the 2011 top, it seems that the upcoming decline in the precious metals will not be small or even average.
As always, we will keep you – our subscribers – informed.
To summarize:
Trading capital (supplementary part of the portfolio; our opinion): Short positions (150% of the full position) in gold, silver and mining stocks are justified from the risk/reward perspective with the following stop-loss orders and initial target price levels / profit-take orders:
- Gold: exit-profit-take level: $1,063; stop-loss: $1,263; initial target price for the DGLD ETN: $81.88; stop-loss for the DGLD ETN $48.47
- Silver: initial target price: $13.12; stop-loss: $18.67; initial target price for the DSLV ETN: $46.18; stop-loss for the DSLV ETN $19.87
- Mining stocks (price levels for the GDX ETF): initial target price: $9.34; stop-loss: $26.34; initial target price for the DUST ETF: $143.56; stop-loss for the DUST ETF $21.37
In case one wants to bet on junior mining stocks' prices (we do not suggest doing so – we think senior mining stocks are more predictable in the case of short-term trades – if one wants to do it anyway, we provide the details), here are the stop-loss details and initial target prices:
- GDXJ ETF: initial target price: $14.13; stop-loss: $45.31
- JDST ETF: initial target price: $104.26; stop-loss: $10.78
Long-term capital (core part of the portfolio; our opinion): No positions (in other words: cash)
Insurance capital (core part of the portfolio; our opinion): Full position
Please note that the in the trading section we describe the situation for the day that the alert is posted. In other words, it we are writing about a speculative position, it means that it is up-to-date on the day it was posted. We are also featuring the initial target prices, so that you can decide whether keeping a position on a given day is something that is in tune with your approach (some moves are too small for medium-term traders and some might appear too big for day-traders).
Plus, you might want to read why our stop-loss orders are usually relatively far from the current price.
Please note that a full position doesn’t mean using all of the capital for a given trade. You will find details on our thoughts on gold portfolio structuring in the Key Insights section on our website.
As a reminder – “initial target price” means exactly that – an “initial” one, it’s not a price level at which we suggest closing positions. If this becomes the case (like it did in the previous trade) we will refer to these levels as levels of exit orders (exactly as we’ve done previously). Stop-loss levels, however, are naturally not “initial”, but something that, in our opinion, might be entered as an order.
Since it is impossible to synchronize target prices and stop-loss levels for all the ETFs and ETNs with the main markets that we provide these levels for (gold, silver and mining stocks – the GDX ETF), the stop-loss levels and target prices for other ETNs and ETF (among other: UGLD, DGLD, USLV, DSLV, NUGT, DUST, JNUG, JDST) are provided as supplementary, and not as “final”. This means that if a stop-loss or a target level is reached for any of the “additional instruments” (DGLD for instance), but not for the “main instrument” (gold in this case), we will view positions in both gold and DGLD as still open and the stop-loss for DGLD would have to be moved lower. On the other hand, if gold moves to a stop-loss level but DGLD doesn’t, then we will view both positions (in gold and DGLD) as closed. In other words, since it’s not possible to be 100% certain that each related instrument moves to a given level when the underlying instrument does, we can’t provide levels that would be binding. The levels that we do provide are our best estimate of the levels that will correspond to the levels in the underlying assets, but it will be the underlying assets that one will need to focus on regarding the signs pointing to closing a given position or keeping it open. We might adjust the levels in the “additional instruments” without adjusting the levels in the “main instruments”, which will simply mean that we have improved our estimation of these levels, not that we changed our outlook on the markets. We are already working on a tool that would update these levels on a daily basis for the most popular ETFs, ETNs and individual mining stocks.
Our preferred ways to invest in and to trade gold along with the reasoning can be found in the how to buy gold section. Additionally, our preferred ETFs and ETNs can be found in our Gold & Silver ETF Ranking.
As always, we'll keep you - our subscribers - updated should our views on the market change. We will continue to send out Gold & Silver Trading Alerts on each trading day and we will send additional Alerts whenever appropriate.
The trading position presented above is the netted version of positions based on subjective signals (opinion) from your Editor, and the Tools and Indicators.
As a reminder, Gold & Silver Trading Alerts are posted before or on each trading day (we usually post them before the opening bell, but we don't promise doing that each day). If there's anything urgent, we will send you an additional small alert before posting the main one.
=====
Latest Free Trading Alerts:
Some of Trump’s advisers seem to be supporters of the gold standard. What does it mean for the global monetary system and the precious metals market?
Will Trump Return to the Gold Standard?
Reflation is coming. We invite you to read our today’s article about the nature of the current inflationary trends and find out how gold is likely to perform in the reflationary scenario.
On Thursday, crude oil moved higher on news that OPEC could extend its output-cut deal to non-members after concerns over a surge in U.S. crude and shale production increased. Thanks to these circumstances, light crude climbed to $54 and re-tested the key resistance zone. Will we see another reversal and declines in the coming days?
Oil Trading Alert: Crude Oil from Non-USD Perspective
=====
Hand-picked precious-metals-related links:
Zinc, lead rally bad news for silver price
World's largest gold project bulked up again
=====
In other news:
World stocks lose momentum after record-breaking week
Candidate Trump Tries to Salvage an Embattled President Trump
Greece says 'not a euro more' in cuts as EU officials call for speedy deal
How do you say deja vu in Greek?
Norway Central Bank Chief Warns of ‘Sharp’ Drop in Wealth Fund
Oil prices slip as high stocks overshadow OPEC cuts
French Bonds Drop on Potential Left-Wing Candidacy Merger
=====
Thank you.
Sincerely,
Przemyslaw Radomski, CFA
Founder, Editor-in-chief, Gold & Silver Fund Manager
Gold & Silver Trading Alerts
Forex Trading Alerts
Oil Investment Updates
Oil Trading Alerts

