

Briefly: In our opinion, full (150% of the regular full position) speculative short positions in gold, silver and mining stocks are justified from the risk/reward perspective. This position was originally featured on Jan. 12, 2017 at 3:49PM.
It’s easy to follow news and the general sentiment, but it’s rarely a profitable strategy. Whatever uncertainty Trump’s statements are causing now and whatever rallies they are causing, these are likely to be reversed as the uncertainty subsides. Gold made the headlines yesterday – the first page of bloomberg.com, and it is usually the case that we see such increases in interest in the yellow metal close to market tops.
The article says that Trump’s policies have brought gold back to life. However, that doesn’t seem to be the case. Let’s not forget what the price of gold was before Trump was elected – it was close to $1,300 and it’s now close to $1,200. With gold $100 lower, does it really seem that Trump’s presidency is bullish for gold? No – the very short-term effect of surprising news can be bullish, but overall, the impact remains negative and the trend remains down (we will discuss the fundamental factors and the trends in greater detail in the upcoming Market Overview report).
The news-based upswing, however, can be useful – we can check how the precious metals market responds. If miners were leading gold higher and silver was lagging, then the implications would be bullish. But that is not the case. Let’s take a look at the charts for details (charts courtesy of http://stockcharts.com).
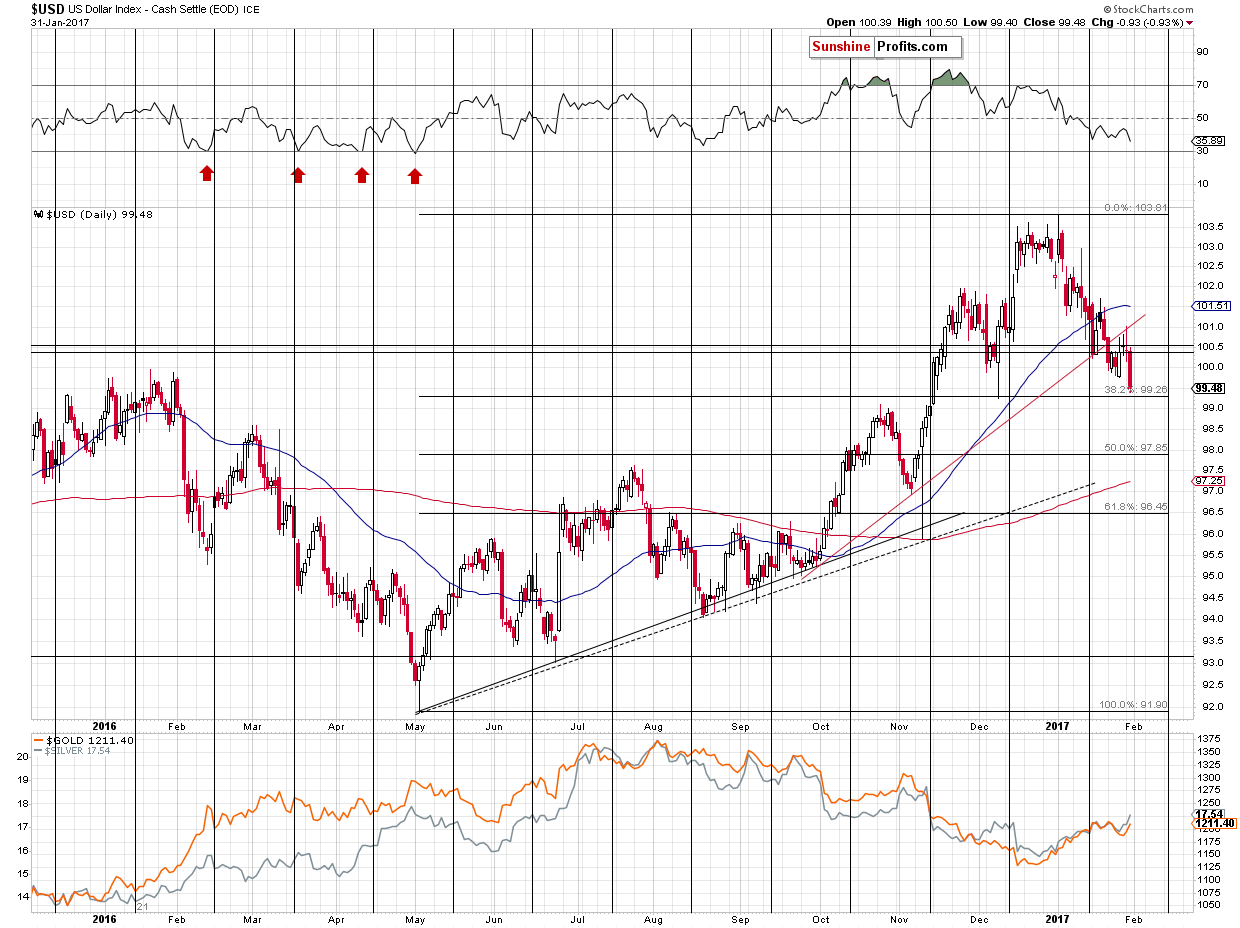
The USD Index moved to and closed at new 2017 lows. Did gold or the HUI Index close at new 2017 highs? No – metals and miners are not fully responding to the USD’s signals, which is a bearish sign. The reaction of the precious metals market to strength in the USD is likely to be significant and it's only a matter of time when the latter is seen. Based on the December intra-day low and the 38.2% Fibonacci retracement level based on the entire 2016 rally, the decline could already be over or extremely close to being over.
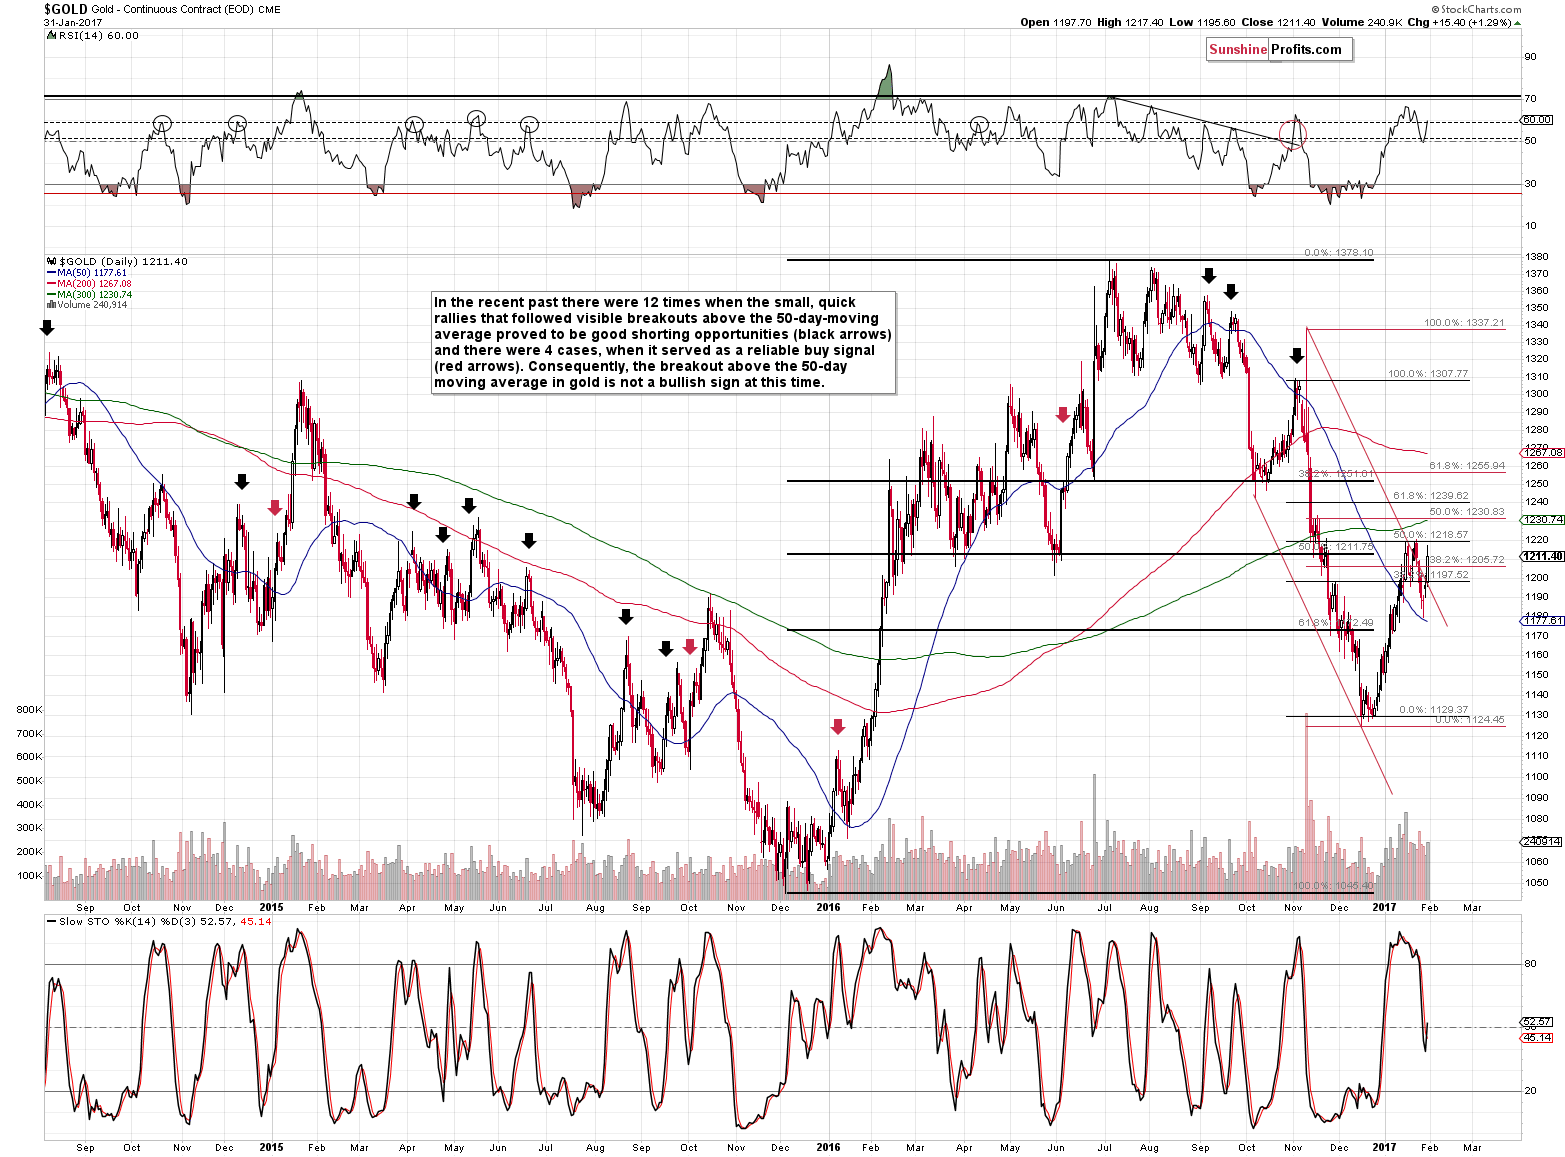
Gold moved higher yesterday without breaking above the previous highs – is this move significant enough to change the outlook? No – that’s quite in tune with the way in which gold topped many times before. The October 2015 top was followed by several intra-day rallies, the November 2016 top was created by a few daily tops and then a one fake breakout. The entire 2016 rally ended with several local tops that were formed throughout the summer. The January 2015 top was followed by back and forth movement for several days before the decline really started, etc. So, should we be concerned by gold’s move back to its previous highs at this time? Not really, especially that the move above the declining red resistance line is not confirmed yet.
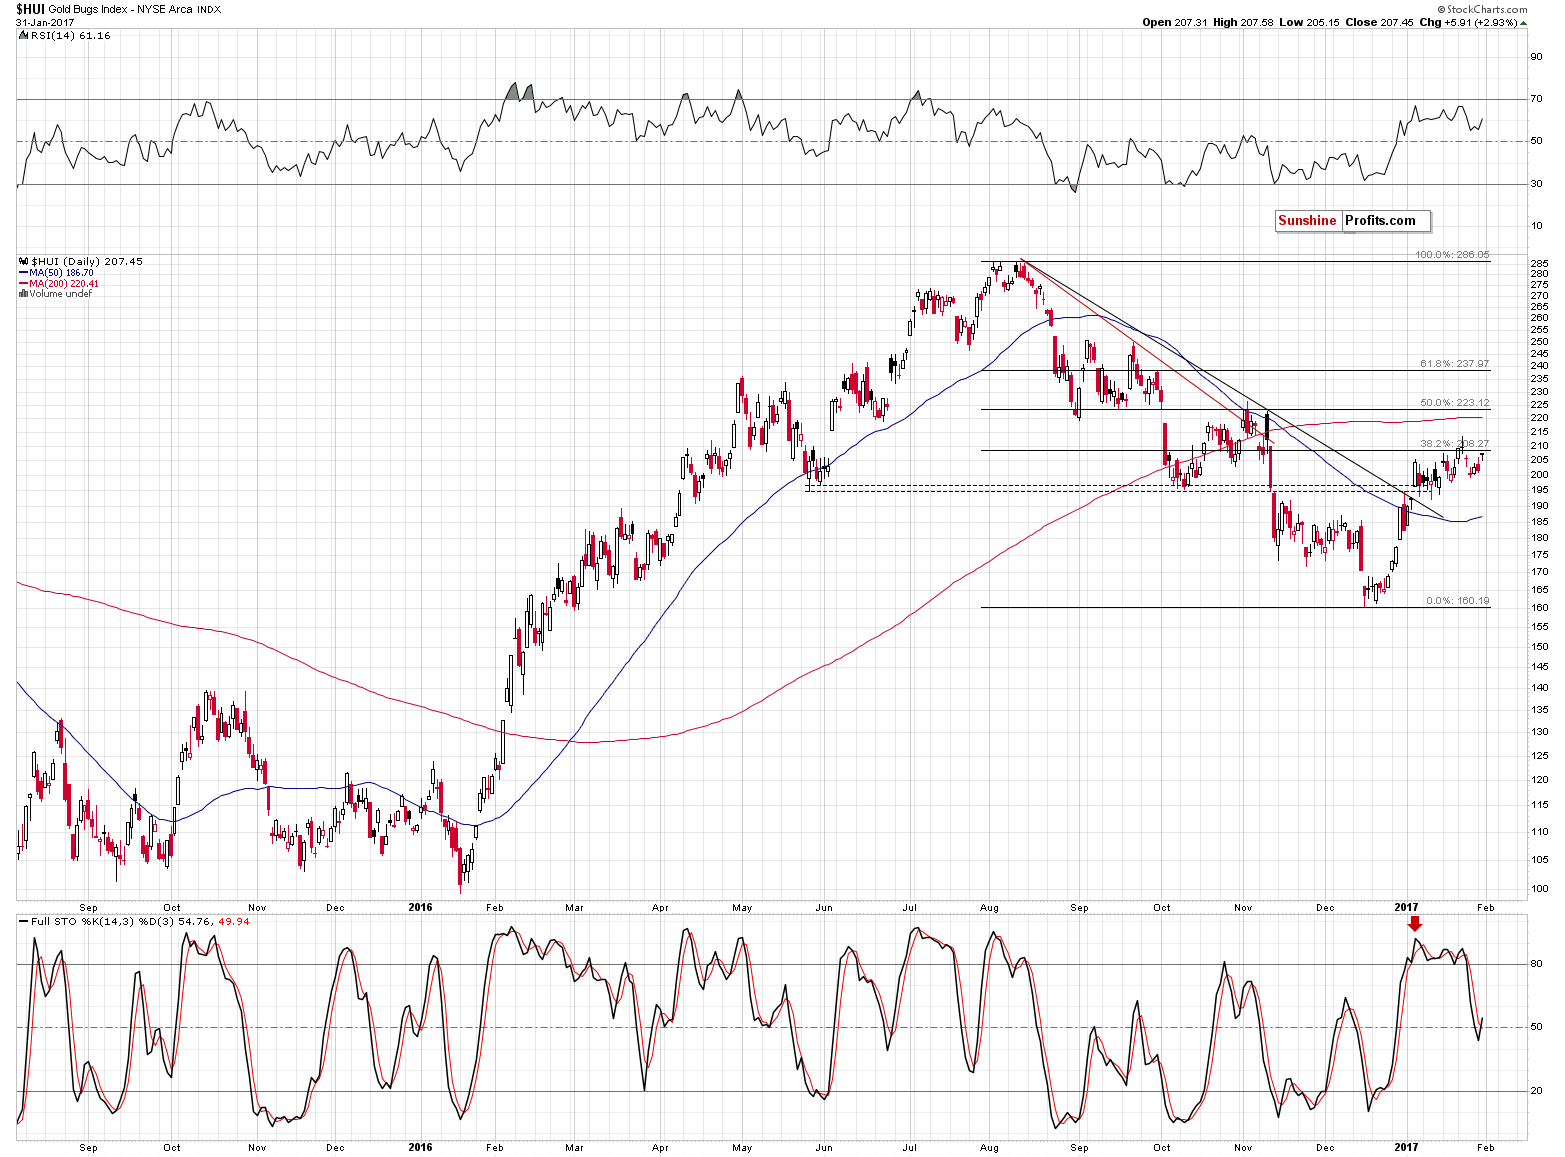
As mentioned earlier, gold stocks didn’t move above their previous highs either. It could be the case that we are seeing a short-term head-and-shoulders pattern here – with yesterday’s session being the right shoulder and the January 17 session being the left shoulder. Naturally, the formation will have bearish implications only after the HUI breaks below 200 (the neck level), but it’s likely that we will see this breakdown rather soon, as the USD Index reverses.
Our yesterday’s comments regarding silver remain up-to-date:
Unlike gold, silver moved a bit above its previous highs (silver is trading at $17.40 at the moment of writing these words), but silver’s breakouts can often be misleading if they are not accompanied by analogous signals from the rest of the precious metals sector – and this is the case right now. Gold is well below its previous highs and miners haven’t started the session yet.
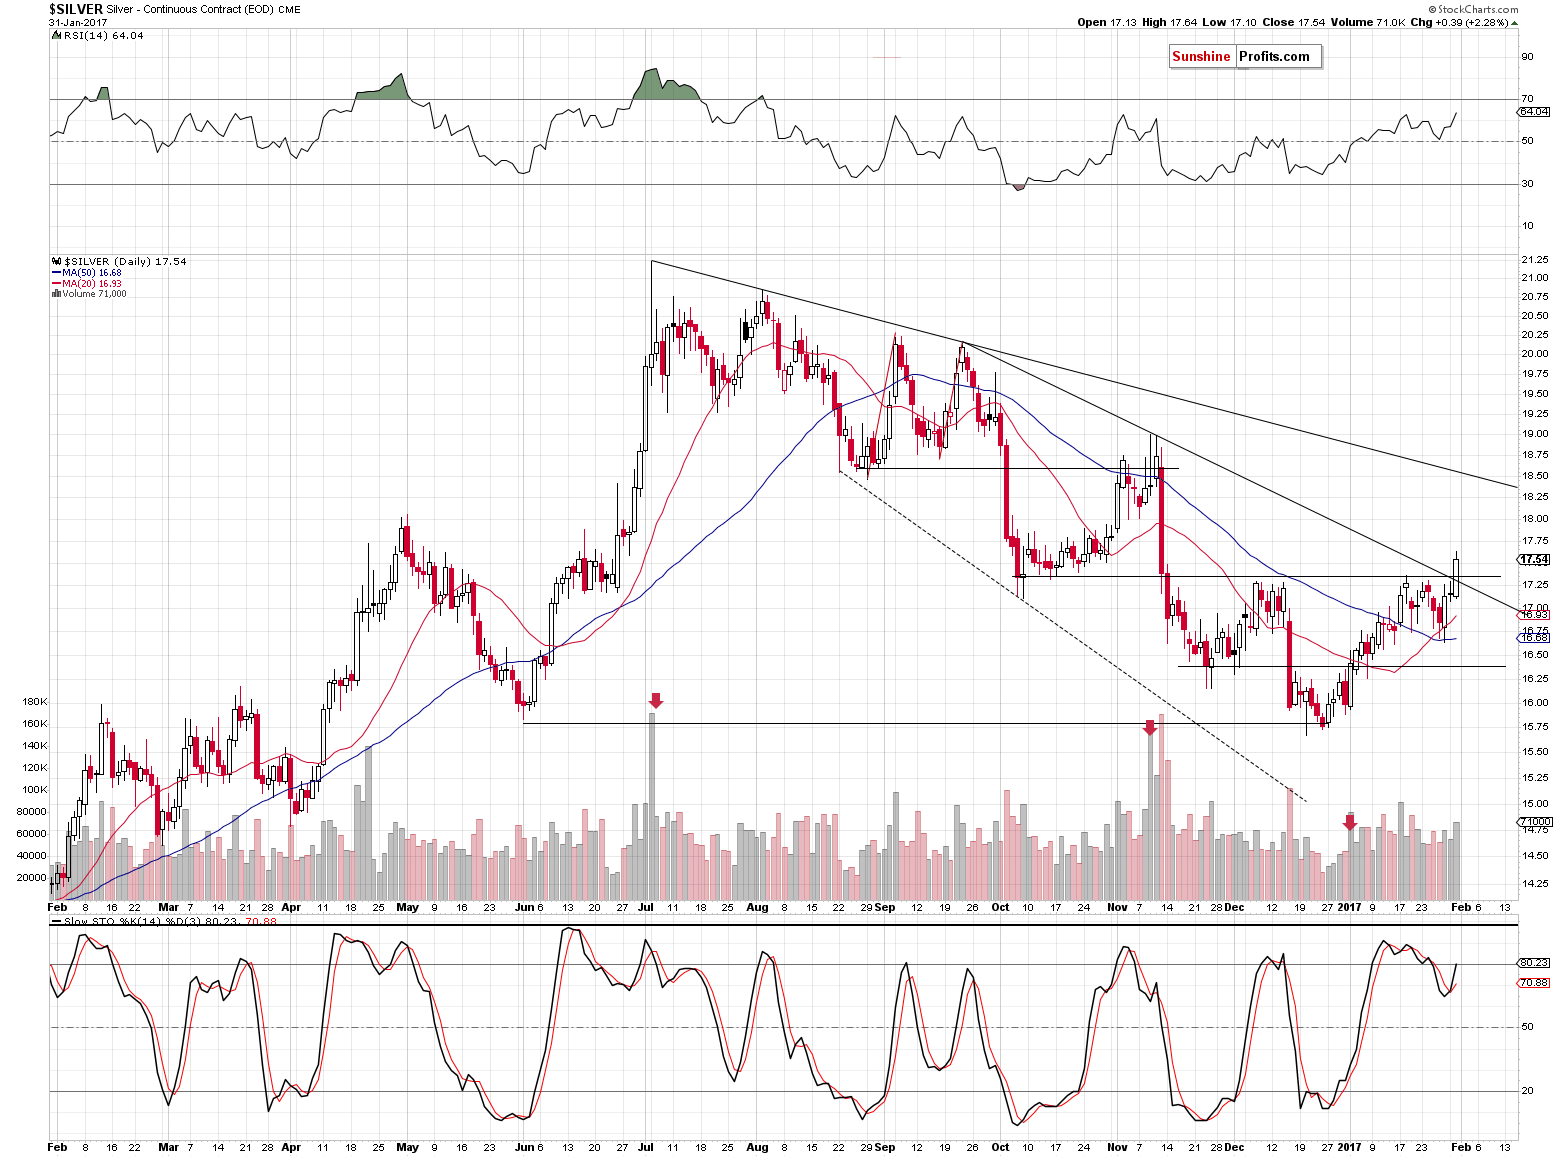
Silver closed at $17.54, but still, the breakout was not accompanied by analogous action in gold and mining stocks, so it should not be trusted.
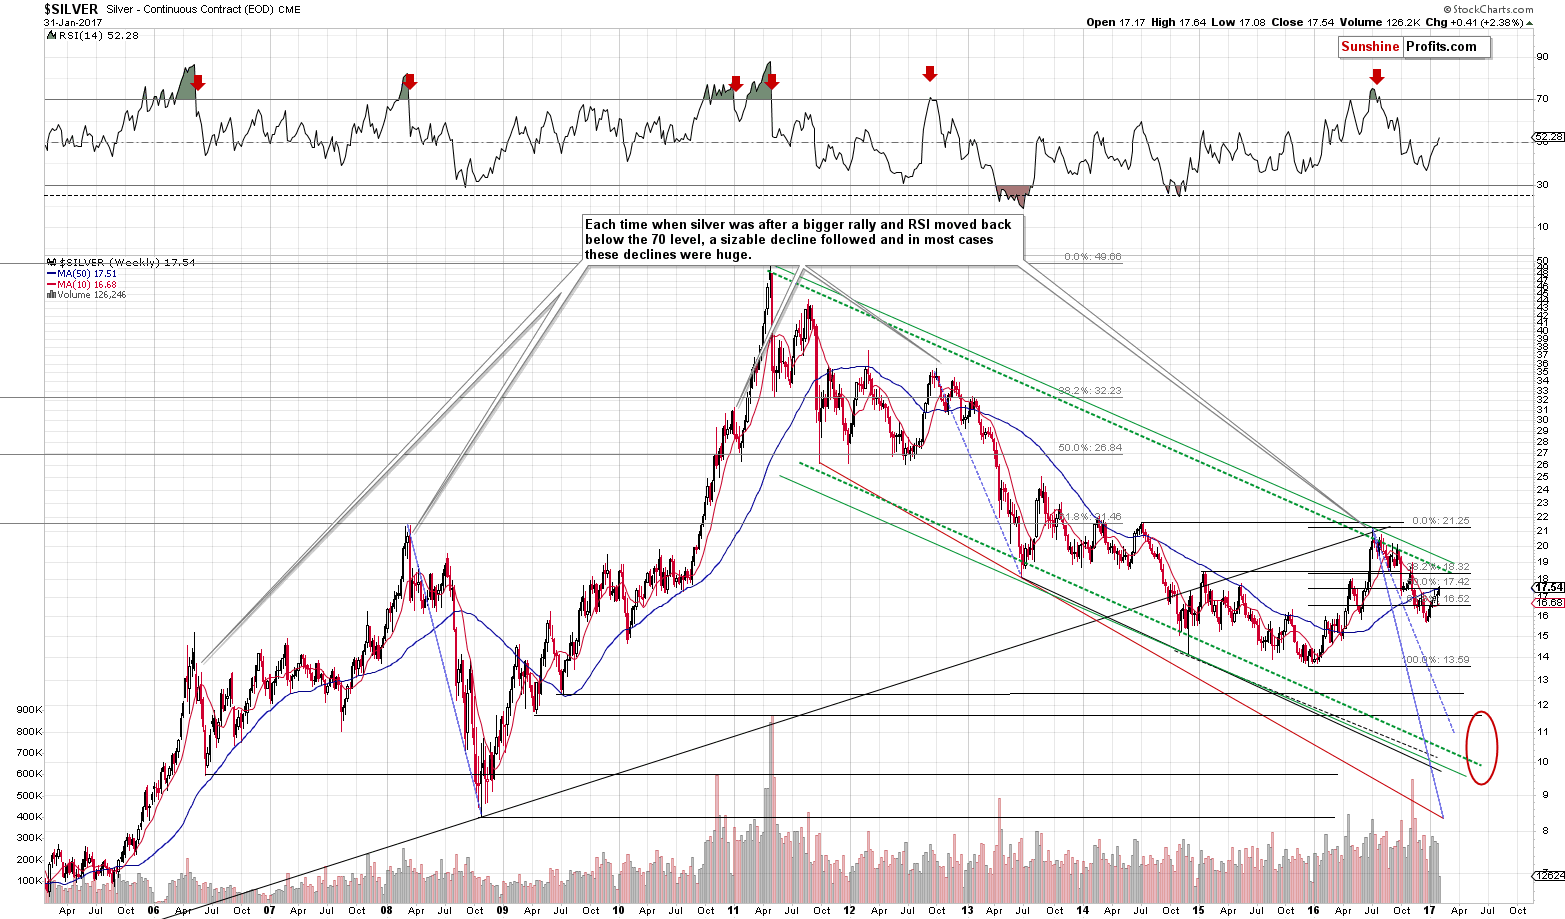
On silver’s long-term chart we see that the white metal’s price is very close to the 50% Fibonacci retracement based on the 2016 rally and the 50-week moving average. The latter served as resistance and support multiple times in the past years, so together they create a quite strong resistance. The resistance created by the declining green resistance lines is even stronger, but it doesn’t seem likely that silver would go that far before turning south.
Summing up, the short-term outlook and medium-term outlook remain bearish as not much happened besides silver’s breakout and a breakout in silver is not really a bullish sign unless it’s accompanied by analogous breakouts (in this case: above the previous highs) in gold and miners. Gold and mining stocks didn’t move to new highs, even though the USD Index declined to new lows, which serves as a bearish confirmation for the former.
As always, we will keep you – our subscribers – informed.
To summarize:
Trading capital (supplementary part of the portfolio; our opinion): Short positions (150% of the full position) in gold, silver and mining stocks are justified from the risk/reward perspective with the following stop-loss orders and initial target price levels / profit-take orders:
- Gold: exit-profit-take level: $1,063; stop-loss: $1,243; initial target price for the DGLD ETN: $81.88; stop-loss for the DGLD ETN $48.78
- Silver: initial target price: $13.12; stop-loss: $18.07; initial target price for the DSLV ETN: $46.18; stop-loss for the DSLV ETN $22.24
- Mining stocks (price levels for the GDX ETF): initial target price: $9.34; stop-loss: $24.63; initial target price for the DUST ETF: $143.56; stop-loss for the DUST ETF $27.97
In case one wants to bet on junior mining stocks' prices (we do not suggest doing so – we think senior mining stocks are more predictable in the case of short-term trades – if one wants to do it anyway, we provide the details), here are the stop-loss details and initial target prices:
- GDXJ ETF: initial target price: $14.13; stop-loss: $40.12
- JDST ETF: initial target price: $104.26; stop-loss: $17.28
Long-term capital (core part of the portfolio; our opinion): No positions (in other words: cash)
Insurance capital (core part of the portfolio; our opinion): Full position
Please note that the in the trading section we describe the situation for the day that the alert is posted. In other words, it we are writing about a speculative position, it means that it is up-to-date on the day it was posted. We are also featuring the initial target prices, so that you can decide whether keeping a position on a given day is something that is in tune with your approach (some moves are too small for medium-term traders and some might appear too big for day-traders).
Plus, you might want to read why our stop-loss orders are usually relatively far from the current price.
Please note that a full position doesn’t mean using all of the capital for a given trade. You will find details on our thoughts on gold portfolio structuring in the Key Insights section on our website.
As a reminder – “initial target price” means exactly that – an “initial” one, it’s not a price level at which we suggest closing positions. If this becomes the case (like it did in the previous trade) we will refer to these levels as levels of exit orders (exactly as we’ve done previously). Stop-loss levels, however, are naturally not “initial”, but something that, in our opinion, might be entered as an order.
Since it is impossible to synchronize target prices and stop-loss levels for all the ETFs and ETNs with the main markets that we provide these levels for (gold, silver and mining stocks – the GDX ETF), the stop-loss levels and target prices for other ETNs and ETF (among other: UGLD, DGLD, USLV, DSLV, NUGT, DUST, JNUG, JDST) are provided as supplementary, and not as “final”. This means that if a stop-loss or a target level is reached for any of the “additional instruments” (DGLD for instance), but not for the “main instrument” (gold in this case), we will view positions in both gold and DGLD as still open and the stop-loss for DGLD would have to be moved lower. On the other hand, if gold moves to a stop-loss level but DGLD doesn’t, then we will view both positions (in gold and DGLD) as closed. In other words, since it’s not possible to be 100% certain that each related instrument moves to a given level when the underlying instrument does, we can’t provide levels that would be binding. The levels that we do provide are our best estimate of the levels that will correspond to the levels in the underlying assets, but it will be the underlying assets that one will need to focus on regarding the signs pointing to closing a given position or keeping it open. We might adjust the levels in the “additional instruments” without adjusting the levels in the “main instruments”, which will simply mean that we have improved our estimation of these levels, not that we changed our outlook on the markets. We are already working on a tool that would update these levels on a daily basis for the most popular ETFs, ETNs and individual mining stocks.
Our preferred ways to invest in and to trade gold along with the reasoning can be found in the how to buy gold section. Additionally, our preferred ETFs and ETNs can be found in our Gold & Silver ETF Ranking.
As always, we'll keep you - our subscribers - updated should our views on the market change. We will continue to send out Gold & Silver Trading Alerts on each trading day and we will send additional Alerts whenever appropriate.
The trading position presented above is the netted version of positions based on subjective signals (opinion) from your Editor, and the Tools and Indicators.
As a reminder, Gold & Silver Trading Alerts are posted before or on each trading day (we usually post them before the opening bell, but we don't promise doing that each day). If there's anything urgent, we will send you an additional small alert before posting the main one.
=====
Latest Free Trading Alerts:
The Federal Reserve is due to release the statement from their February meeting. What can we expect and how can it affect the gold market?
Will February FOMC Meeting Move Gold?
=====
Hand-picked precious-metals-related links:
January gold imports down nearly 70%
Gold becomes one of investors' favorite safe havens with Trump uncertainty
=====
In other news:
Corporate Outlook Spurs Stocks as Eyes Turn to Fed: Markets Wrap
We’re in Phase III of the Trump Rally
=====
Thank you.
Sincerely,
Przemyslaw Radomski, CFA
Founder, Editor-in-chief, Gold & Silver Fund Manager
Gold & Silver Trading Alerts
Forex Trading Alerts
Oil Investment Updates
Oil Trading Alerts

