

Briefly: In our opinion, full (150% of the regular full position) speculative short positions in gold, silver and mining stocks are justified from the risk/reward perspective. In other words, we are increasing the size of the short position. This position was originally featured on Jan. 12, 2016 at 3:49PM.
In yesterday’s alert, we wrote that the decline in the USD Index was likely a temporary phenomenon based on the investor’s needless overreaction – the USD reversed and more than erased this week’s decline. The metals’ reaction was also in tune with our expectations – they reversed. Was this just a one-day phenomenon or can we expect more declines in the following days?
The latter scenario seems much more probable. We’ve seen gold hit a strong resistance level (a combination of such levels), a support in the USD Index, reversals in the latter and in silver around their turning points, underperformance of mining stocks relative to gold and very short-term outperformance of silver. Additionally, we saw bearish confirmations from a few ratios and gold’s reaction to the USD’s declines was temporarily weakened. All the above happened as precious metals were making headlines and among increased interest in the sector. That’s a very bearish combination – the outlook is more bearish than it was in the past days and thus we are now increasing the size of the speculative short position.
Let’s take a look at the charts (charts courtesy of http://stockcharts.com).
In yesterday’s alert, we wrote the following:
The USD Index moved even lower yesterday, but gold didn’t move higher than it was when we wrote the above (about $1,217). In other words, gold didn’t respond to an additional decline. This suggests that even if the USD Index drops further, gold may not rally or may not rally far. However, if the USD rebounds visibly, gold is likely to be affected negatively to a great extent.
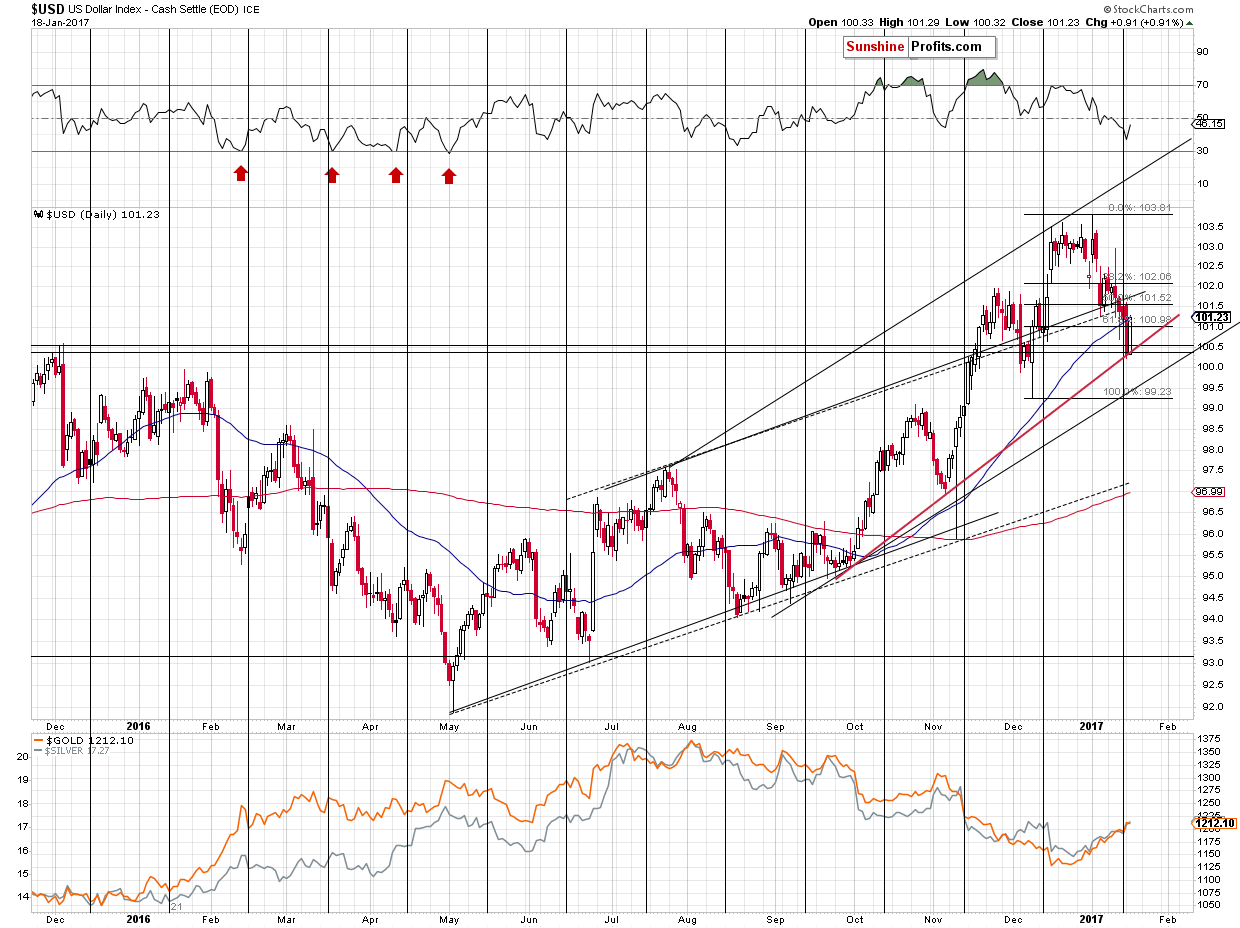
Can the USD Index rally shortly? Naturally – it moved back to the December 2015 high (even a bit below it) and is now back at 100.67 at the moment of writing these words (gold is at $1,212), so it appears that the move above the December 2015 high is verified. Plus, the turning point suggests that a reversal is upon us and the most recent move was definitely down – the implications are bullish.
Why did the USD Index plunge so significantly yesterday? Trump said that the USD was too strong. Did this materially change anything? No – that’s an opinion of an important person, but that doesn’t change the fact that the interest rates in the U.S. are most likely going higher and the rates in the EU and other parts of the world are unlikely to move higher (the opposite appears more likely). Consequently, the USD Index should not be impaired in the coming months and yesterday’s reaction is likely emotional and temporary.
The USD Index erased the entire decline that we saw this week (being up 0.04 this week based on yesterday’s closing price) as it bounced off the rising red support line and – approximately – the December 2015 highs. The breakout above the latter seems to have been verified. The implications are bullish.
Our yesterday’s comments remain up-to-date:
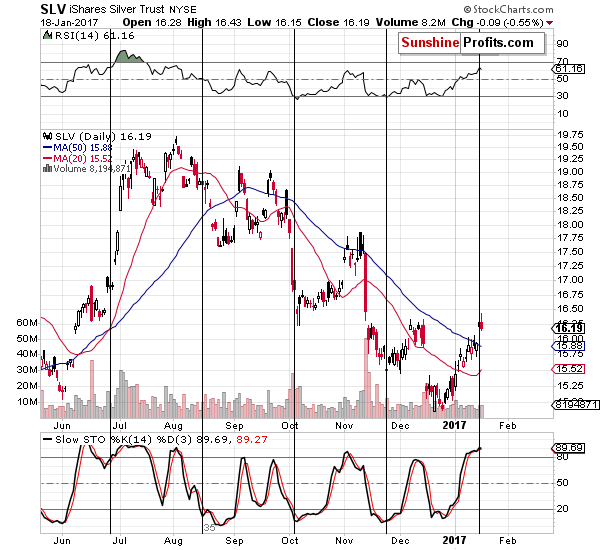
Silver rallied right at its turning point and it outperformed gold on a very short-term basis, which is a very bearish combination. As soon as silver declines a little (and it’s likely to), a sell signal from the Stochastic indicator based on the SLV ETF will also emerge, further confirming the bearish case. It appears that we are on the verge of another significant decline in the white metal.
Silver outperformed once again by moving to new intra-day highs before turning south – gold didn’t move above Tuesday’s highs. Since the above is very often seen at local tops and right before big declines, it should not be ignored, especially that we just saw a repeat of the signal, which made it even more prominent.
In the case of gold, we wrote the following yesterday:
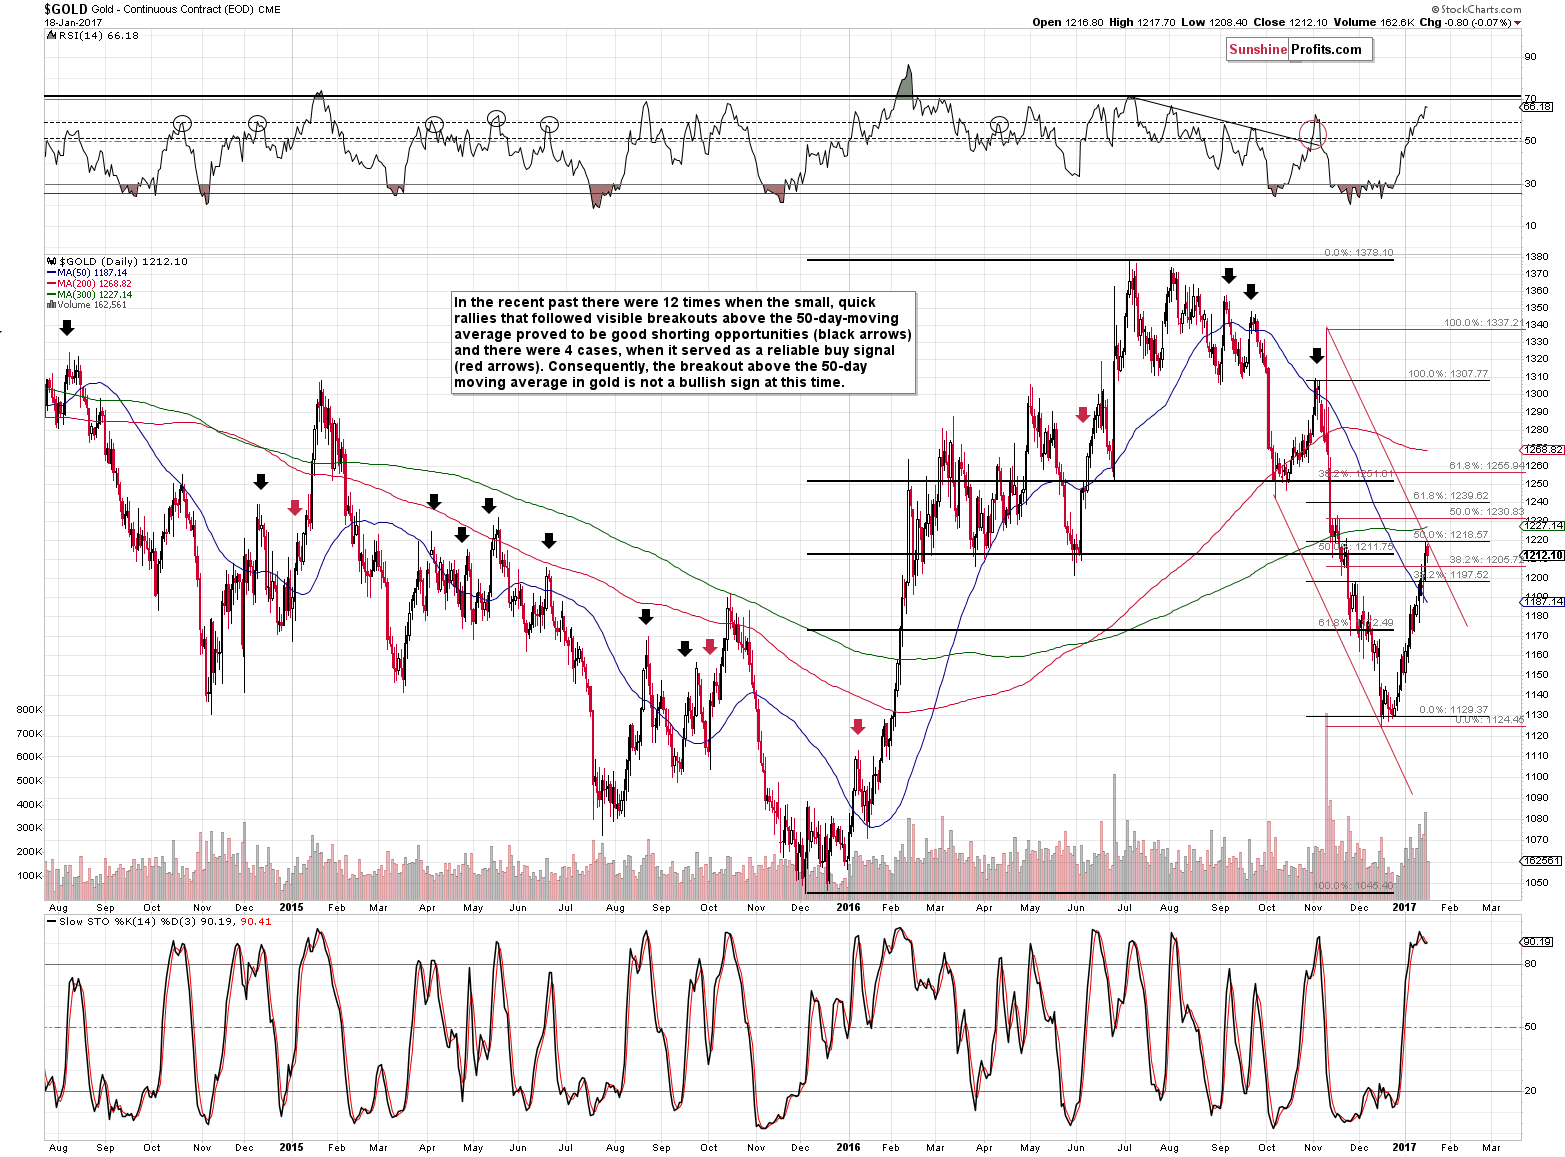
Gold moved to $1,219 today, so the 50% Fibonacci retracement was reached and that was almost the case with the declining red resistance line. In light of the turning points and support being reached in the USD Index, it seems likely that today’s session is the final reversal (or extremely close to it) – perhaps today’s session or the following one will be just like the session after the U.S. Presidential elections – with gold sliding quickly right after the uncertainty had peaked.
Gold didn’t slide as much as previously, but still, it stopped the rally after moving to the 50% Fibonacci retracement and the declining resistance line. Gold also closed below the March / May 2016 lows in terms of daily closing prices. Without a breakout, the move higher is likely just a verification of the breakdown.
The above remains up-to-date. Gold closed the day at $1,204 (even though the Stockcharts.com’s data seems to suggest otherwise) so we saw a quite profound daily reversal and a close back below the 38.2% Fibonacci retracement (based on daily closing prices). The implications are bearish.
Before moving to mining stocks, we would like to discuss the issue of the 50-day moving average and gold’s recent breakout above it. It has been described as something that is likely to make gold’s rally sustainable, or at least make it bigger than it currently is.
The above chart includes black arrows and red arrows. All arrows mark situations in which gold broke visibly (we didn’t count temporary moves a little above / below it that appeared accidental) above the 50-day moving average. Black arrows represent situations in which the breakout was followed by a very short-term rally (usually very similar to the one that we saw this month) that turned out to be excellent shorting opportunities. The red arrows represent situations in which the small post-breakout rallies were followed by much bigger rallies (and thus the breakout was indeed a bullish signal). Out of 16 cases that we can see above, there were 12 cases that were shorting opportunities and 4 cases that were buying opportunities.
The question is: should one trust the bullish analogies that had a 25% (4 out of 16) efficiency or the bearish analogies that had a 75% (12 out of 16) efficiency? We think the latter is much more justified, but at the same time we would like to stress that it is not a major reason due to which we think that precious metals are heading lower – it’s a supplementary reason that is only moderately useful. Why? Because in the most recent past the efficiency of the bearish signals would be 3 out of 5, which is close to 50% - so it doesn’t seem to be a particularly reliable factor. Still, if we had to pick if its more bullish or bearish, we would go with the latter interpretation.
As far as mining stocks are concerned, we previously wrote the following:
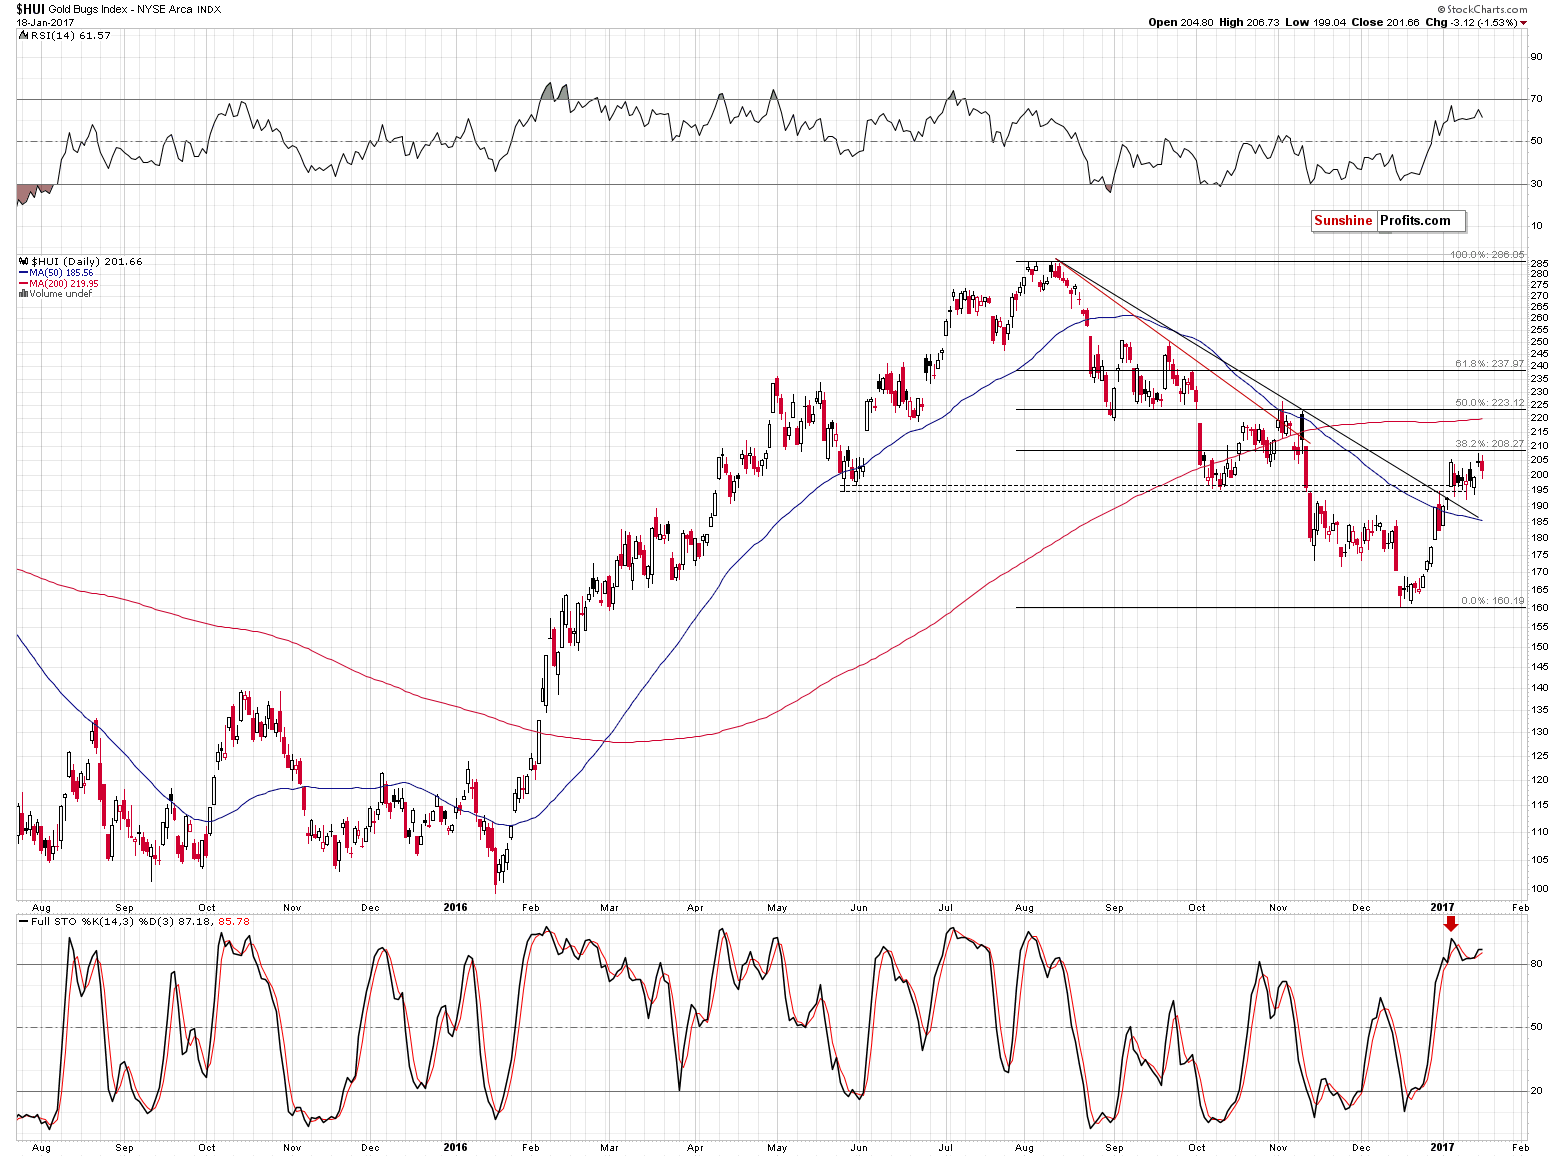
Since gold moved higher, gold miners are also likely to move a little higher, but the 38.2% Fibonacci retracement will likely keep the rally in check. Miners have been underperforming gold for several days (bearish implications) and the implications are bearish.
(…) gold miners moved very close to the 38.2% Fibonacci retracement, but there was no move back above it – the rally that we saw recently appears to be nothing more than a correction after a big decline.
Gold stocks haven’t plunged violently yet, but they did close back below the January 5 high even though gold didn’t. Overall, the miners’ underperformance continues and it has bearish implications for the precious metals sector.
Summing up, the bearish medium-term outlook remains in place and based on silver’s short-term outperformance, reversals in it and in the USD Index along with other factors, it appears that the short-term outlook has deteriorated once again. Consequently, it seems that increasing the size of the speculative short position is now justified from the risk to reward point of view.
As always, we will keep you – our subscribers – informed.
To summarize:
Trading capital (supplementary part of the portfolio; our opinion): Short positions (150% of the full position) in gold, silver and mining stocks are justified from the risk/reward perspective with the following stop-loss orders and initial target price levels / profit-take orders:
- Gold: exit-profit-take level: $1,063; stop-loss: $1,243; initial target price for the DGLD ETN: $81.88; stop-loss for the DGLD ETN $48.78
- Silver: initial target price: $13.12; stop-loss: $17.53; initial target price for the DSLV ETN: $46.18; stop-loss for the DSLV ETN $24.86
- Mining stocks (price levels for the GDX ETF): initial target price: $9.34; stop-loss: $24.63; initial target price for the DUST ETF: $143.56; stop-loss for the DUST ETF $27.97
In case one wants to bet on junior mining stocks' prices (we do not suggest doing so – we think senior mining stocks are more predictable in the case of short-term trades – if one wants to do it anyway, we provide the details), here are the stop-loss details and initial target prices:
- GDXJ ETF: initial target price: $14.13; stop-loss: $40.12
- JDST ETF: initial target price: $104.26; stop-loss: $17.28
Long-term capital (core part of the portfolio; our opinion): No positions (in other words: cash)
Insurance capital (core part of the portfolio; our opinion): Full position
Please note that the in the trading section we describe the situation for the day that the alert is posted. In other words, it we are writing about a speculative position, it means that it is up-to-date on the day it was posted. We are also featuring the initial target prices, so that you can decide whether keeping a position on a given day is something that is in tune with your approach (some moves are too small for medium-term traders and some might appear too big for day-traders).
Plus, you might want to read why our stop-loss orders are usually relatively far from the current price.
Please note that a full position doesn’t mean using all of the capital for a given trade. You will find details on our thoughts on gold portfolio structuring in the Key Insights section on our website.
As a reminder – “initial target price” means exactly that – an “initial” one, it’s not a price level at which we suggest closing positions. If this becomes the case (like it did in the previous trade) we will refer to these levels as levels of exit orders (exactly as we’ve done previously). Stop-loss levels, however, are naturally not “initial”, but something that, in our opinion, might be entered as an order.
Since it is impossible to synchronize target prices and stop-loss levels for all the ETFs and ETNs with the main markets that we provide these levels for (gold, silver and mining stocks – the GDX ETF), the stop-loss levels and target prices for other ETNs and ETF (among other: UGLD, DGLD, USLV, DSLV, NUGT, DUST, JNUG, JDST) are provided as supplementary, and not as “final”. This means that if a stop-loss or a target level is reached for any of the “additional instruments” (DGLD for instance), but not for the “main instrument” (gold in this case), we will view positions in both gold and DGLD as still open and the stop-loss for DGLD would have to be moved lower. On the other hand, if gold moves to a stop-loss level but DGLD doesn’t, then we will view both positions (in gold and DGLD) as closed. In other words, since it’s not possible to be 100% certain that each related instrument moves to a given level when the underlying instrument does, we can’t provide levels that would be binding. The levels that we do provide are our best estimate of the levels that will correspond to the levels in the underlying assets, but it will be the underlying assets that one will need to focus on regarding the signs pointing to closing a given position or keeping it open. We might adjust the levels in the “additional instruments” without adjusting the levels in the “main instruments”, which will simply mean that we have improved our estimation of these levels, not that we changed our outlook on the markets. We are already working on a tool that would update these levels on a daily basis for the most popular ETFs, ETNs and individual mining stocks.
Our preferred ways to invest in and to trade gold along with the reasoning can be found in the how to buy gold section. Additionally, our preferred ETFs and ETNs can be found in our Gold & Silver ETF Ranking.
As always, we'll keep you - our subscribers - updated should our views on the market change. We will continue to send out Gold & Silver Trading Alerts on each trading day and we will send additional Alerts whenever appropriate.
The trading position presented above is the netted version of positions based on subjective signals (opinion) from your Editor, and the Tools and Indicators.
As a reminder, Gold & Silver Trading Alerts are posted before or on each trading day (we usually post them before the opening bell, but we don't promise doing that each day). If there's anything urgent, we will send you an additional small alert before posting the main one.
=====
Latest Free Trading Alerts:
The Consumer Price Index rose 0.3 percent in December. What does it mean for the Fed’s policy and the gold market?
Soaring Consumer Prices and Gold
S&P 500 index gained 0.2% on Wednesday, as it retraced its Tuesday's move down. Is this a topping pattern before downward correction or just consolidation before another leg up within long-term uptrend? Is holding short position still justified?
Stock Trading Alert: Stocks Trade Along Record Highs - Topping Pattern Or Just Consolidation?
=====
Hand-picked precious-metals-related links:
PRECIOUS-Gold under pressure as Fed's Yellen backs gradual rate hikes
=====
In other news:
Q&A-Trump's policy plans and dollar hopes a paradox: ex-IMF adviser
European Stocks Edge Lower Ahead of ECB's Draghi Comments, Trump Inauguration
Bond Guru Who Called Last Bear Market 40 Years Ago Says Go Long
Investors Latch Onto Reflation Trade as Bonds Fall: Markets Wrap
=====
Thank you.
Sincerely,
Przemyslaw Radomski, CFA
Founder, Editor-in-chief, Gold & Silver Fund Manager
Gold & Silver Trading Alerts
Forex Trading Alerts
Oil Investment Updates
Oil Trading Alerts

