

Briefly: In our opinion, full (100% of the regular full position) speculative short positions in gold, silver and mining stocks are justified from the risk/reward perspective. This position was originally featured on Jan. 12, 2017 at 3:49PM.
Rallies are generally viewed as bullish developments, but not always. Does “generally” mean “mostly” in the case of the most recent moves in metals and currencies? One of the exceptions is when a rally takes place right at or very close to a turning point. Will the proximity of the latter negatively affect the precious metals market?
In short, that’s quite likely. Let’s take a look at the charts (charts courtesy of http://stockcharts.com).
In yesterday’s alert, we wrote the following:
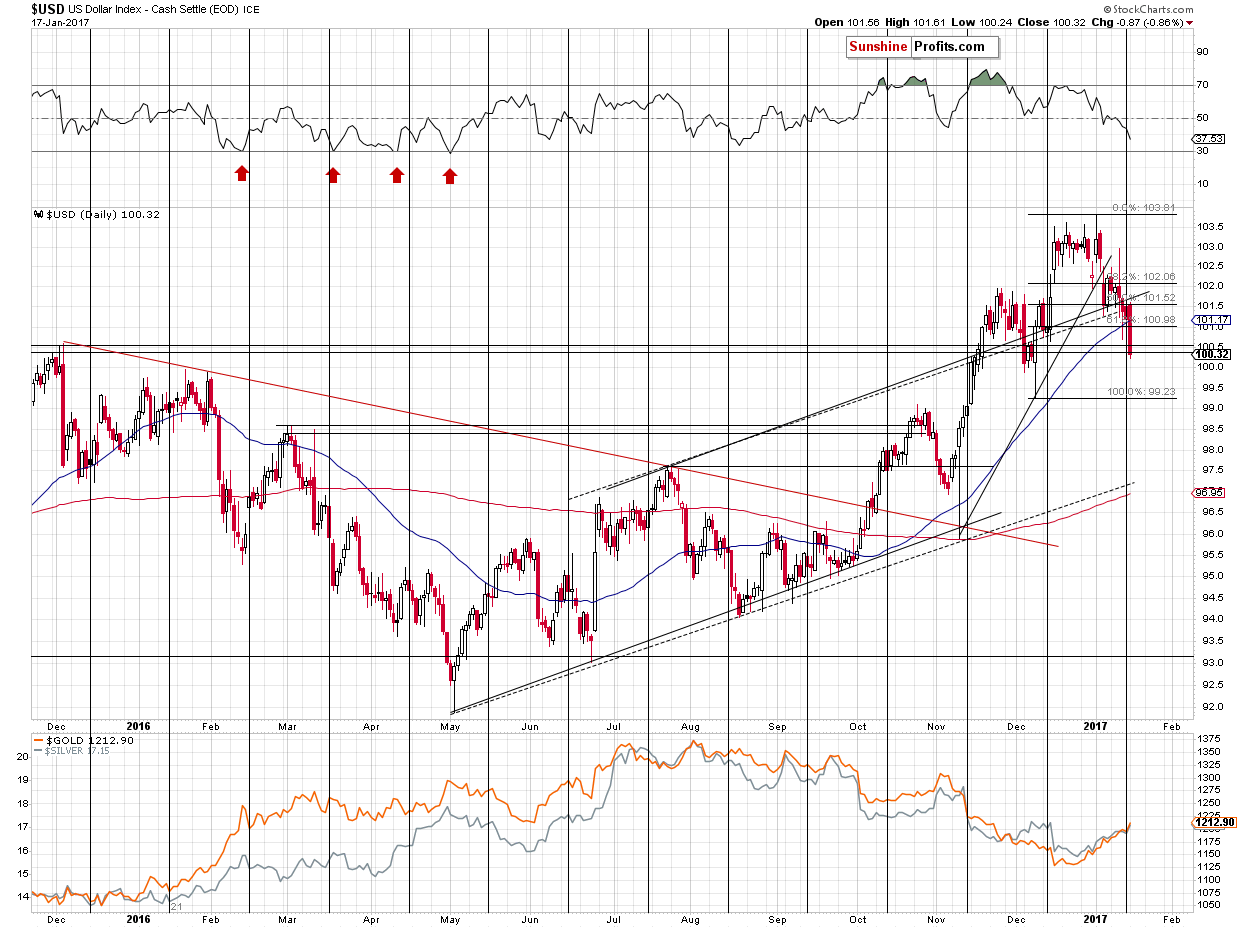
The USD Index is almost right at the cyclical turning point and at the moment of writing these words it moved to 100.66. The most recent move is definitely down, so the turning point has definitely bullish implications. The support is provided by the December 2015 high – 100.60, very close to the current levels.
The USD Index moved even lower yesterday, but gold didn’t move higher than it was when we wrote the above (about $1,217). In other words, gold didn’t respond to an additional decline. This suggests that even if the USD Index drops further, gold may not rally or may not rally far. However, if the USD rebounds visibly, gold is likely to be affected negatively to a great extent.
Can the USD Index rally shortly? Naturally – it moved back to the December 2015 high (even a bit below it) and is now back at 100.67 at the moment of writing these words (gold is at $1,212), so it appears that the move above the December 2015 high is verified. Plus, the turning point suggests that a reversal is upon us and the most recent move was definitely down – the implications are bullish.
Why did the USD Index plunge so significantly yesterday? Trump said that the USD was too strong. Did this materially change anything? No – that’s an opinion of an important person, but that doesn’t change the fact that the interest rates in the U.S. are most likely going higher and the rates in the EU and other parts of the world are unlikely to move higher (the opposite appears more likely). Consequently, the USD Index should not be impaired in the coming months and yesterday’s reaction is likely emotional and temporary.
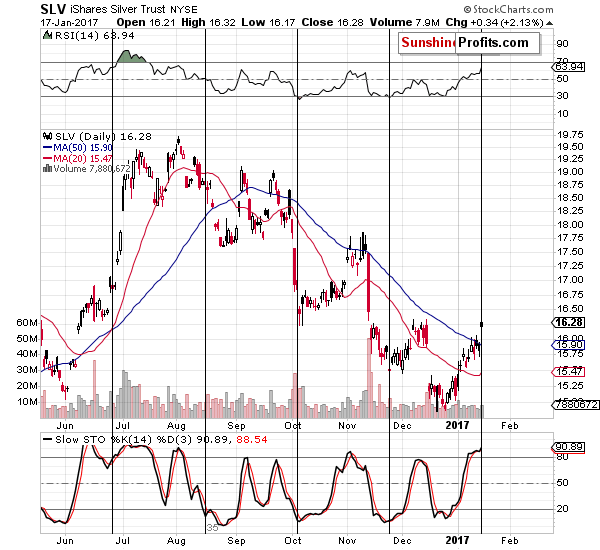
Silver rallied right at its turning point and it outperformed gold on a very short-term basis, which is a very bearish combination. As soon as silver declines a little (and it’s likely to), a sell signal from the Stochastic indicator based on the SLV ETF will also emerge, further confirming the bearish case. It appears that we are on the verge of another significant decline in the white metal.
In the case of gold, we wrote the following yesterday:
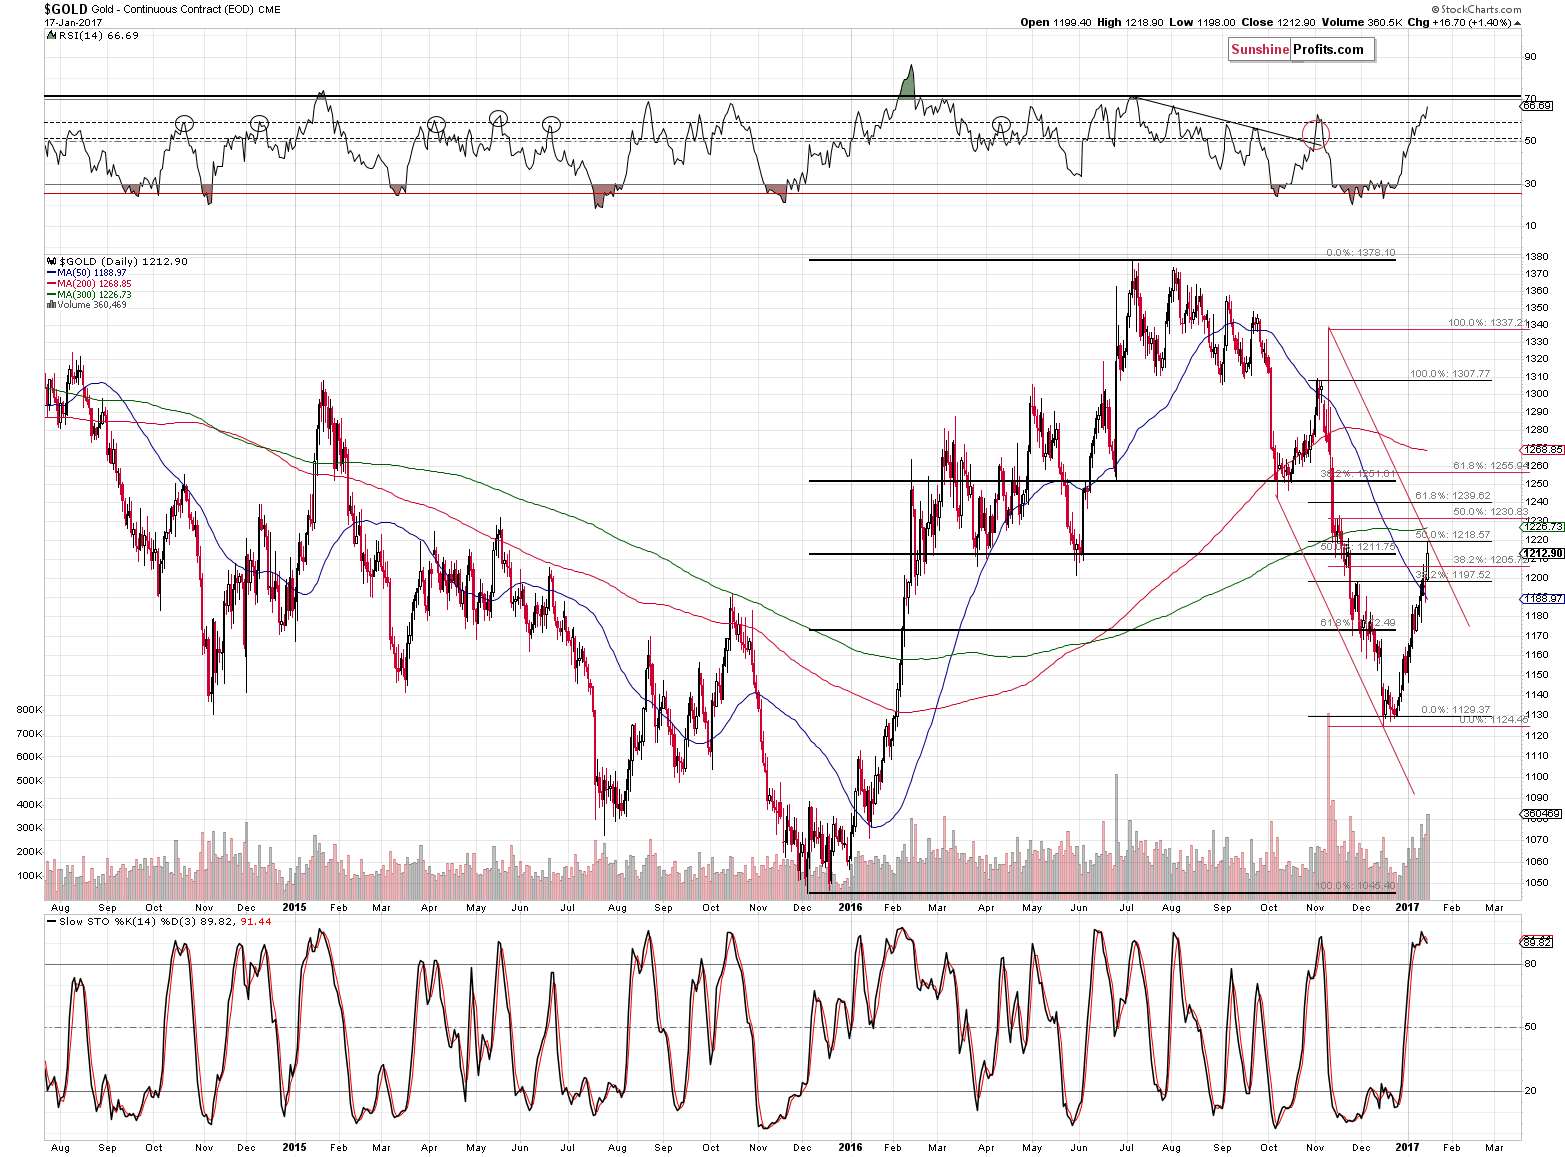
Gold moved to $1,219 today, so the 50% Fibonacci retracement was reached and that was almost the case with the declining red resistance line. In light of the turning points and support being reached in the USD Index, it seems likely that today’s session is the final reversal (or extremely close to it) – perhaps today’s session or the following one will be just like the session after the U.S. Presidential elections – with gold sliding quickly right after the uncertainty had peaked.
Gold didn’t slide as much as previously, but still, it stopped the rally after moving to the 50% Fibonacci retracement and the declining resistance line. Gold also closed below the March / May 2016 lows in terms of daily closing prices. Without a breakout, the move higher is likely just a verification of the breakdown.
As far as mining stocks are concerned, we wrote the following yesterday:
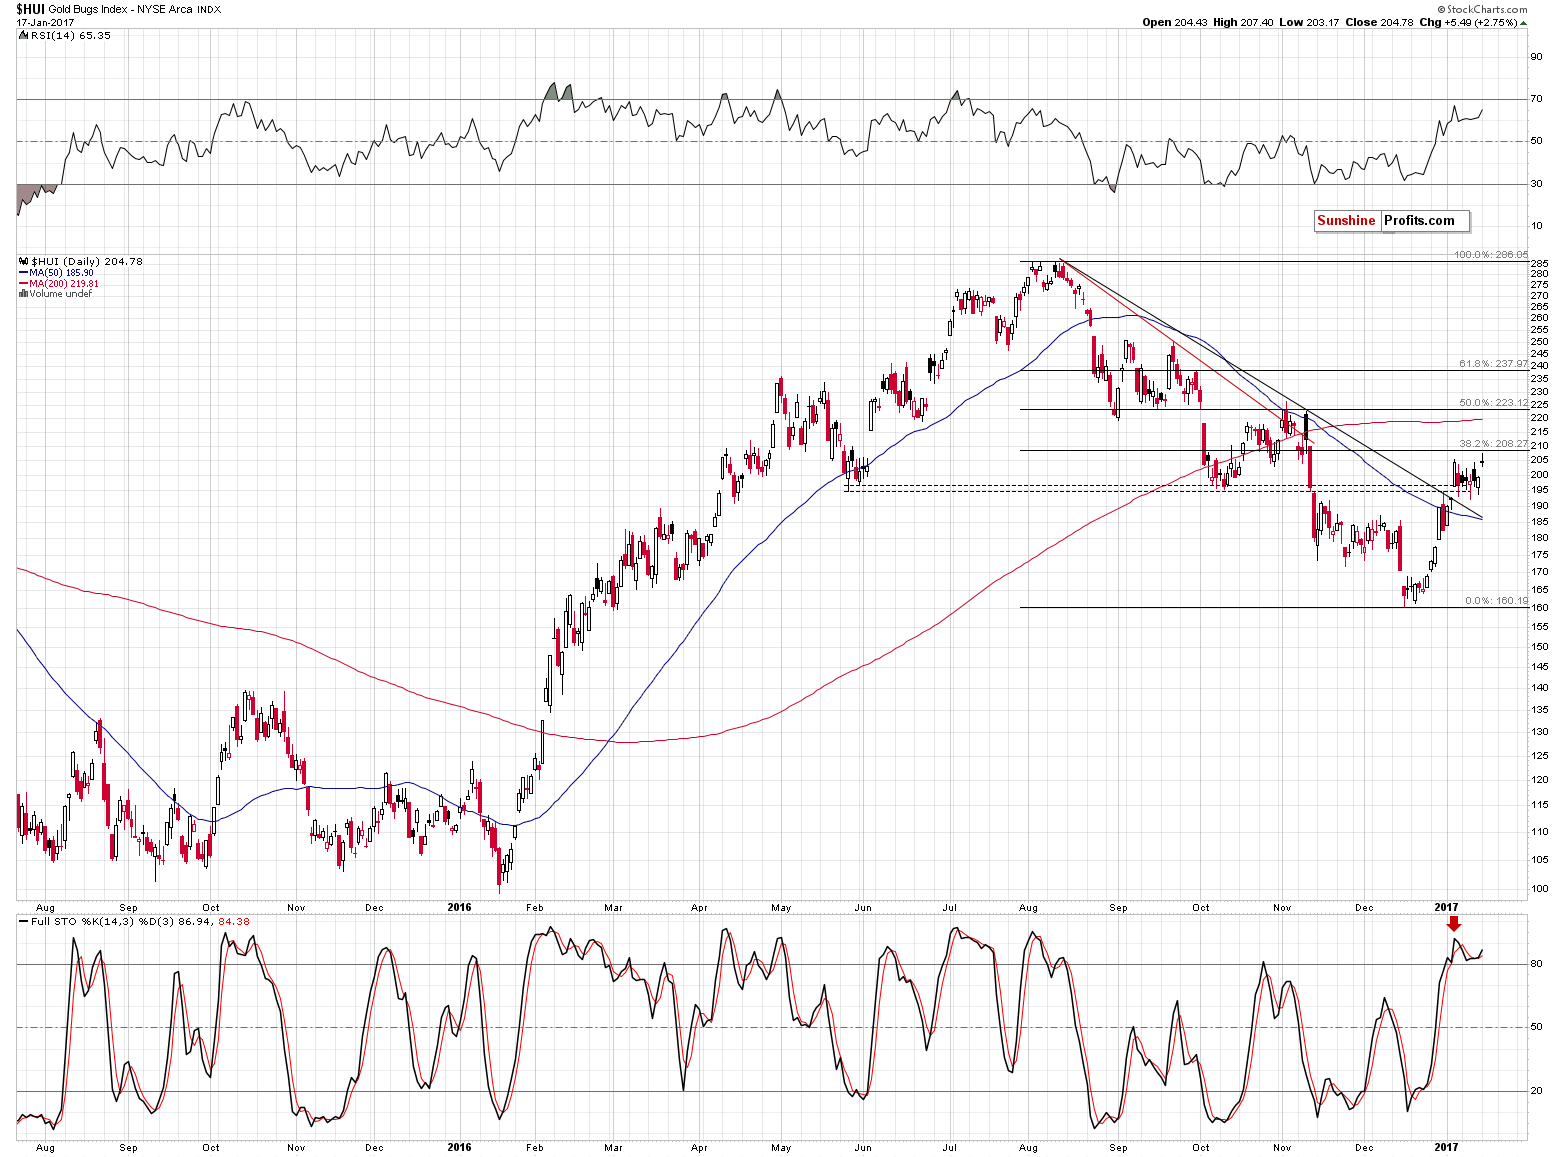
Since gold moved higher, gold miners are also likely to move a little higher, but the 38.2% Fibonacci retracement will likely keep the rally in check. Miners have been underperforming gold for several days (bearish implications) and the implications are bearish.
The above remains up-to-date – gold miners moved very close to the 38.2% Fibonacci retracement, but there was no move back above it – the rally that we saw recently appears to be nothing more than a correction after a big decline.
Summing up, the bearish medium-term outlook remains in place and it seems that yesterday’s upswing was temporary. Turning points in the USD Index and silver (along with the latter’s outperformance relative to gold) suggest that lower, not higher, prices of precious metals are just around the corner. Once we see additional bearish confirmations, we might increase the size of the position further, but it seems that it’s too early to do so now.
As always, we will keep you – our subscribers – informed.
To summarize:
Trading capital (supplementary part of the portfolio; our opinion): Short positions (100% of the full position) in gold, silver and mining stocks are justified from the risk/reward perspective with the following stop-loss orders and initial target price levels / profit-take orders:
- Gold: exit-profit-take level: $1,063; stop-loss: $1,243; initial target price for the DGLD ETN: $81.88; stop-loss for the DGLD ETN $48.78
- Silver: initial target price: $13.12; stop-loss: $17.53; initial target price for the DSLV ETN: $46.18; stop-loss for the DSLV ETN $24.86
- Mining stocks (price levels for the GDX ETF): initial target price: $9.34; stop-loss: $24.63; initial target price for the DUST ETF: $143.56; stop-loss for the DUST ETF $27.97
In case one wants to bet on junior mining stocks' prices (we do not suggest doing so – we think senior mining stocks are more predictable in the case of short-term trades – if one wants to do it anyway, we provide the details), here are the stop-loss details and initial target prices:
- GDXJ ETF: initial target price: $14.13; stop-loss: $40.12
- JDST ETF: initial target price: $104.26; stop-loss: $18.88
Long-term capital (core part of the portfolio; our opinion): No positions (in other words: cash)
Insurance capital (core part of the portfolio; our opinion): Full position
Please note that the in the trading section we describe the situation for the day that the alert is posted. In other words, it we are writing about a speculative position, it means that it is up-to-date on the day it was posted. We are also featuring the initial target prices, so that you can decide whether keeping a position on a given day is something that is in tune with your approach (some moves are too small for medium-term traders and some might appear too big for day-traders).
Plus, you might want to read why our stop-loss orders are usually relatively far from the current price.
Please note that a full position doesn’t mean using all of the capital for a given trade. You will find details on our thoughts on gold portfolio structuring in the Key Insights section on our website.
As a reminder – “initial target price” means exactly that – an “initial” one, it’s not a price level at which we suggest closing positions. If this becomes the case (like it did in the previous trade) we will refer to these levels as levels of exit orders (exactly as we’ve done previously). Stop-loss levels, however, are naturally not “initial”, but something that, in our opinion, might be entered as an order.
Since it is impossible to synchronize target prices and stop-loss levels for all the ETFs and ETNs with the main markets that we provide these levels for (gold, silver and mining stocks – the GDX ETF), the stop-loss levels and target prices for other ETNs and ETF (among other: UGLD, DGLD, USLV, DSLV, NUGT, DUST, JNUG, JDST) are provided as supplementary, and not as “final”. This means that if a stop-loss or a target level is reached for any of the “additional instruments” (DGLD for instance), but not for the “main instrument” (gold in this case), we will view positions in both gold and DGLD as still open and the stop-loss for DGLD would have to be moved lower. On the other hand, if gold moves to a stop-loss level but DGLD doesn’t, then we will view both positions (in gold and DGLD) as closed. In other words, since it’s not possible to be 100% certain that each related instrument moves to a given level when the underlying instrument does, we can’t provide levels that would be binding. The levels that we do provide are our best estimate of the levels that will correspond to the levels in the underlying assets, but it will be the underlying assets that one will need to focus on regarding the signs pointing to closing a given position or keeping it open. We might adjust the levels in the “additional instruments” without adjusting the levels in the “main instruments”, which will simply mean that we have improved our estimation of these levels, not that we changed our outlook on the markets. We are already working on a tool that would update these levels on a daily basis for the most popular ETFs, ETNs and individual mining stocks.
Our preferred ways to invest in and to trade gold along with the reasoning can be found in the how to buy gold section. Additionally, our preferred ETFs and ETNs can be found in our Gold & Silver ETF Ranking.
As always, we'll keep you - our subscribers - updated should our views on the market change. We will continue to send out Gold & Silver Trading Alerts on each trading day and we will send additional Alerts whenever appropriate.
The trading position presented above is the netted version of positions based on subjective signals (opinion) from your Editor, and the Tools and Indicators.
As a reminder, Gold & Silver Trading Alerts are posted before or on each trading day (we usually post them before the opening bell, but we don't promise doing that each day). If there's anything urgent, we will send you an additional small alert before posting the main one.
=====
Latest Free Trading Alerts:
Last week, the World Gold Council presented its outlook for the gold market in 2017. What can we learn from the publication?
=====
Hand-picked precious-metals-related links:
PRECIOUS-Gold slips from 8-week highs as dollar regains poise
Dollar reversal boost for gold likely to be temporary
=====
In other news:
Dollar recovers some ground after five days of falls
Pound Set for Best Day Since 2008 After May’s Brexit Statement
Davos Elite Searches for Fixes to Save Its System From Populists
Trump's protectionist policies top risk to U.S. economy in 2017: Reuters poll
The euro cannot survive unless Europe changes
Oil price slides on prospect of rising U.S. production
Chinese province admits falsifying economic data for years
=====
Thank you.
Sincerely,
Przemyslaw Radomski, CFA
Founder, Editor-in-chief, Gold & Silver Fund Manager
Gold & Silver Trading Alerts
Forex Trading Alerts
Oil Investment Updates
Oil Trading Alerts

