

Briefly: In our opinion, full (100% of the regular full position) speculative short positions in gold, silver and mining stocks are justified from the risk/reward perspective. This position was originally featured on Jan. 12, 2017 at 3:49PM.
Gold and the USD Index moved through their important retracement levels yesterday, but both invalidated these moves before the end of the session. The implications are profound for the coming days, as they once again (in a relatively short period) changed the short-term outlook from mildly bullish to bearish.
We already covered the key points in yesterday’s second alert, so in today’s alert will focus on illustrating them. We wrote the following:
(…) it seems that the short positions are now - based on today’s session - once again justified from the risk to reward point of view.
The reasons are:
- The shape of today’s session in gold (big daily reversal)
- Very likely close below the 38.2% Fibonacci retracement based on the daily closing prices
- A move a bit above the 38.2% Fibonacci retracement based on the intra-day extremes
- The big daily reversal in the USD Index and invalidation of the move below its 61.8% Fibonacci retracement that took place right before the cyclical turning point
- Mining stocks reversal, underperformance and likely close below yesterday’s closing price
What we haven’t seen today is silver’s short-term outperformance, which is not necessary, but it would be a great addition to the above list of bearish factors. Because of the above, we are not re-entering the position with 150% of the full position, but with 100% of the full position.
Let’s take a look at the charts (charts courtesy of http://stockcharts.com).
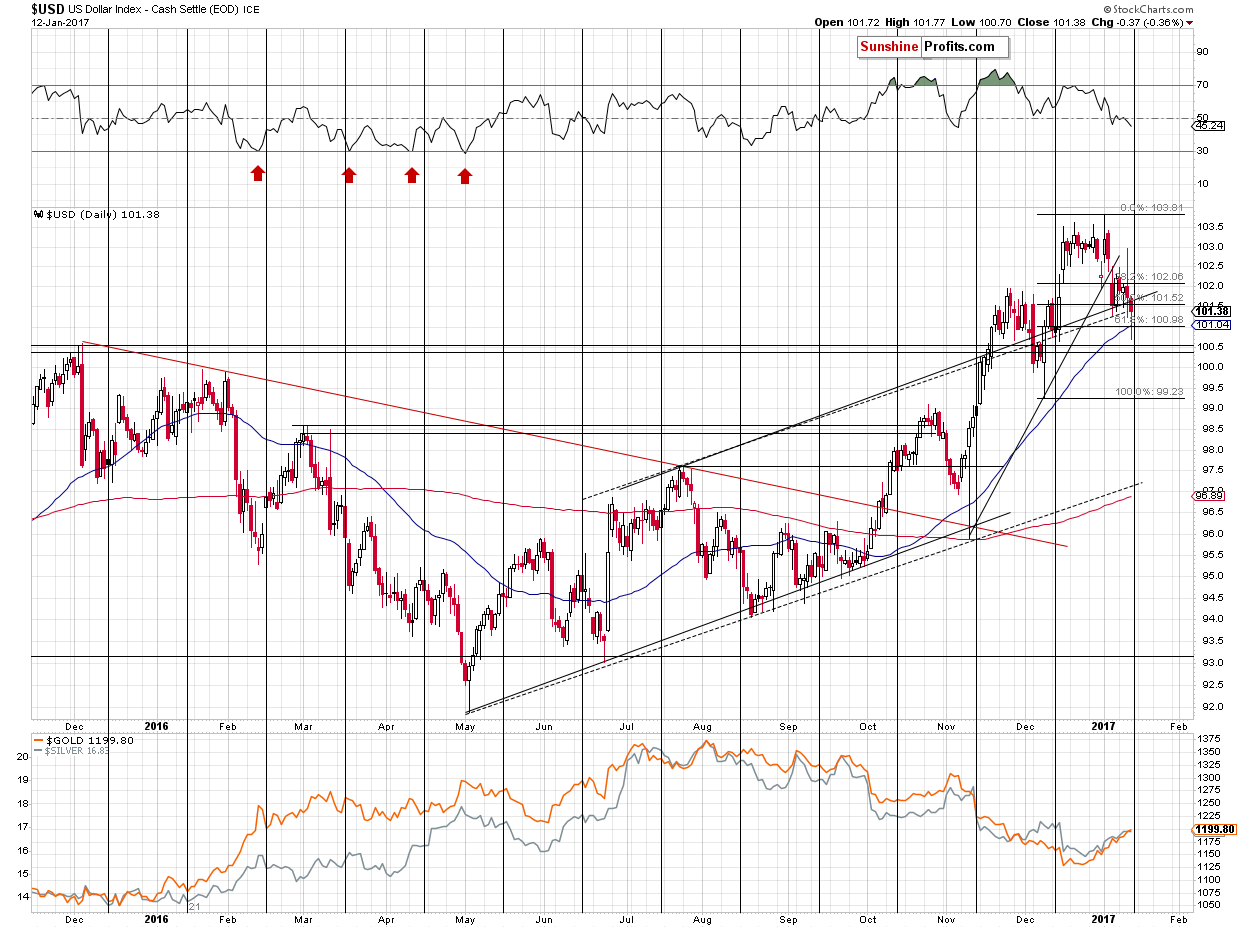
The USD Index moved temporarily below the 50-day moving average and the 61.8% Fibonacci retracement level and invalidated these moves before the session was over – this by itself is a sign of a reversal. The shape of the session (hammer reversal candlestick) confirms it and the proximity of the turning point adds to the credibility of the signal. The bullish situation for the USD Index has bearish implications for the precious metals market.
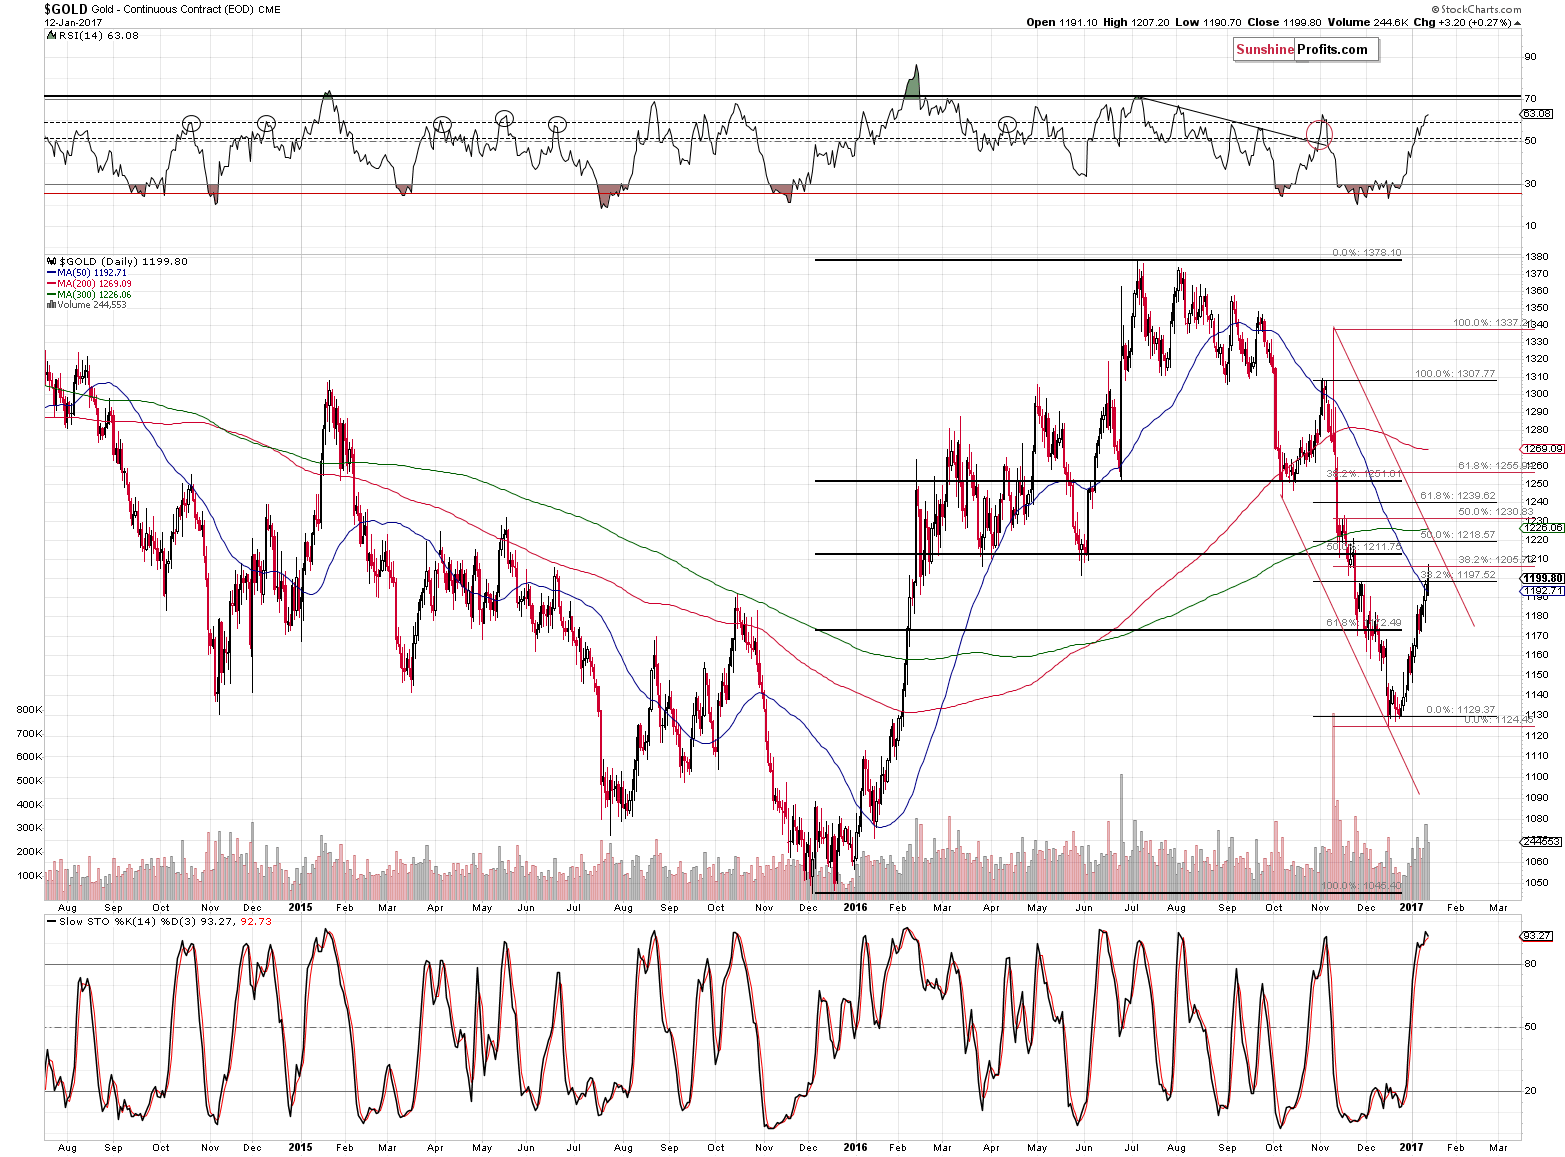
Gold too reversed its move above the Fibonacci retracement level (38.2%) and it took place in terms of both intra-day prices and daily closing prices (Stockcharts.com’s data seems to show gold a few dollars above the actual closing price, which was $1,195). At the same time, gold moved to the previously broken lows (March 2016, April 2016, and May 2016) and verified them as resistance (thus the breakdown was verified).
The sell signal from the Stochastic indicator is not yet visible, but given the levels that were reached, it seems to be at hand.
Most importantly – in addition to the invalidation of the move back above 38.2% retracement – gold reversed in a quite profound way, forming a bearish shooting star candlestick. It’s not really clear on the above chart (as its based on the $1,199 as the closing price, while the closing price reported by finance.yahoo.com and kitco.com was $4 lower), but the implications are bearish nonetheless.
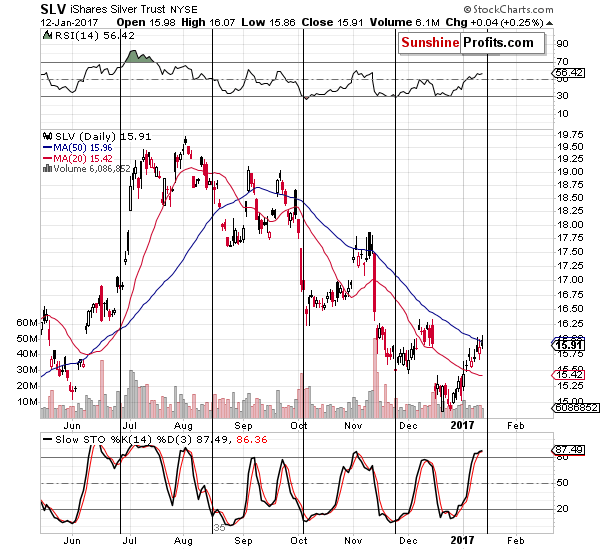
Silver’s (SLV’s) chart confirms the bearish outlook, but doesn’t indicate that it’s extremely bearish. What we wrote about it in our first alert yesterday remains up-to-date:
The USD Index is not the only market with a looming turning point – we can say the same thing about silver. In case of gold’s sister metal, the most recent short-term move was definitely up, so the implications are bearish. Silver is now close to the 50-day moving average and right before the turning point – that’s the combination that we saw right before the biggest price slides of 2016 (about 2 and 4 months ago). Naturally, the implications are bearish.
Still, silver is also known to outperform significantly right before slides, so we could see a daily or a few-day long rally just before silver takes another dive. This scenario was not likely before Trump’s surprising speech, but it is now too likely to be ignored.
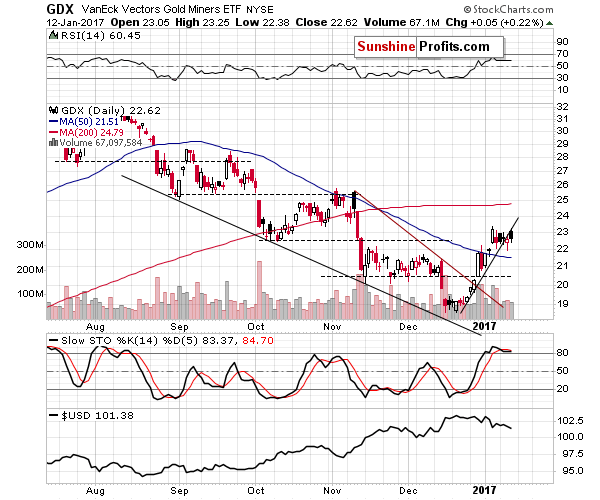
Mining stocks were basically flat yesterday even though gold moved a bit higher and USD closed lower. Miners simply continue to underperform (bearish implications) and they reversed in a way that’s very similar to what happened in early November (please note the move back to the previous highs and the black candlestick in both cases) – the implications are bearish as a big rally followed previously. The sell signal from the Stochastic indicator remains in place as well.
Summing up, the bearish medium-term outlook remains in place and based on the shape of yesterday’s session the short-term outlook is once again bearish as well. Once we see additional bearish confirmations, we might increase the size of the position further, but it seems that it’s too early to do so now.
As always, we will keep you – our subscribers – informed.
To summarize:
Trading capital (supplementary part of the portfolio; our opinion): Short positions (100% of the full position) in gold, silver and mining stocks are justified from the risk/reward perspective with the following stop-loss orders and initial target price levels / profit-take orders:
- Gold: exit-profit-take level: $1,063; stop-loss: $1,243; initial target price for the DGLD ETN: $81.88; stop-loss for the DGLD ETN $48.78
- Silver: initial target price: $13.12; stop-loss: $17.53; initial target price for the DSLV ETN: $46.18; stop-loss for the DSLV ETN $24.86
- Mining stocks (price levels for the GDX ETF): initial target price: $9.34; stop-loss: $24.63; initial target price for the DUST ETF: $143.56; stop-loss for the DUST ETF $27.97
In case one wants to bet on junior mining stocks' prices (we do not suggest doing so – we think senior mining stocks are more predictable in the case of short-term trades – if one wants to do it anyway, we provide the details), here are the stop-loss details and initial target prices:
- GDXJ ETF: initial target price: $14.13; stop-loss: $40.12
- JDST ETF: initial target price: $104.26; stop-loss: $18.88
Long-term capital (core part of the portfolio; our opinion): No positions (in other words: cash)
Insurance capital (core part of the portfolio; our opinion): Full position
Please note that the in the trading section we describe the situation for the day that the alert is posted. In other words, it we are writing about a speculative position, it means that it is up-to-date on the day it was posted. We are also featuring the initial target prices, so that you can decide whether keeping a position on a given day is something that is in tune with your approach (some moves are too small for medium-term traders and some might appear too big for day-traders).
Plus, you might want to read why our stop-loss orders are usually relatively far from the current price.
Please note that a full position doesn’t mean using all of the capital for a given trade. You will find details on our thoughts on gold portfolio structuring in the Key Insights section on our website.
As a reminder – “initial target price” means exactly that – an “initial” one, it’s not a price level at which we suggest closing positions. If this becomes the case (like it did in the previous trade) we will refer to these levels as levels of exit orders (exactly as we’ve done previously). Stop-loss levels, however, are naturally not “initial”, but something that, in our opinion, might be entered as an order.
Since it is impossible to synchronize target prices and stop-loss levels for all the ETFs and ETNs with the main markets that we provide these levels for (gold, silver and mining stocks – the GDX ETF), the stop-loss levels and target prices for other ETNs and ETF (among other: UGLD, DGLD, USLV, DSLV, NUGT, DUST, JNUG, JDST) are provided as supplementary, and not as “final”. This means that if a stop-loss or a target level is reached for any of the “additional instruments” (DGLD for instance), but not for the “main instrument” (gold in this case), we will view positions in both gold and DGLD as still open and the stop-loss for DGLD would have to be moved lower. On the other hand, if gold moves to a stop-loss level but DGLD doesn’t, then we will view both positions (in gold and DGLD) as closed. In other words, since it’s not possible to be 100% certain that each related instrument moves to a given level when the underlying instrument does, we can’t provide levels that would be binding. The levels that we do provide are our best estimate of the levels that will correspond to the levels in the underlying assets, but it will be the underlying assets that one will need to focus on regarding the signs pointing to closing a given position or keeping it open. We might adjust the levels in the “additional instruments” without adjusting the levels in the “main instruments”, which will simply mean that we have improved our estimation of these levels, not that we changed our outlook on the markets. We are already working on a tool that would update these levels on a daily basis for the most popular ETFs, ETNs and individual mining stocks.
Our preferred ways to invest in and to trade gold along with the reasoning can be found in the how to buy gold section. Additionally, our preferred ETFs and ETNs can be found in our Gold & Silver ETF Ranking.
As always, we'll keep you - our subscribers - updated should our views on the market change. We will continue to send out Gold & Silver Trading Alerts on each trading day and we will send additional Alerts whenever appropriate.
The trading position presented above is the netted version of positions based on subjective signals (opinion) from your Editor, and the Tools and Indicators.
As a reminder, Gold & Silver Trading Alerts are posted before or on each trading day (we usually post them before the opening bell, but we don't promise doing that each day). If there's anything urgent, we will send you an additional small alert before posting the main one.
=====
Latest Free Trading Alerts:
The Fed officials have offered hawkish comments recently. What do they mean for the gold market?
Gold Shrugs Off Hawkish Fed Comments
Will 2017 be better than 2016 for the yellow metal? We invite you to read our today’s article, offering some qualitative predictions for the gold market for the upcoming months, and learn what factors will affect the price of gold in the new year.
Gold’s Fundamental Outlook for 2017
=====
Hand-picked precious-metals-related links:
Dollar Set for Weekly Loss, Stocks Climb With Gold: Markets Wrap
Pros Not Convinced by Gold ETF Rally
Central Bank likely to continue to buy Gold in 2017 but at a slower pace
=====
In other news:
Dollar limps to worst week in two months, sterling stays shaky
Here's Trump's Gift to Mario Draghi
World Bank forecasting brighter prospects for 2017
Oil set for weekly fall on doubts over extent of OPEC cuts
PBOC Said to Boost Yuan Curbs as Banks Told to Balance Flows
=====
Thank you.
Sincerely,
Przemyslaw Radomski, CFA
Founder, Editor-in-chief, Gold & Silver Fund Manager
Gold & Silver Trading Alerts
Forex Trading Alerts
Oil Investment Updates
Oil Trading Alerts

