

Briefly: In our opinion, full (150% of the regular full position) speculative short positions in gold, silver and mining stocks are justified from the risk/reward perspective.
Gold moved higher in the final week of trading of the previous year. The beginning of January (given that January is traditionally a strong month for gold) seems to support much higher gold prices in the following weeks – but will higher prices really follow?
Probably not. The True Seasonal tendencies are useful mostly when there is no strong trend present – and we have one right now. Let’s discuss last week’s events in greater detail, starting with the currency markets (charts courtesy of http://stockcharts.com).
In Friday’s alert, we wrote the following:
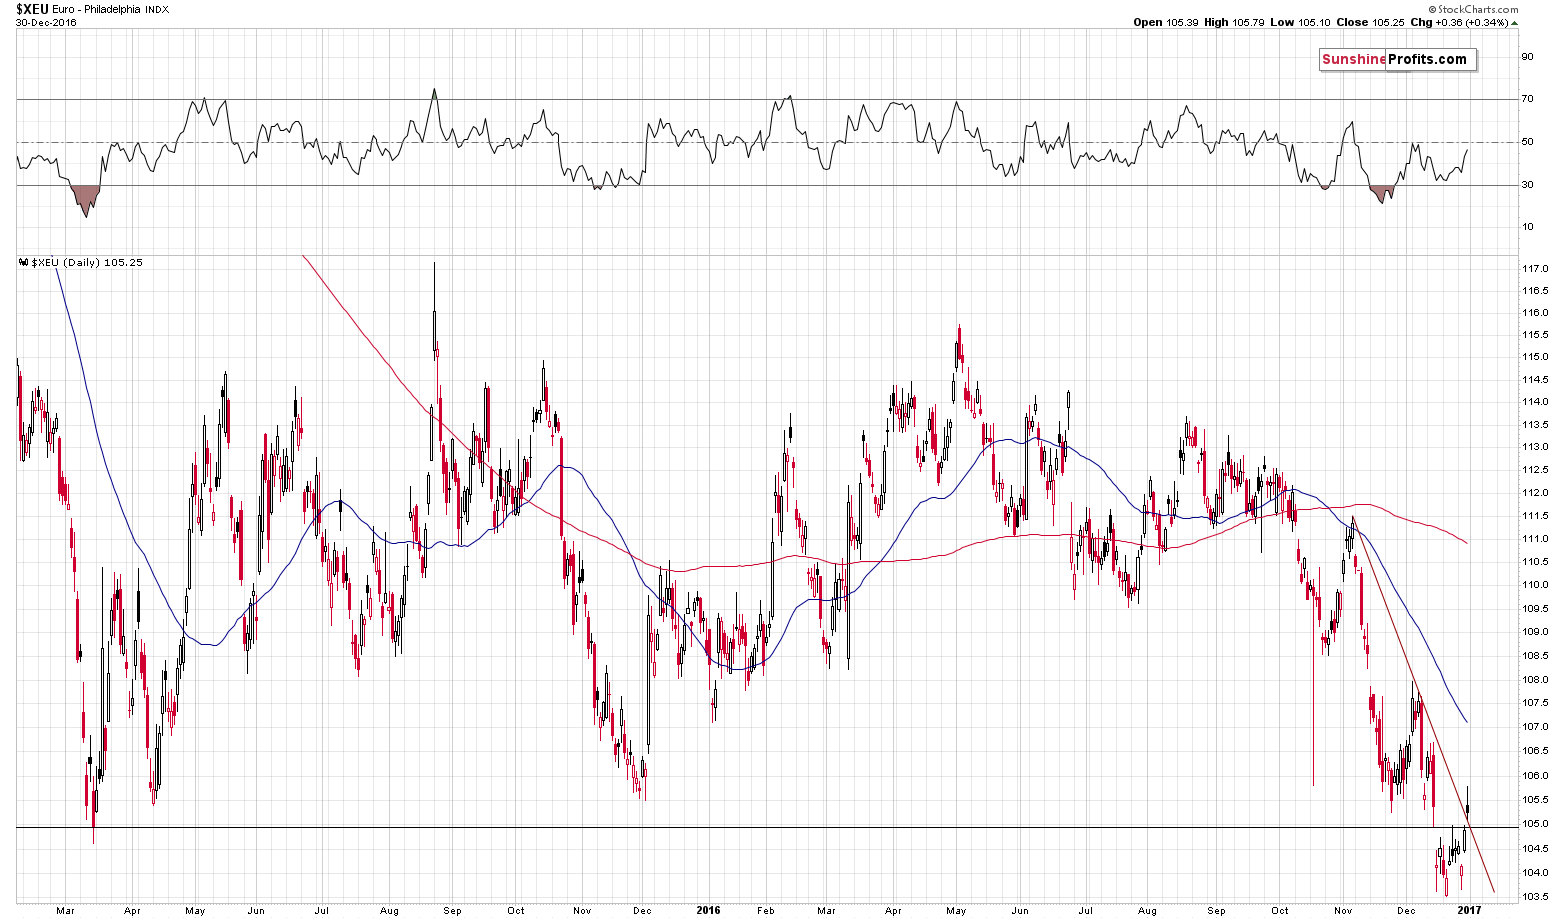
The breakdown in EUR/USD was almost invalidated. The key word here is “almost” – it was NOT invalidated in terms of daily / weekly closing prices and thus this week’s move higher is nothing more than just a verification of the previous breakdown. The implications remain very bearish for the coming weeks and months. They are also bearish for the coming days as the resistance created by the March 2015 low is very close.
The implications of the above are bearish for the precious metals sector.
Please note that today’s pre-market action (quick rally followed by a decline) in the EUR/USD and the USD Index doesn’t invalidate the above.
Based on the daily closing prices, the breakdown was indeed invalidated. There is one thing that doesn’t make it a big deal yet (this situation has potential to become very bullish, but that’s not yet the case). The thing is that once we saw the breakdown, the EUR/USD pair stayed below the 2015 low for about 2 weeks. That’s more than enough to confirm the breakdown. Was a single session enough to really change the outlook? Not necessarily. The USD Index paints an entirely different picture.
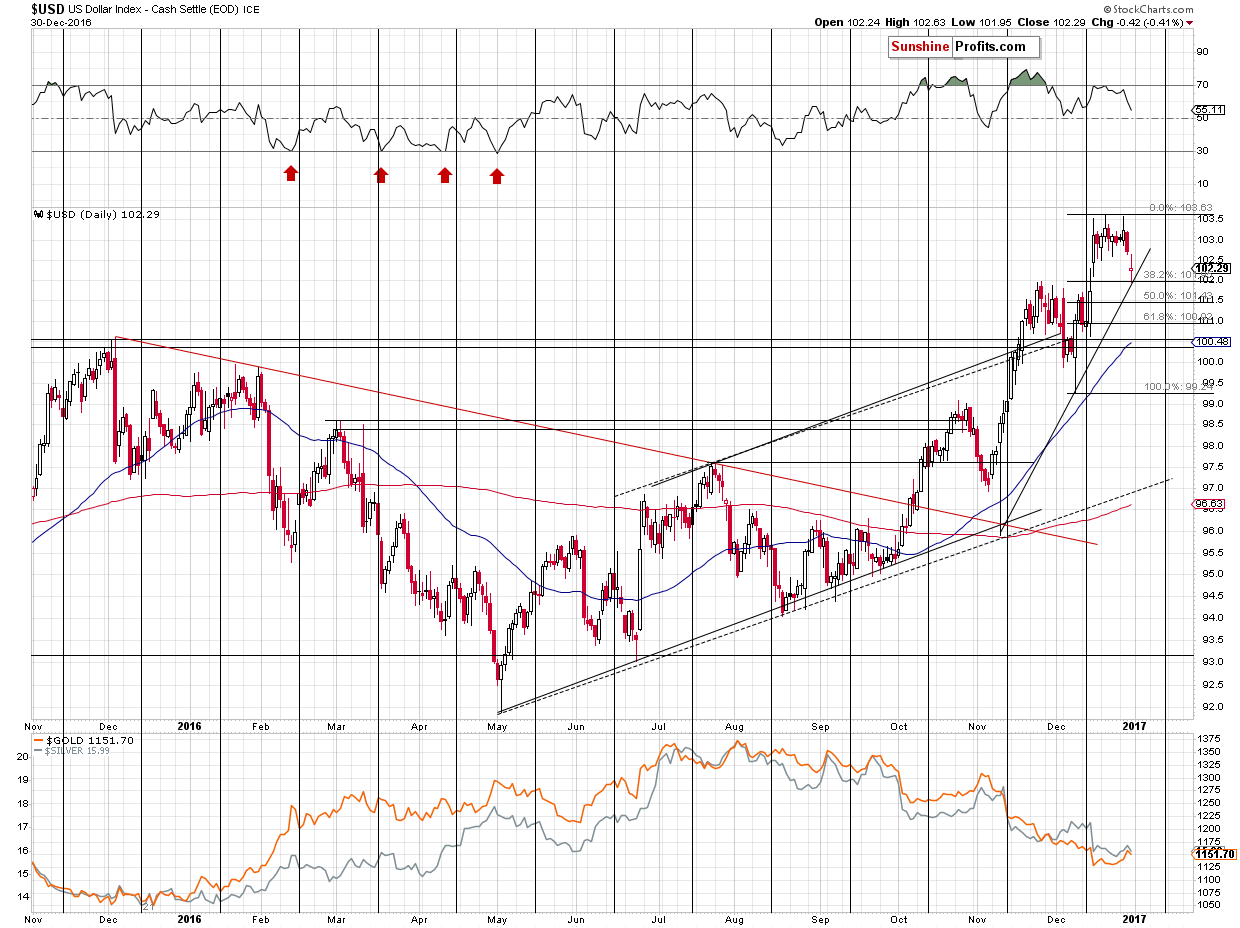
In fact, our previous comments on the USD Index remain up-to-date:
What happened today is that the USD Index moved slightly below the 102 level and moved back up, being at 102.25 at the moment of writing these words. This means that the USD Index already moved back to combination of its support levels – the November high and the rising support line. It is not bullish by itself. It is bullish because the last 2 times that we saw these reversals (Dec. 8 and Nov. 9) marked major short-term bottoms in the USD Index and local tops (as well as excellent shorting opportunities) in precious metals.
The implications are bearish and – more importantly – more bearish than they were just a few days ago.
The long-term USD Index chart confirms the above.
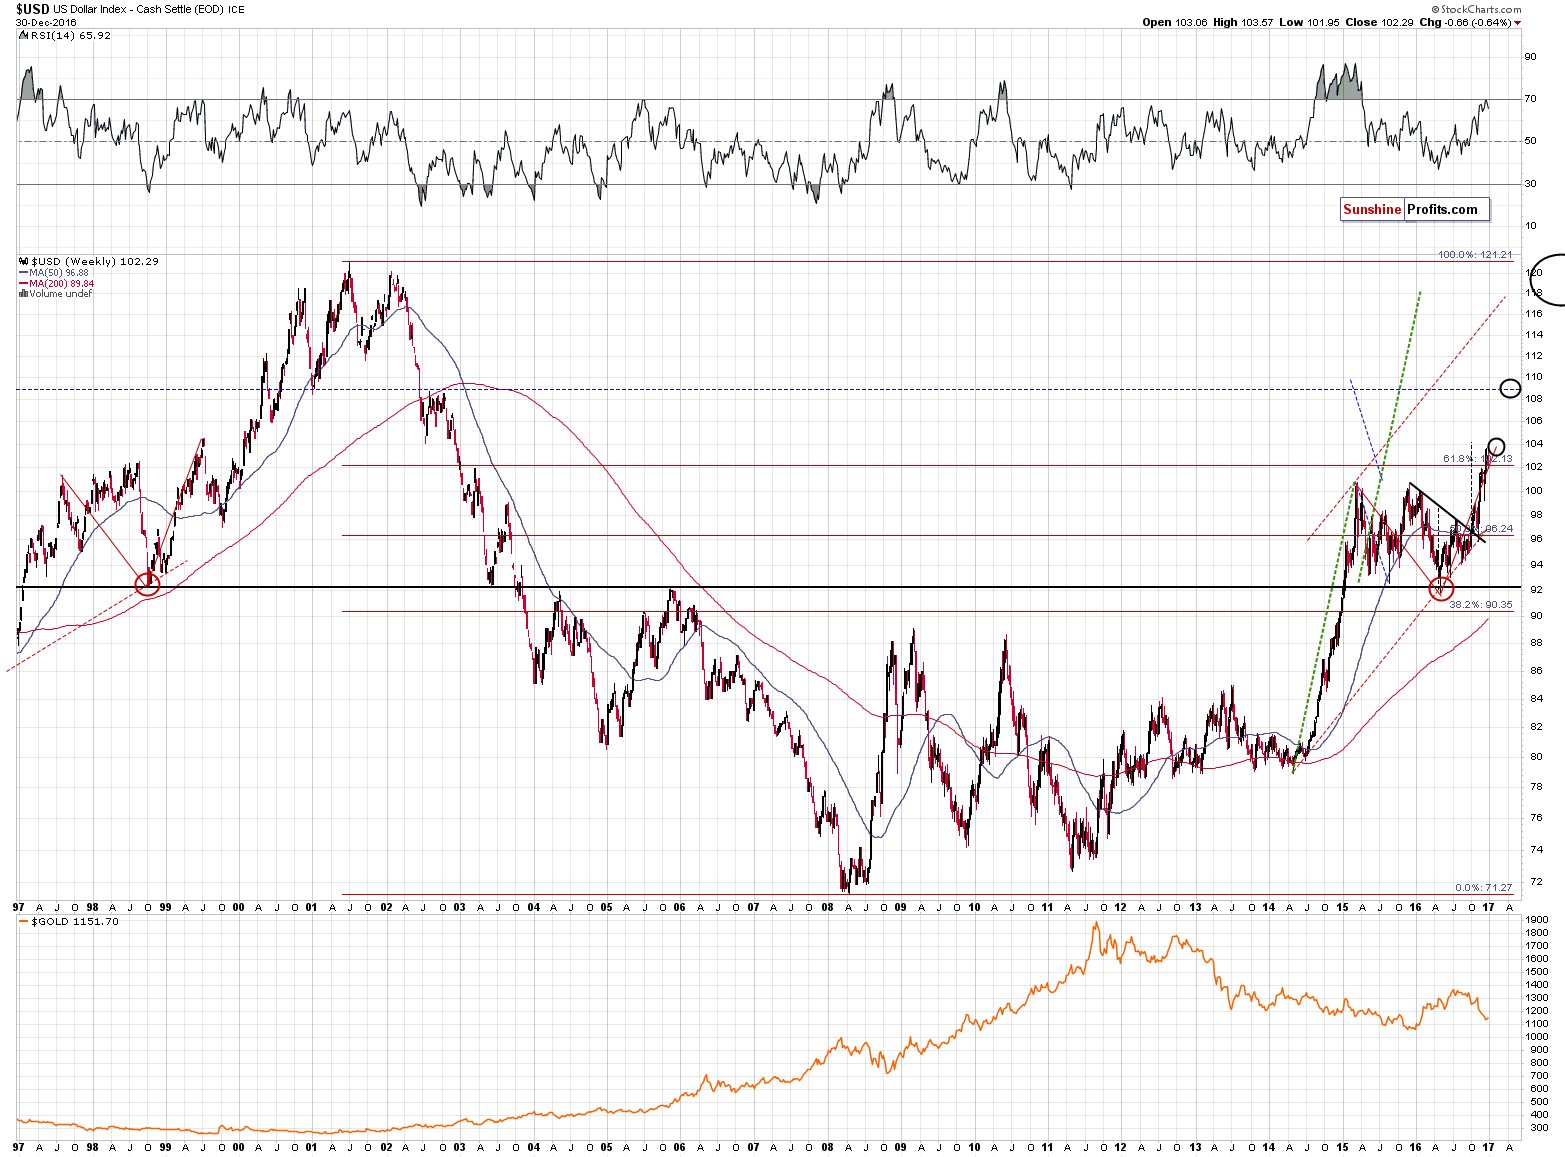
The USD Index closed the year above the key 61.8% Fibonacci retracement level (after staying above it for weeks). Technically, the breakout above it is confirmed and we have a bull market in the USD Index, not only a corrective upswing after the 2001 – 2008 decline. On a side note, the 2016 upswing in gold failed to take gold even above the first classic Fibonacci retracement (38.2%) based on the 2011 – 2015 decline.
Gold didn’t manage to rally above the 38.2% retracement based on the big decline, so the 2016 rally that we saw in the first half of the year was most likely just a corrective upswing within a decline (that’s just a technical confirmation – the main reason is that gold wasn’t hated enough at the 2015 “bottom”). Conversely, the decline that we saw in late 2016 erased more than 61.8% of the early 2016 rally, so its most likely not just a correction within a medium-term rally. The implications are bearish for the following weeks.
In Friday’s alert, we wrote the following:
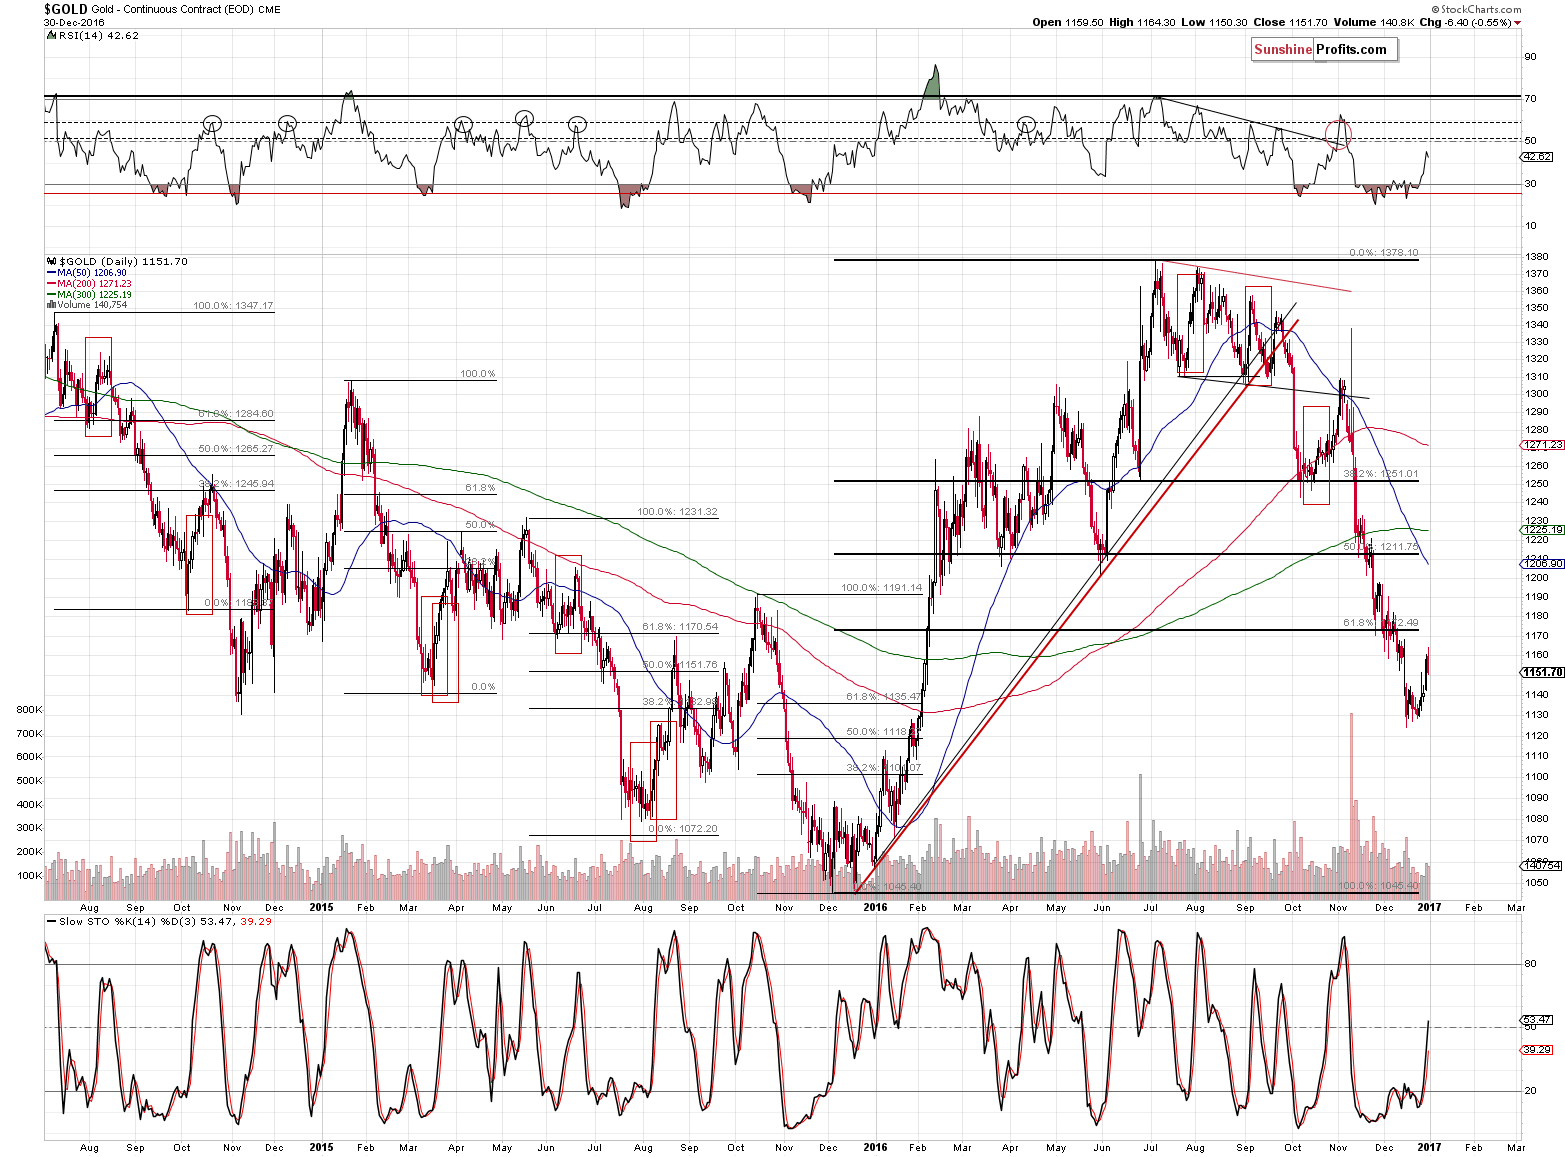
The gold chart shows that the volume that accompanied the upswing was not huge, but it was not tiny either, which has little implications, overall. What’s important is that the next resistance that would likely stop gold is at the previously broken 61.8% Fibonacci retracement level – at about $1,172.5. This means that gold could move another $15 higher or so before it reverses.
Gold moved to $1,164.30 on Friday, so it was only about $8 away from the possible upside target. The top might already be in based on the above.
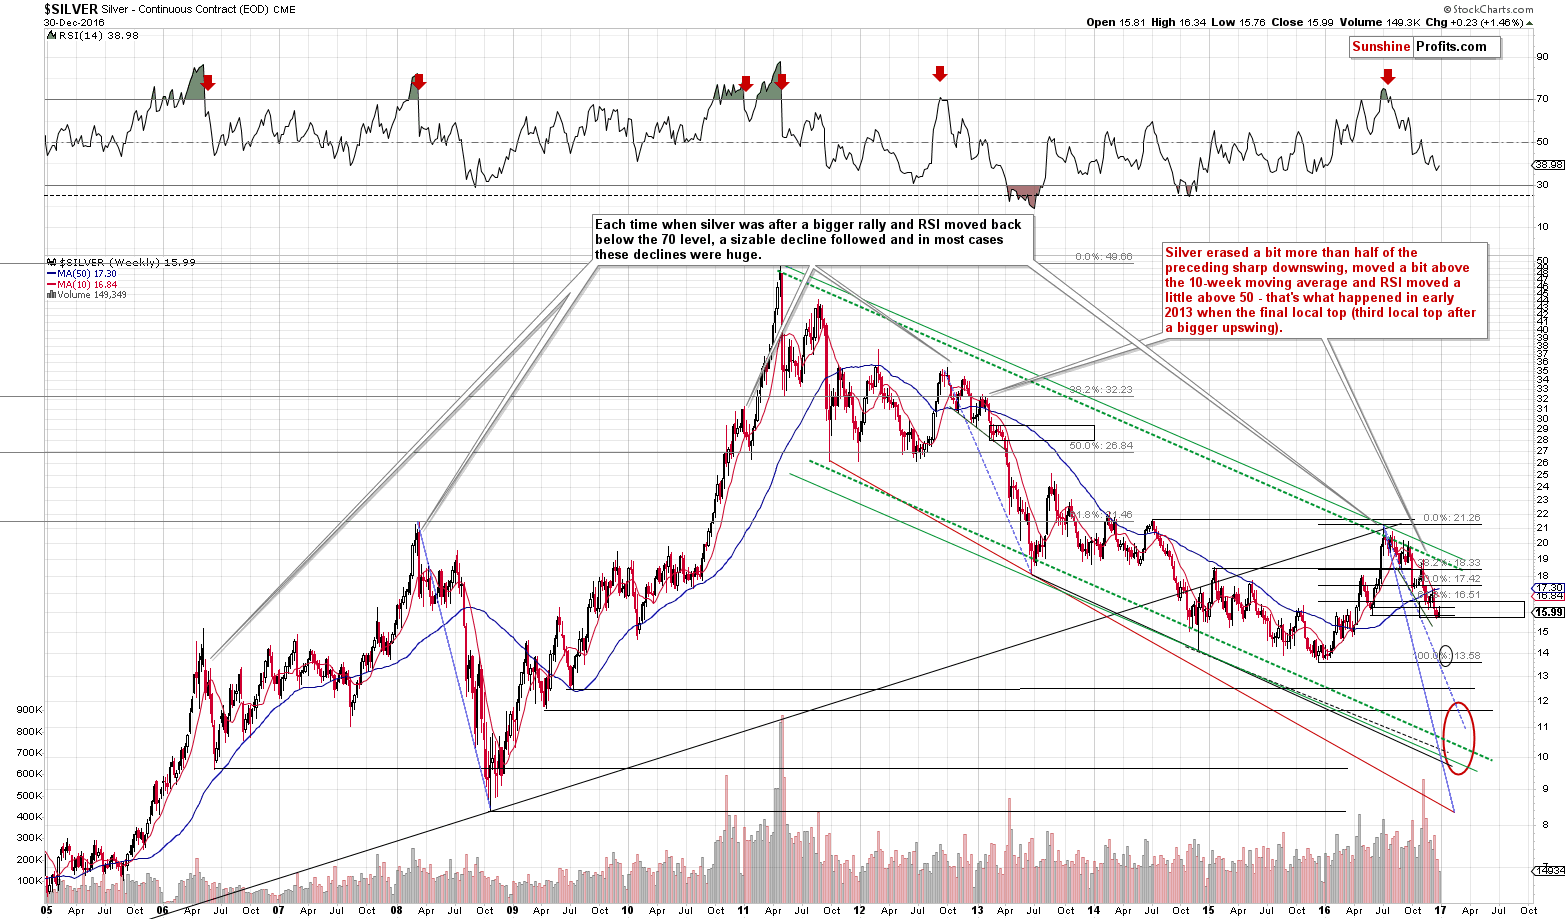
Silver erased a lot of its previous gains and finally ended the week below $16, only 23 cents higher than a week earlier. There was no invalidation of the breakdown below the previous 2016 low in terms of weekly closing prices and thus the implications remain bearish.
Silver could still move a bit higher in the next few days, but if it does, it doesn’t seem that it would move far. Our Friday’s comments on that matter remain up-to-date:
Silver’s chart has more implications that the one of gold. Let’s start with the possible (but not guaranteed, or even probable) short-term upside target. For silver it’s at about $16.50 – at its 61.8% Fibonacci retracement level (just like what we described for gold). In other words, it’s about $0.30 higher than the current price.
The above level is not only supported by the 61.8% Fibonacci retracement. It is also supported by the analogy to the 2013 decline (by the way, this analogy can be best seen on the above chart). We marked silver’s final consolidation before the big plunge with a black rectangle and we applied it to the current situation – it perfectly fits the target based on the 61.8% Fibonacci retracement.
Please note that the above target is based on the intra-day lows and intra-day highs and it could be imprecise (after all history doesn’t have to repeat itself to the letter, only more or less). So, the above could play out in a way that we will get silver 19 cents higher but only for a few seconds after which it plunges. The above is naturally not a prediction but an example of how risky a bet on a move to the 61.8% retracement would be.
Moreover, please note the alignment of the 10-week and 50-week moving averages. The red line moved below the blue one and the distance between them is increasing. During its final pause in 2013, silver didn’t reach the red line – instead it topped more or less after moving half of the distance between the bottom and the moving average. If the same happens also this time, it means that silver has either already topped today or that the top is only several cents away.
Also, please note that the value of the RSI indicator (and the shape of its decline) confirms that the analogy to the 2013 decline remains in place and we are indeed in the moment when silver is taking a breather for the final time before the big plunge. Based on the above, this doesn’t seem like a good moment to be waiting for additional confirmations before opening a short position (thus the one that we have appears to be well justified from the risk to reward point of view).
On Friday, we wrote the following:
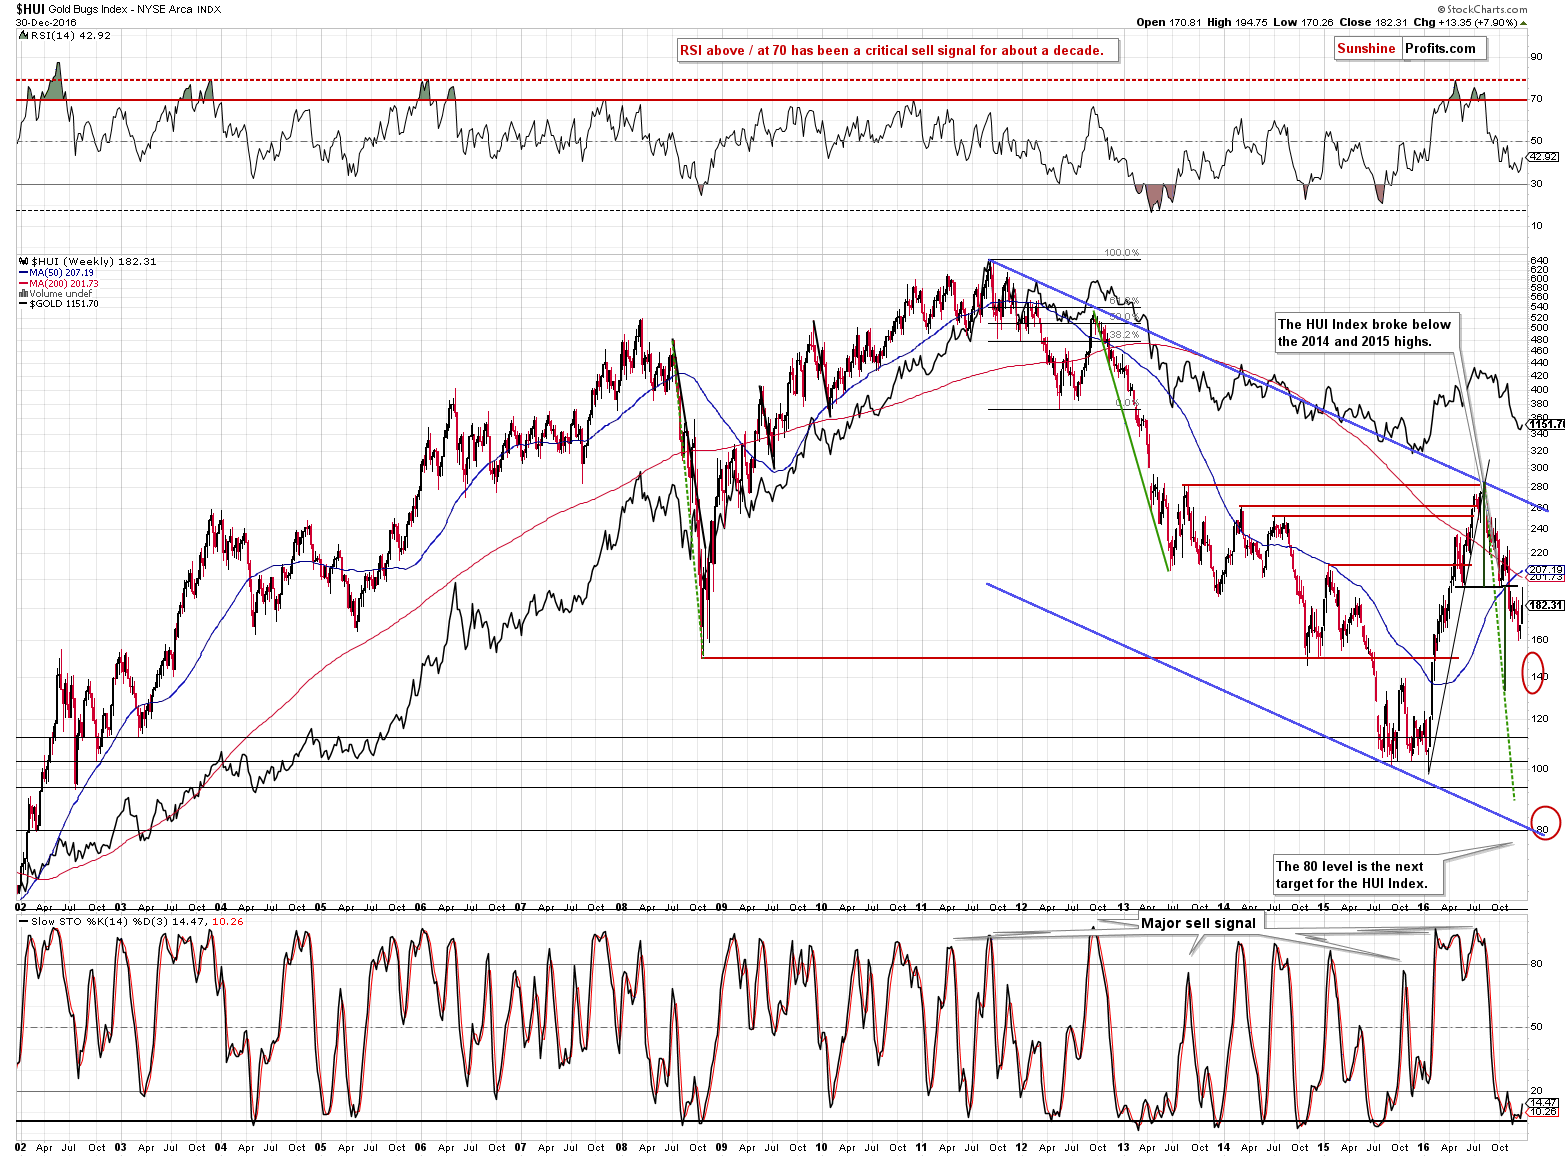
The HUI Index (proxy for gold stocks) appears to be verifying the breakdown below the head-and-shoulders pattern that it completed earlier this year.
It seems that this verification was already completed. Let’s zoom in for more details.
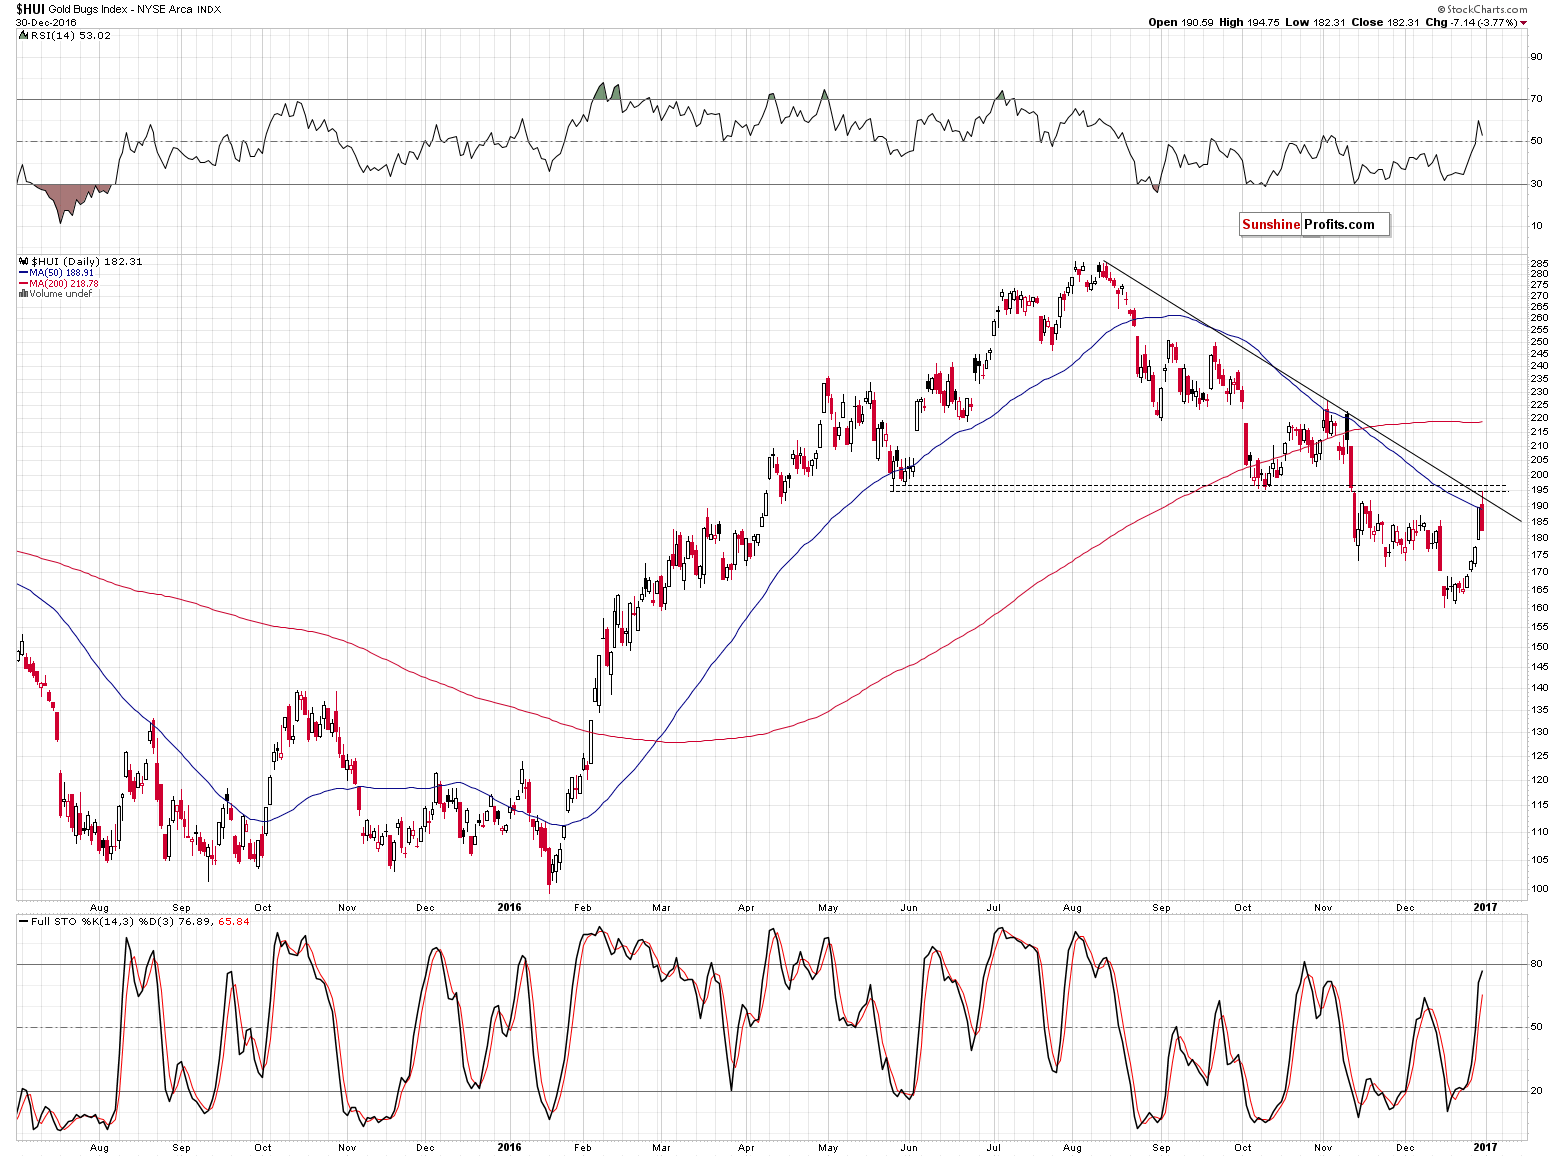
On Friday, we wrote the following:
Zooming in shows that the resistance created by the neck level of the formation is in the 194 – 198 range and the lower part of this range is also confirmed by the declining resistance line. Gold stocks have indeed moved higher recently, but their rally could be over (based on the 50-day moving average that was just reached) or almost over – based on the combination of the declining resistance line and the neck level of the head-and-shoulders formation.
The HUI Index indeed reversed right after it reached our target area – the intra-day high was 194.75. Friday’s session was very similar (small move above the 50-day moving average followed by an immediate reversal, while the previous session had taken the miners right to the moving average) to what we saw at the beginning of November. Back in November, this session marked the final top and was followed by a significant decline – the same appears to be likely also in the following weeks.
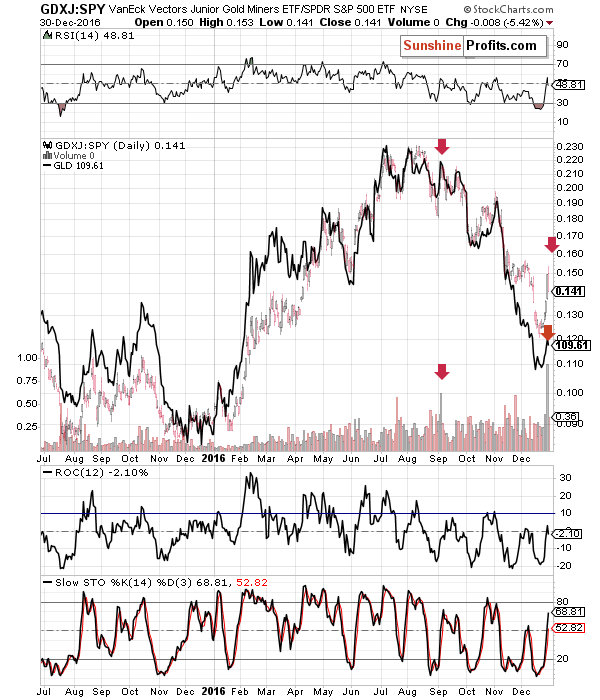
We saw another daily confirmation from the junior mining stocks and their relationship with other stocks. The volume of ratios between the GDXJ and SPY ETFs was extremely big during Thursday’s rally, which shows extreme emotions among precious metals investors. The emotions are at their highest during major tops and bottoms. At this time – since the preceding move was up – it seems that it confirms that the top is in. Please note that the same thing happened in early September when both the ratio and gold topped.
Finally, finance.yahoo.com posted quite a few articles on gold and mining stocks at the end of last week and they were bullish. This suggests (and high volume in juniors confirms it) that the general public entered the market and this, in turn, suggests that a top is in or at hand.
Summing up, it could be the case that gold, silver and mining stocks move a little higher before moving much lower, but it seems that entering short positions at this time should be considered, not exiting them. With very limited upside for the precious metals sector, a bearish medium-term outlook and a big sell sign from the currency market that we saw earlier today, it seems that short positions remain justified at this time, even in light of the possibility that we will see higher prices in this next few hours / days.
The most important thing, though, is that it doesn’t seem that the final bottom for the big decline in the precious metals is in and thus that one can still prepare for it.
On a side note, we received a few questions about stop-loss orders for DUST ETF that was reached (but it wasn’t reached for the GDX ETF) – the replies to these questions have been provided in each alert (we thought that this information was important enough to remind it in each alert) for many months. You will find details a few paragraphs below in the paragraph that begins with “Since it is impossible to synchronize target prices…”.
As always, we will keep you – our subscribers – updated.
To summarize:
Trading capital (supplementary part of the portfolio; our opinion): Short positions (150% of the full position) in gold, silver and mining stocks are justified from the risk/reward perspective with the following stop-loss orders and initial target price levels / profit-take orders:
- Gold: exit-profit-take level: $1,063; stop-loss: $1,183; initial target price for the DGLD ETN: $81.88; stop-loss for the DGLD ETN $58.77
- Silver: initial target price: $13.12; stop-loss: $17.53; initial target price for the DSLV ETN: $46.18; stop-loss for the DSLV ETN $24.86
- Mining stocks (price levels for the GDX ETF): initial target price: $9.34; stop-loss: $23.32; initial target price for the DUST ETF: $143.56; stop-loss for the DUST ETF $34.40
In case one wants to bet on junior mining stocks' prices (we do not suggest doing so – we think senior mining stocks are more predictable in the case of short-term trades – if one wants to do it anyway, we provide the details), here are the stop-loss details and initial target prices:
- GDXJ ETF: initial target price: $14.13; stop-loss: $37.12
- JDST ETF: initial target price: $104.26; stop-loss: $20.86
Long-term capital (core part of the portfolio; our opinion): No positions (in other words: cash)
Insurance capital (core part of the portfolio; our opinion): Full position
Please note that the in the trading section we describe the situation for the day that the alert is posted. In other words, it we are writing about a speculative position, it means that it is up-to-date on the day it was posted. We are also featuring the initial target prices, so that you can decide whether keeping a position on a given day is something that is in tune with your approach (some moves are too small for medium-term traders and some might appear too big for day-traders).
Plus, you might want to read why our stop-loss orders are usually relatively far from the current price.
Please note that a full position doesn’t mean using all of the capital for a given trade. You will find details on our thoughts on gold portfolio structuring in the Key Insights section on our website.
As a reminder – “initial target price” means exactly that – an “initial” one, it’s not a price level at which we suggest closing positions. If this becomes the case (like it did in the previous trade) we will refer to these levels as levels of exit orders (exactly as we’ve done previously). Stop-loss levels, however, are naturally not “initial”, but something that, in our opinion, might be entered as an order.
Since it is impossible to synchronize target prices and stop-loss levels for all the ETFs and ETNs with the main markets that we provide these levels for (gold, silver and mining stocks – the GDX ETF), the stop-loss levels and target prices for other ETNs and ETF (among other: UGLD, DGLD, USLV, DSLV, NUGT, DUST, JNUG, JDST) are provided as supplementary, and not as “final”. This means that if a stop-loss or a target level is reached for any of the “additional instruments” (DGLD for instance), but not for the “main instrument” (gold in this case), we will view positions in both gold and DGLD as still open and the stop-loss for DGLD would have to be moved lower. On the other hand, if gold moves to a stop-loss level but DGLD doesn’t, then we will view both positions (in gold and DGLD) as closed. In other words, since it’s not possible to be 100% certain that each related instrument moves to a given level when the underlying instrument does, we can’t provide levels that would be binding. The levels that we do provide are our best estimate of the levels that will correspond to the levels in the underlying assets, but it will be the underlying assets that one will need to focus on regarding the signs pointing to closing a given position or keeping it open. We might adjust the levels in the “additional instruments” without adjusting the levels in the “main instruments”, which will simply mean that we have improved our estimation of these levels, not that we changed our outlook on the markets. We are already working on a tool that would update these levels on a daily basis for the most popular ETFs, ETNs and individual mining stocks.
Our preferred ways to invest in and to trade gold along with the reasoning can be found in the how to buy gold section. Additionally, our preferred ETFs and ETNs can be found in our Gold & Silver ETF Ranking.
As always, we'll keep you - our subscribers - updated should our views on the market change. We will continue to send out Gold & Silver Trading Alerts on each trading day and we will send additional Alerts whenever appropriate.
The trading position presented above is the netted version of positions based on subjective signals (opinion) from your Editor, and the Tools and Indicators.
As a reminder, Gold & Silver Trading Alerts are posted before or on each trading day (we usually post them before the opening bell, but we don't promise doing that each day). If there's anything urgent, we will send you an additional small alert before posting the main one.
=====
Latest Free Trading Alerts:
Some analysts say that gold is oversold. Others claim that gold has not established a bottom yet. Which fundamentals support which outcome?
What Factors Point to Higher/Lower Gold Prices?
S&P 500 index continued its short-term downtrend on Friday, as it broke slightly below 2,250 mark. However, stocks are set to open much higher today following global stock markets' rally. Will stocks retrace its recent decline today? Is holding short position still justified?
Stock Trading Alert: Positive Expectations Following Global Stock Markets' Rally
=====
Hand-picked precious-metals-related links:
PRECIOUS-Gold slips as strong dollar keeps up pressure on prices
Commodities Set For A Comeback In 2017, With One Exception
=====
In other news:
Dollar, global stocks firm as 2017 trading starts in earnest
Fed Minutes May Shed Light on Rate Outlook, Fiscal Policy Risks
German inflation expected to more than double in December, giving boost to ECB
Oil hits 18-month highs as markets eye output cuts
It’s the ‘Most Volatile’ Year for Political Risk Since WWII, Eurasia Says
Will Donald Trump's election put America first and global conflict next?
China Caixin manufacturing PMI climbs to 51.9 in December, fastest improvement since January 2013
UK manufacturing growth unexpectedly hits 2-1/2-year high: PMI
German unemployment falls more than expected in December
Global Bank Regulators Delay Key Meeting on Capital Rule Revamp
=====
Thank you.
Sincerely,
Przemyslaw Radomski, CFA
Founder, Editor-in-chief, Gold & Silver Fund Manager
Gold & Silver Trading Alerts
Forex Trading Alerts
Oil Investment Updates
Oil Trading Alerts

