

Briefly: In our opinion, full (150% of the regular full position) speculative short positions in gold, silver and mining stocks are justified from the risk/reward perspective.
The precious metals sector moved visibly higher yesterday and mining stocks even rallied on huge volume. Are we about to see another powerful rally just like we saw it in January 2016?
In short, that doesn’t appear very likely. We could see some short-term strength, but anything more than that is unlikely. Let’s take a closer look at the charts (charts courtesy of http://stockcharts.com). Please note that there are quite a few of them that we would like to discuss today and at the same time we would like to send this analysis to you as soon as possible, so the descriptions below each chart will be rather brief.
Let’s start with a major development that is not getting enough attention among the precious metals analysts and investors.
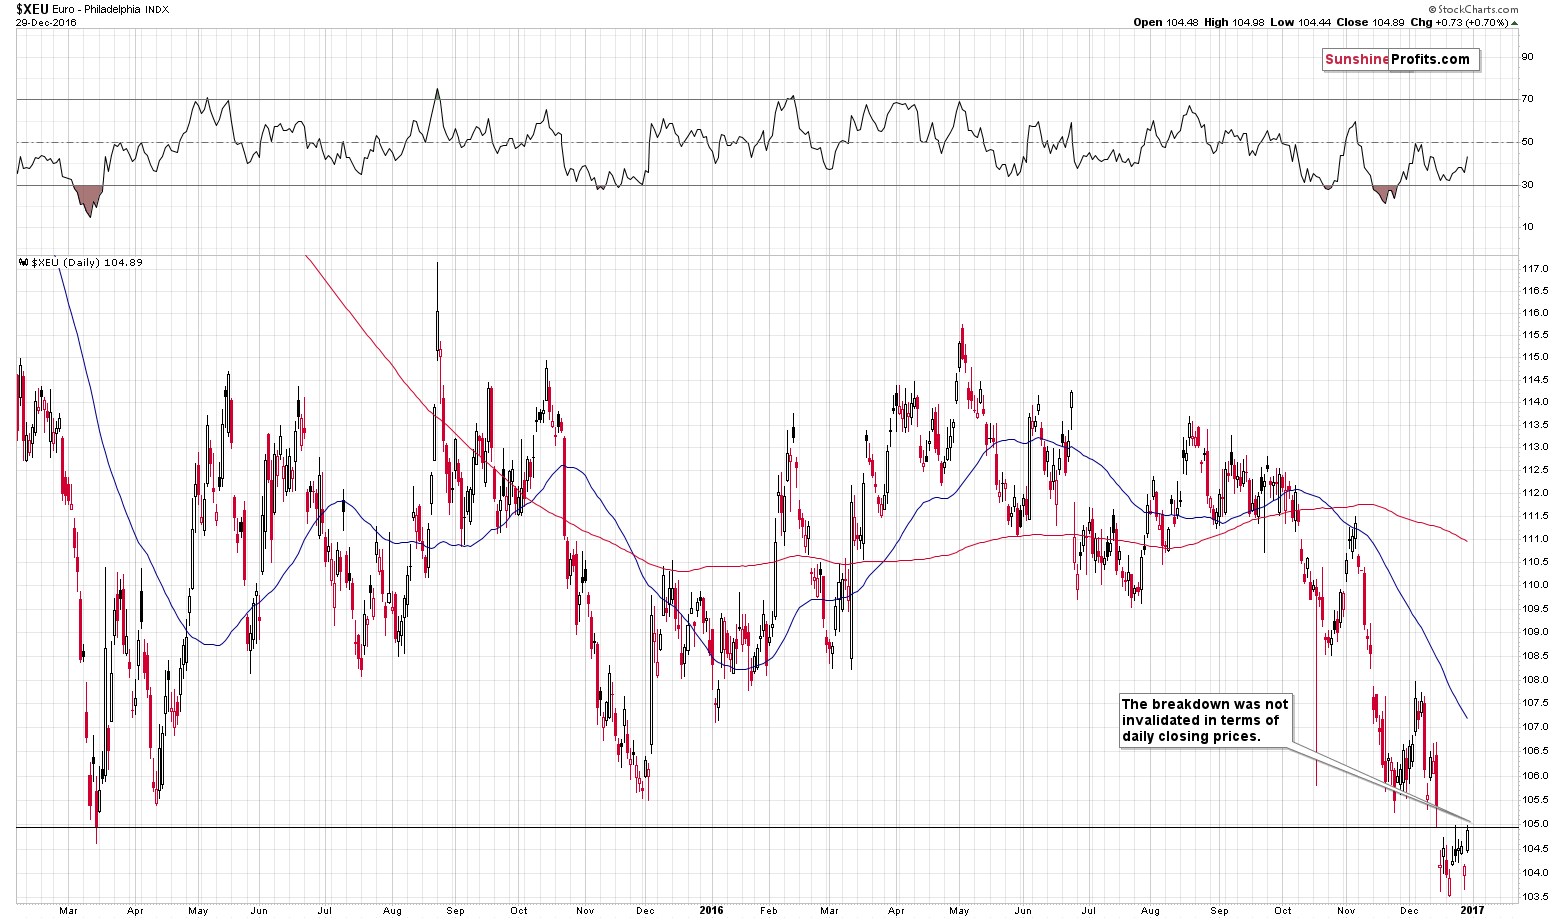
The breakdown in EUR/USD was almost invalidated. The key word here is “almost” – it was NOT invalidated in terms of daily / weekly closing prices and thus this week’s move higher is nothing more than just a verification of the previous breakdown. The implications remain very bearish for the coming weeks and months. They are also bearish for the coming days as the resistance created by the March 2015 low is very close.
The implications of the above are bearish for the precious metals sector.
Please note that today’s pre-market action (quick rally followed by a decline) in the EUR/USD and the USD Index doesn’t invalidate the above.
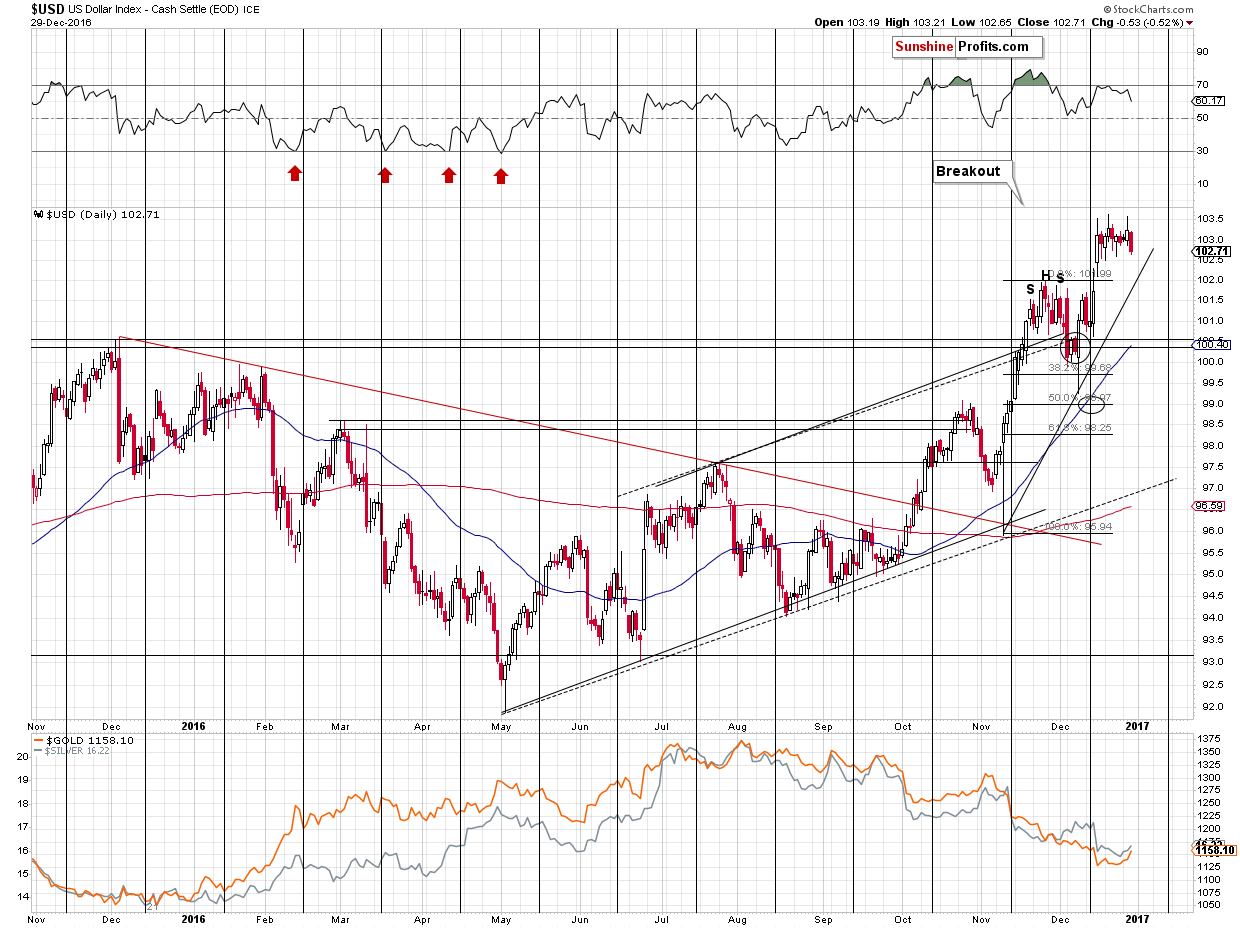
What happened today is that the USD Index moved slightly below the 102 level and moved back up, being at 102.25 at the moment of writing these words. This means that the USD Index already moved back to combination of its support levels – the November high and the rising support line. It is not bullish by itself. It is bullish because the last 2 times that we saw these reversals (Dec. 8 and Nov. 9) marked major short-term bottoms in the USD Index and local tops (as well as excellent shorting opportunities) in precious metals.
The implications are bearish and – more importantly – more bearish than they were just a few days ago.
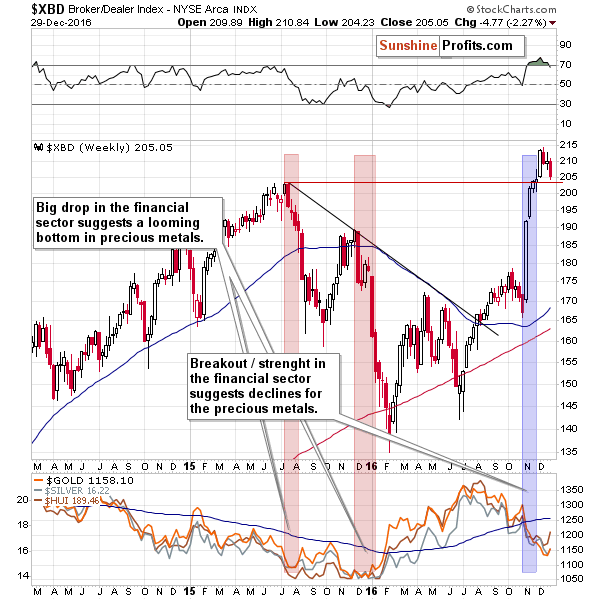
Another major, yet mostly unknown, relationship is the one between precious metals and the financial sector. A top in financials corresponded to a bottom in PMs and a bottom (the mid-2016 one) in financials corresponded to a top in PMs. In the past few weeks, financials pulled back after moving above their 2015 high and PMs moved a bit higher. The key thing here is that the breakout in financials was not invalidated and thus they are likely to rally once again. In fact, the pullback seems to have made another big upswing possible. The opposite is likely to be the case for PMs so the implications for them are bearish.
The proximity of the support for financials suggests that the rally in PMs may not have much farther to go up before turning south.
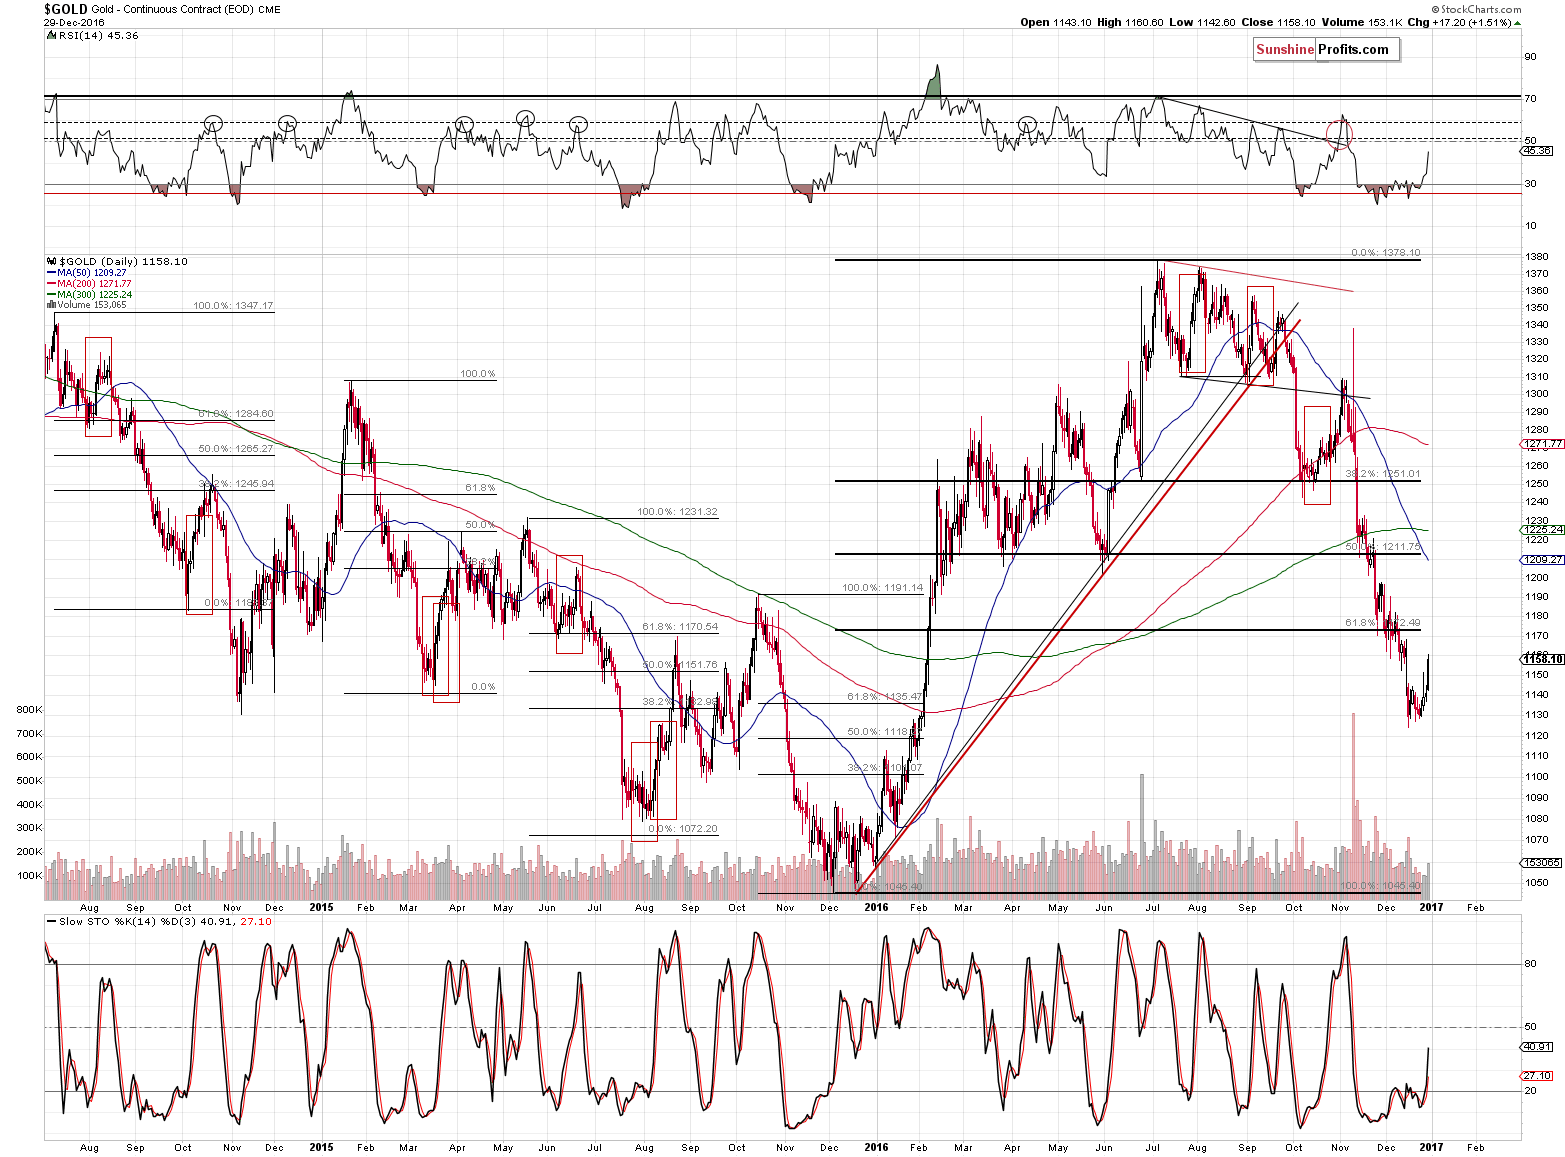
The gold chart shows that the volume that accompanied the upswing was not huge, but it was not tiny either, which has little implications, overall. What’s important is that the next resistance that would likely stop gold is at the previously broken 61.8% Fibonacci retracement level – at about $1,172.5. This means that gold could move another $15 higher or so before it reverses.
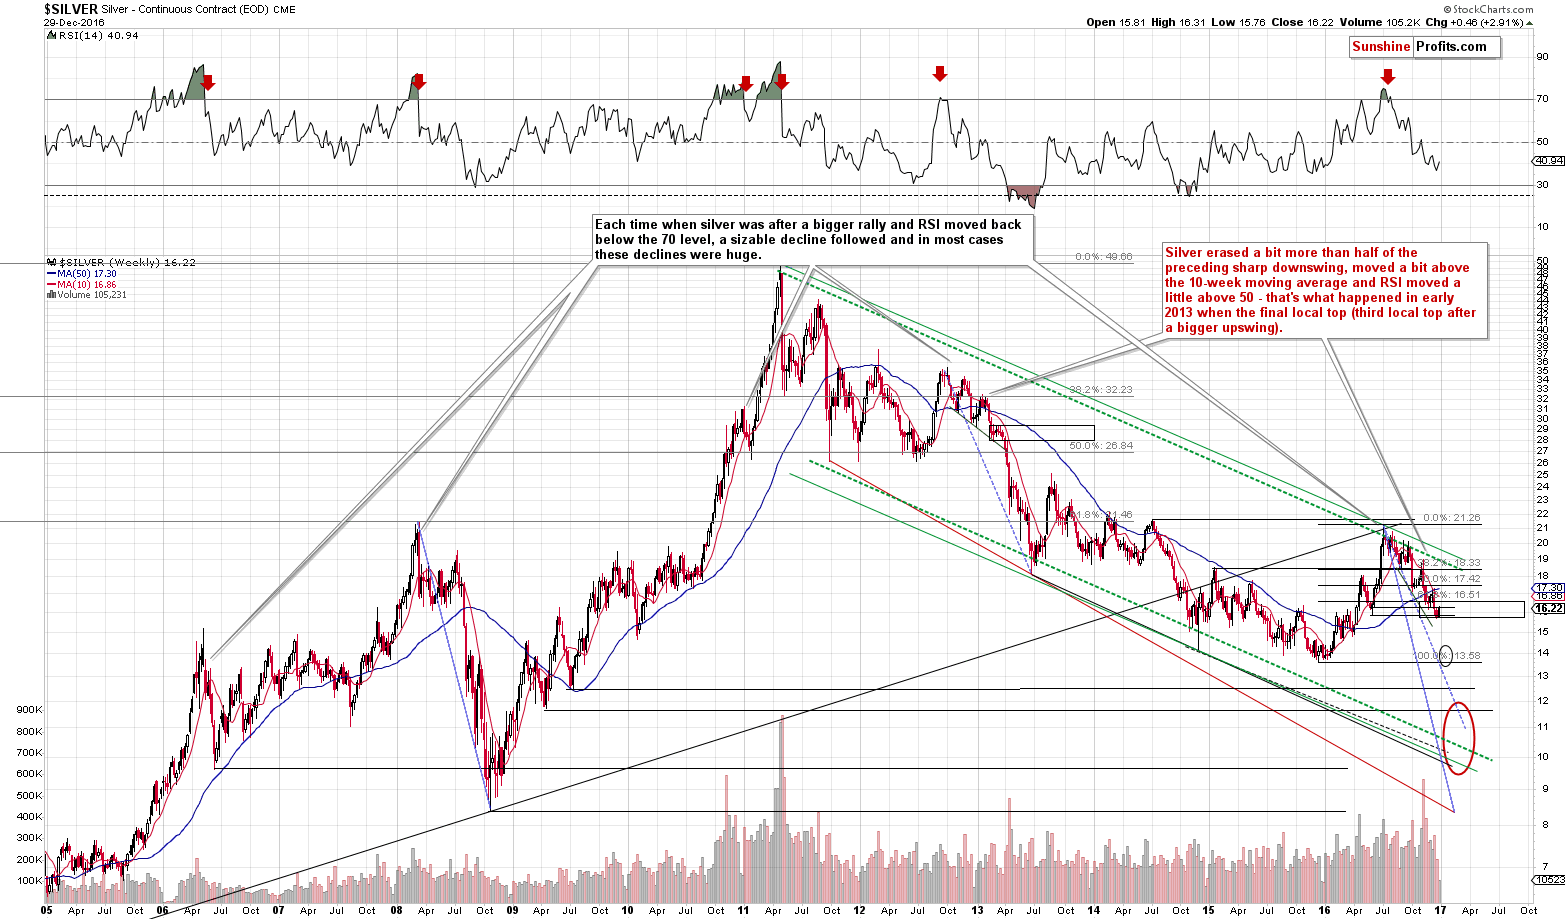
Silver’s chart has more implications that the one of gold. Let’s start with the possible (but not guaranteed, or even probable) short-term upside target. For silver it’s at about $16.50 – at its 61.8% Fibonacci retracement level (just like what we described for gold). In other words, it’s about $0.30 higher than the current price.
The above level is not only supported by the 61.8% Fibonacci retracement. It is also supported by the analogy to the 2013 decline (by the way, this analogy can be best seen on the above chart). We marked silver’s final consolidation before the big plunge with a black rectangle and we applied it to the current situation – it perfectly fits the target based on the 61.8% Fibonacci retracement.
Please note that the above target is based on the intra-day lows and intra-day highs and it could be imprecise (after all history doesn’t have to repeat itself to the letter, only more or less). So, the above could play out in a way that we will get silver 19 cents higher but only for a few seconds after which it plunges. The above is naturally not a prediction but an example of how risky a bet on a move to the 61.8% retracement would be.
Moreover, please note the alignment of the 10-week and 50-week moving averages. The red line moved below the blue one and the distance between them is increasing. During its final pause in 2013, silver didn’t reach the red line – instead it topped more or less after moving half of the distance between the bottom and the moving average. If the same happens also this time, it means that silver has either already topped today or that the top is only several cents away.
Also, please note that the value of the RSI indicator (and the shape of its decline) confirms that the analogy to the 2013 decline remains in place and we are indeed in the moment when silver is taking a breather for the final time before the big plunge. Based on the above, this doesn’t seem like a good moment to be waiting for additional confirmations before opening a short position (thus the one that we have appears to be well justified from the risk to reward point of view).
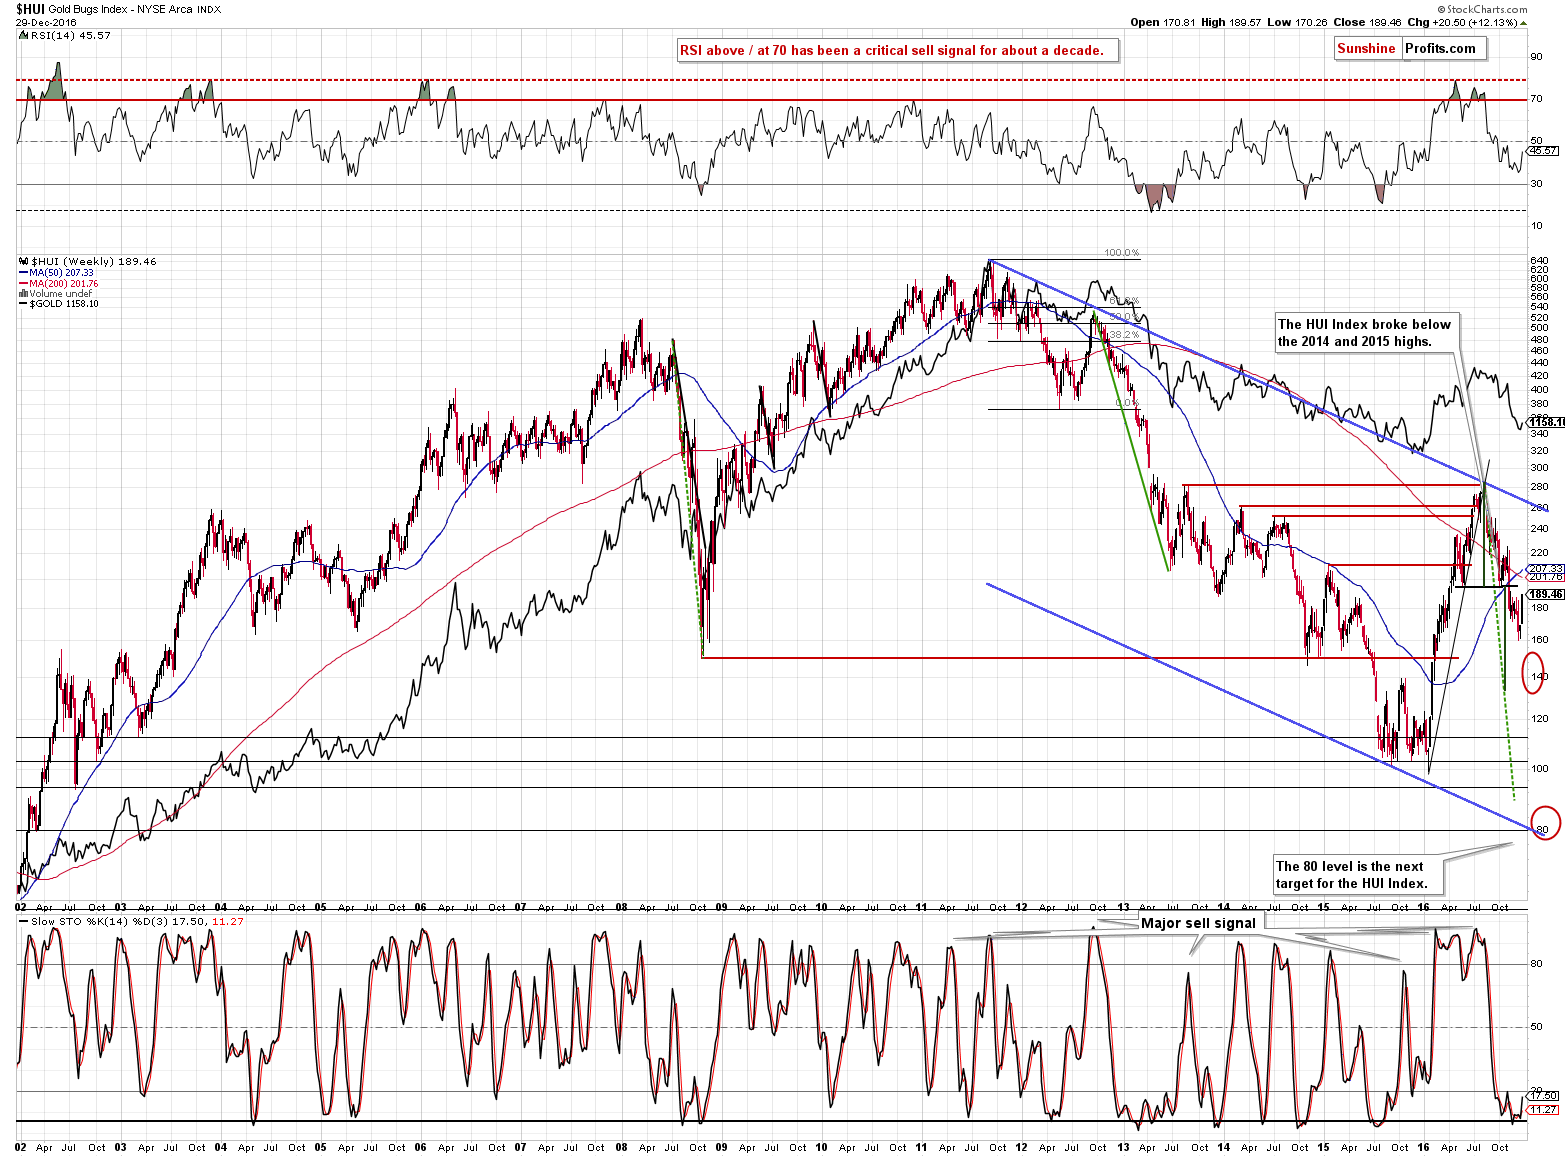
The HUI Index (proxy for gold stocks) appears to be verifying the breakdown below the head-and-shoulders pattern that it completed earlier this year.
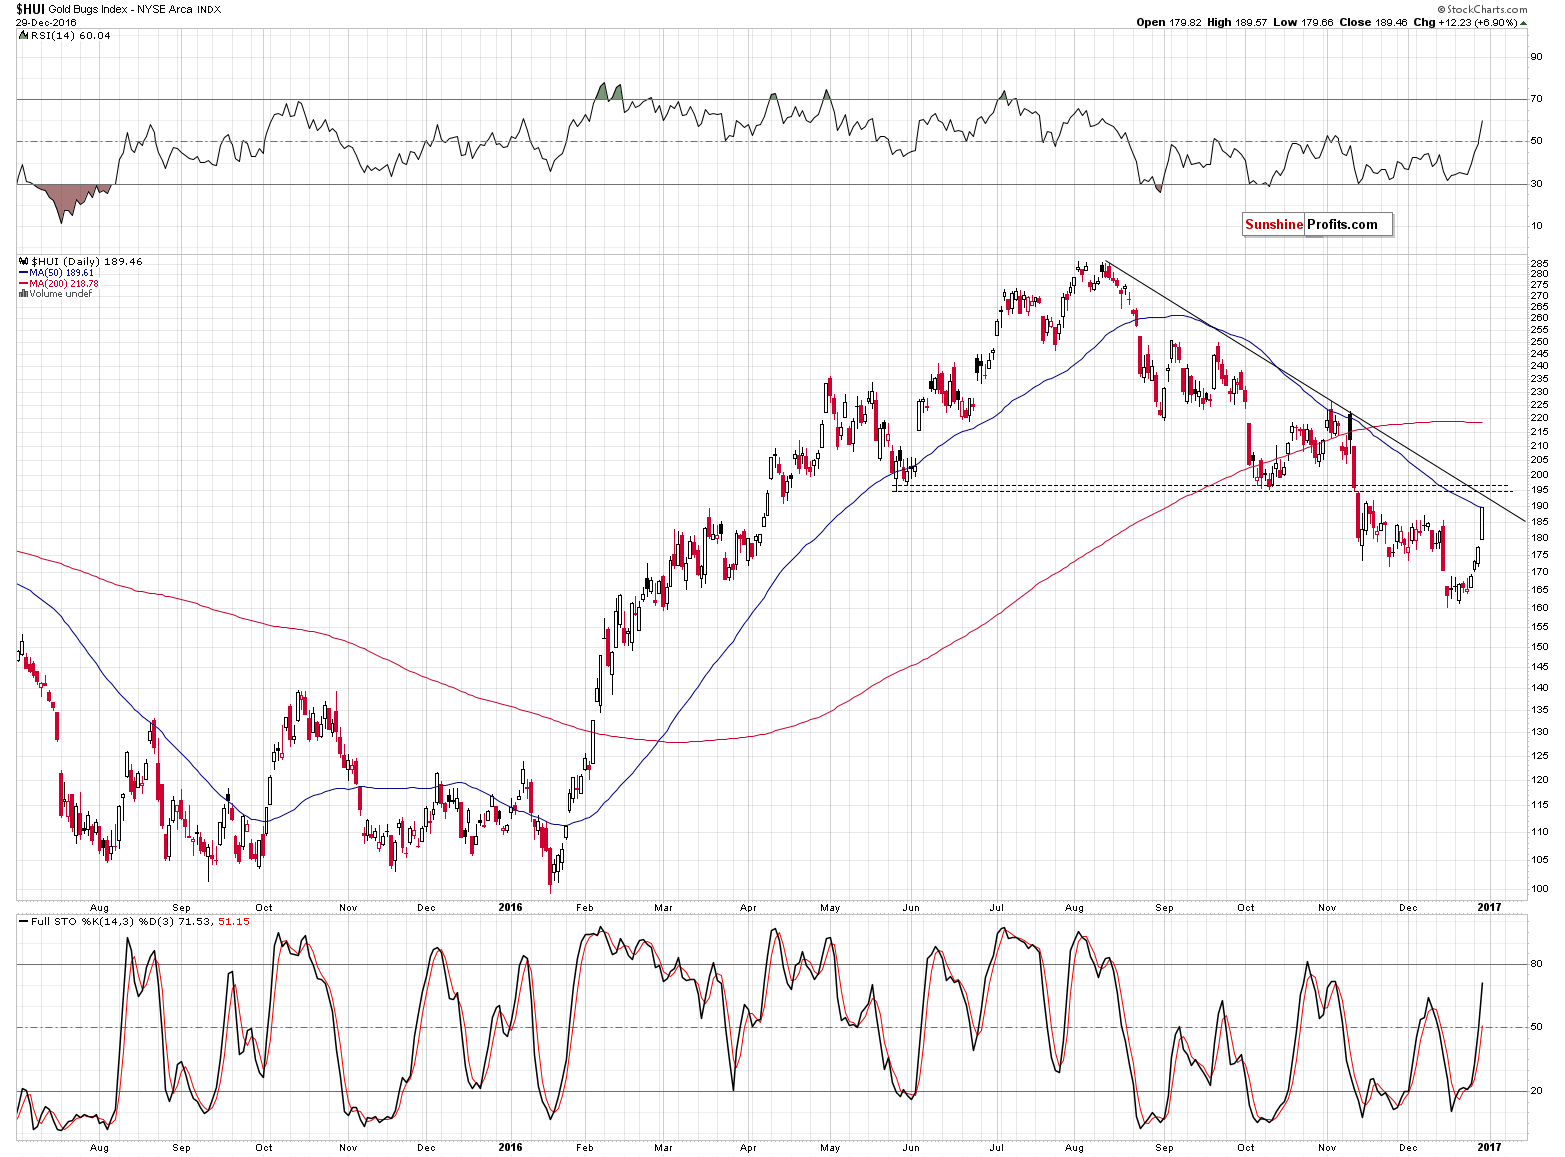
Zooming in shows that the resistance created by the neck level of the formation is in the 194 – 198 range and the lower part of this range is also confirmed by the declining resistance line. Gold stocks have indeed moved higher recently, but their rally could be over (based on the 50-day moving average that was just reached) or almost over – based on the combination of the declining resistance line and the neck level of the head-and-shoulders formation.
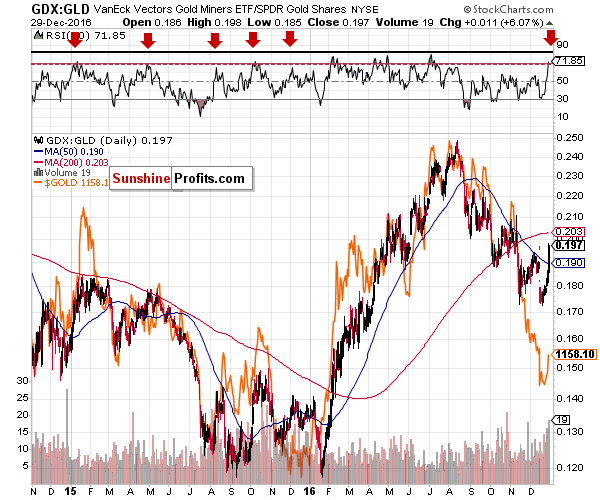
Relative performance of mining stocks vs. gold shows that the top might indeed be at hand. The RSI indicator based on the ratio moved close to the 70 level, which marked local tops in almost all cases in 2015 when miners were in a major downtrend. The above technique didn’t work in the first half of 2016, but it doesn’t seem that this half of the year is similar to it and thus it could be the case that the RSI’s signal will have the same – or similar – effect like in 2015.
Summing up, it could be the case that gold, silver and mining stocks move a little higher before moving much lower, but it seems that entering short positions at this time should be considered, not exiting them. With limited upside for the precious metals sector, a bearish medium-term outlook and a big sell sign from the currency market that we saw earlier today, it seems that short positions remain justified at this time, even in light of the possibility that we will see higher prices in this next few hours / days (note the example provided between the silver chart and the HUI chart). At the same time, we are moving the stop-loss levels for mining stocks a bit higher (so that the move to the target area for the HUI Index doesn’t close the position).
As always, we will keep you – our subscribers – updated.
To summarize:
Trading capital (supplementary part of the portfolio; our opinion): Short positions (150% of the full position) in gold, silver and mining stocks are justified from the risk/reward perspective with the following stop-loss orders and initial target price levels / profit-take orders:
- Gold: exit-profit-take level: $1,063; stop-loss: $1,183; initial target price for the DGLD ETN: $81.88; stop-loss for the DGLD ETN $58.77
- Silver: initial target price: $13.12; stop-loss: $17.53; initial target price for the DSLV ETN: $46.18; stop-loss for the DSLV ETN $24.86
- Mining stocks (price levels for the GDX ETF): initial target price: $9.34; stop-loss: $23.32; initial target price for the DUST ETF: $143.56; stop-loss for the DUST ETF $34.40
In case one wants to bet on junior mining stocks' prices (we do not suggest doing so – we think senior mining stocks are more predictable in the case of short-term trades – if one wants to do it anyway, we provide the details), here are the stop-loss details and initial target prices:
- GDXJ ETF: initial target price: $14.13; stop-loss: $37.12
- JDST ETF: initial target price: $104.26; stop-loss: $20.86
Long-term capital (core part of the portfolio; our opinion): No positions (in other words: cash)
Insurance capital (core part of the portfolio; our opinion): Full position
Please note that the in the trading section we describe the situation for the day that the alert is posted. In other words, it we are writing about a speculative position, it means that it is up-to-date on the day it was posted. We are also featuring the initial target prices, so that you can decide whether keeping a position on a given day is something that is in tune with your approach (some moves are too small for medium-term traders and some might appear too big for day-traders).
Plus, you might want to read why our stop-loss orders are usually relatively far from the current price.
Please note that a full position doesn’t mean using all of the capital for a given trade. You will find details on our thoughts on gold portfolio structuring in the Key Insights section on our website.
As a reminder – “initial target price” means exactly that – an “initial” one, it’s not a price level at which we suggest closing positions. If this becomes the case (like it did in the previous trade) we will refer to these levels as levels of exit orders (exactly as we’ve done previously). Stop-loss levels, however, are naturally not “initial”, but something that, in our opinion, might be entered as an order.
Since it is impossible to synchronize target prices and stop-loss levels for all the ETFs and ETNs with the main markets that we provide these levels for (gold, silver and mining stocks – the GDX ETF), the stop-loss levels and target prices for other ETNs and ETF (among other: UGLD, DGLD, USLV, DSLV, NUGT, DUST, JNUG, JDST) are provided as supplementary, and not as “final”. This means that if a stop-loss or a target level is reached for any of the “additional instruments” (DGLD for instance), but not for the “main instrument” (gold in this case), we will view positions in both gold and DGLD as still open and the stop-loss for DGLD would have to be moved lower. On the other hand, if gold moves to a stop-loss level but DGLD doesn’t, then we will view both positions (in gold and DGLD) as closed. In other words, since it’s not possible to be 100% certain that each related instrument moves to a given level when the underlying instrument does, we can’t provide levels that would be binding. The levels that we do provide are our best estimate of the levels that will correspond to the levels in the underlying assets, but it will be the underlying assets that one will need to focus on regarding the signs pointing to closing a given position or keeping it open. We might adjust the levels in the “additional instruments” without adjusting the levels in the “main instruments”, which will simply mean that we have improved our estimation of these levels, not that we changed our outlook on the markets. We are already working on a tool that would update these levels on a daily basis for the most popular ETFs, ETNs and individual mining stocks.
Our preferred ways to invest in and to trade gold along with the reasoning can be found in the how to buy gold section. Additionally, our preferred ETFs and ETNs can be found in our Gold & Silver ETF Ranking.
As always, we'll keep you - our subscribers - updated should our views on the market change. We will continue to send out Gold & Silver Trading Alerts on each trading day and we will send additional Alerts whenever appropriate.
The trading position presented above is the netted version of positions based on subjective signals (opinion) from your Editor, and the Tools and Indicators.
As a reminder, Gold & Silver Trading Alerts are posted before or on each trading day (we usually post them before the opening bell, but we don't promise doing that each day). If there's anything urgent, we will send you an additional small alert before posting the main one.
=====
Latest Free Trading Alerts:
2016 comes to an end. Now, the question is what the next year will be like?
=====
Hand-picked precious-metals-related links:
Gold Lures Investors Worried About Trade Wars and Trump Tweets
Can Chinese PMGs demand continue to grow in 2017?
=====
In other news:
Euro Jumps 1.6 Percent in Minutes as Algo Orders Surprise Market
Draghi Set for Inflation Boost That May Not Be All He Needs
China central bank says to keep policy neutral, liquidity stable
Modi Set to Face Fallout From His 50-Day Cash Promise to India
Oil Market Seen as Surprise Haven From Political Risk in 2017
Putin Rejects Tit-for-Tat Expulsion Before Trump Takes Power
The best (and worst) stock markets of 2016
=====
Thank you.
Sincerely,
Przemyslaw Radomski, CFA
Founder, Editor-in-chief, Gold & Silver Fund Manager
Gold & Silver Trading Alerts
Forex Trading Alerts
Oil Investment Updates
Oil Trading Alerts

