

Briefly: In our opinion, regular (100% of the full position) speculative long positions in gold, silver and mining stocks are justified from the risk/reward perspective.
The USD Index declined visibly yesterday and gold didn’t respond by rallying. It may seem that gold’s inaction was bearish as it failed to rally while the USD declined, but let’s keep in mind that it was yet another day during which gold moved very briefly below the 61.8% Fibonacci retracement and it managed to invalidate the breakdown shortly thereafter. What are the overall implications?
In short, in our opinion, they are still bullish. Let’s take a look at the charts for details (charts courtesy of http://stockcharts.com).
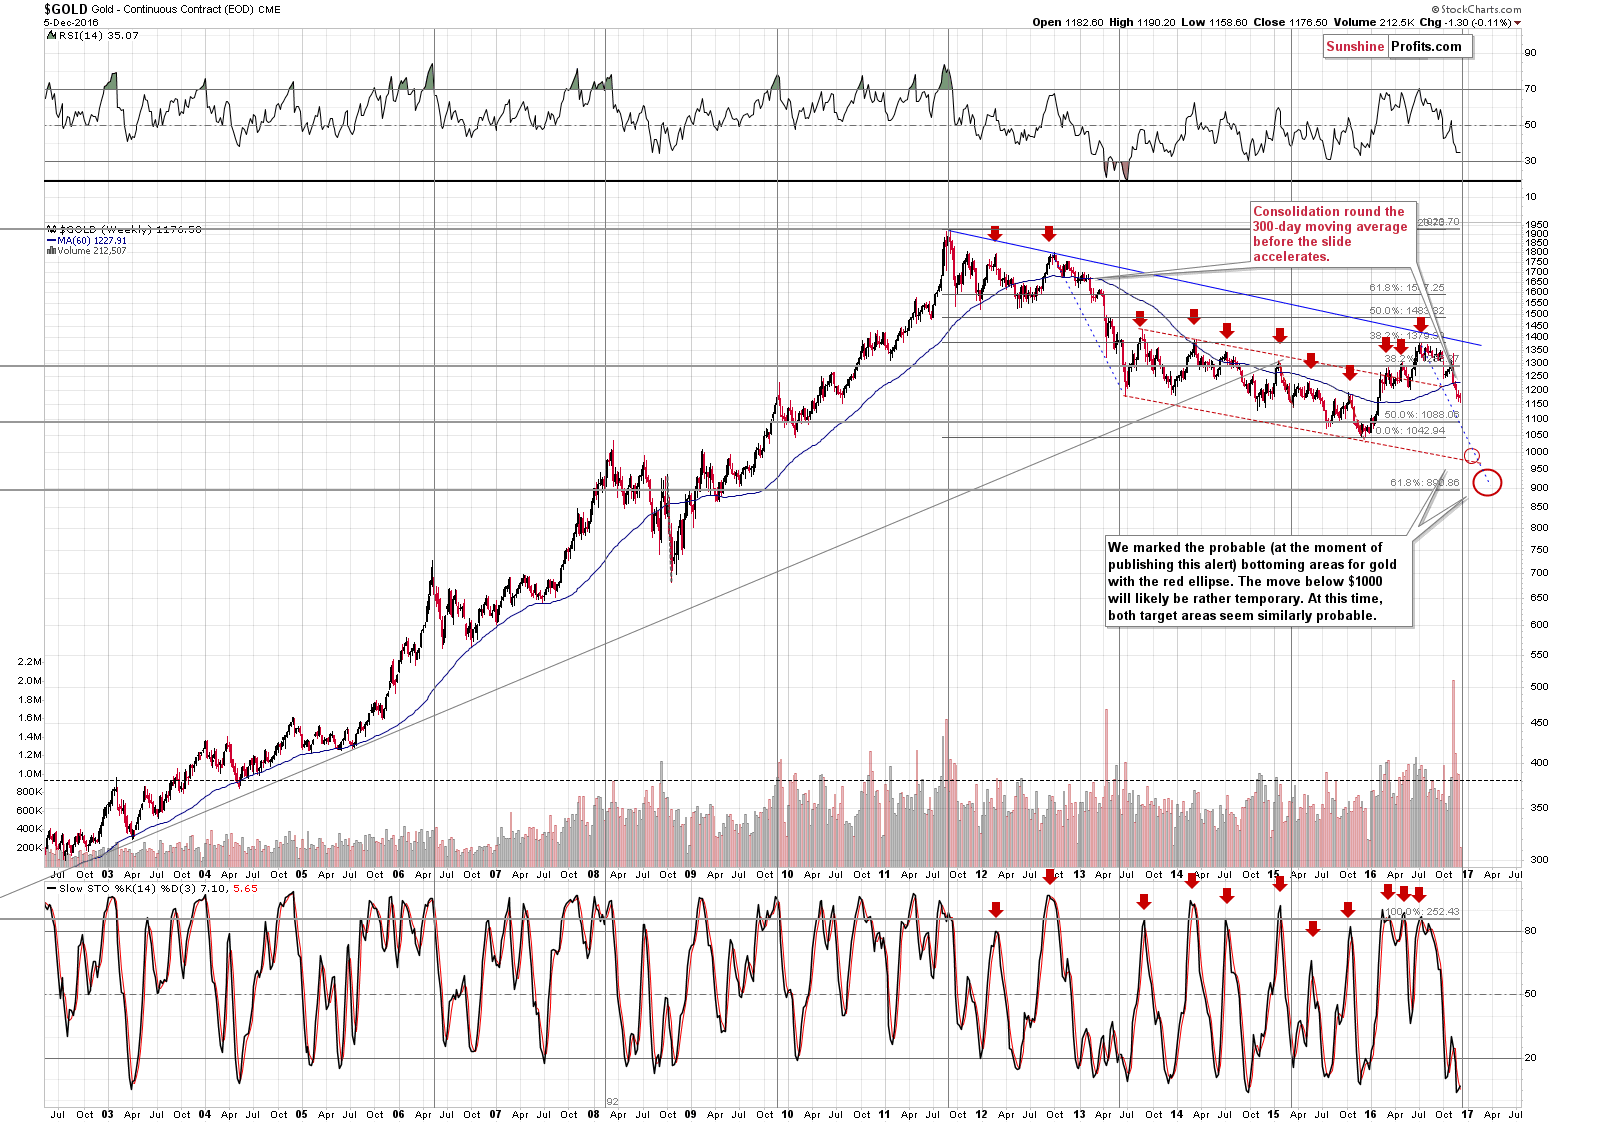
The long-term chart has exactly the same implications as it did yesterday:
As we discussed above, not much happened in gold on a weekly basis, but we can see something significant on the above chart – the proximity of the long-term turning point in gold. Is it likely to market a major bottom for gold? That’s certainly possible, but let’s keep in mind that the turning points work on a near-to basis, and since it is the long-term chart that we discuss, the near-to could be a month or a few of them. This doesn’t help us with the short-term outlook by itself, but it does confirm that one should be preparing for the final bottom in the precious metals in the following months.
As far as short-term implications are concerned, we can say that a bounce here is quite possible based on the above chart especially that the current move continues to be similar to what we saw in early 2013 (which also was before the turning point). Back in 2013, the final short-term bounce before the big, volatile decline was seen shortly after gold broke below the 300-day moving average. This happened recently and thus it now seems that a corrective upswing – probably the final one before the big drop – will be seen shortly. The fact that the RSI is currently at more or less the same level as it was when the local bottom was formed back in 2013 makes the mentioned scenario more likely.
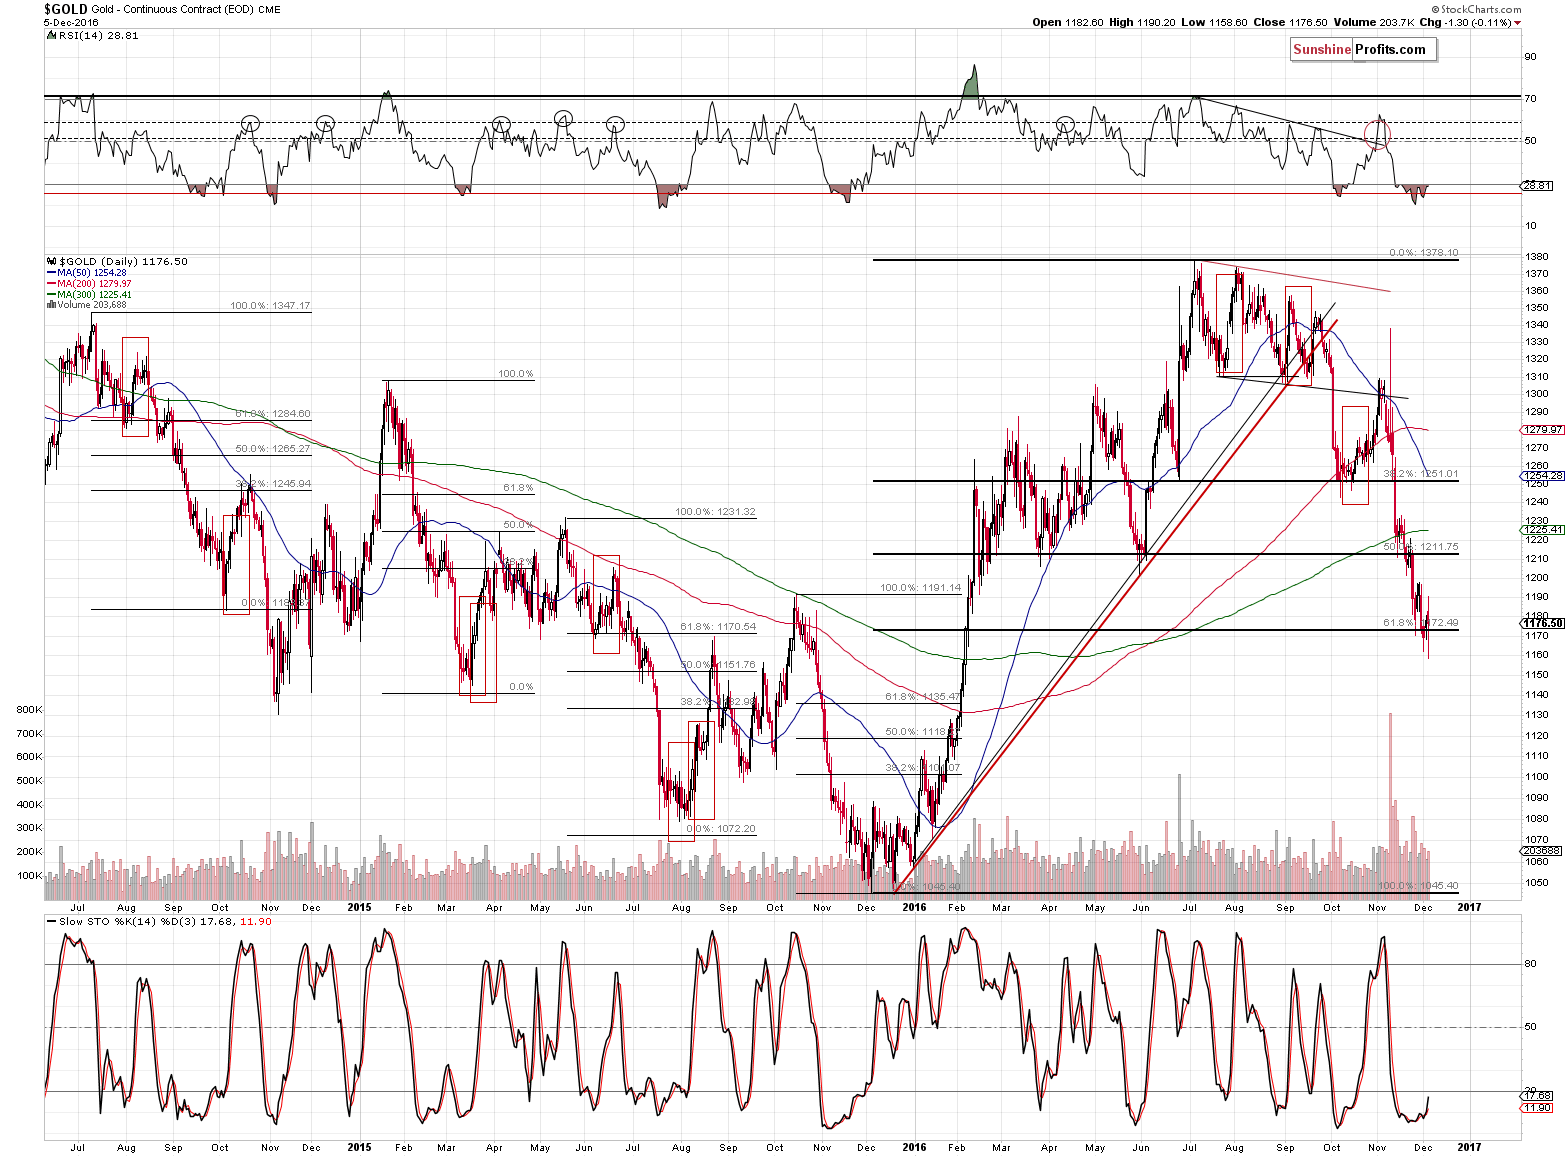
As we discussed earlier, gold once again invalidated its breakdown below the 61.8% Fibonacci retracement level. Invalidations of breakdowns are generally bullish and this time doesn’t seem to be any different.
Please note that just because gold hasn’t rallied so far, doesn’t make a rally unlikely. The May-June 2016 bottom and the October 2016 bottom took even more time – gold still rallied quite visibly thereafter. The July-August 2015 bottom took even more time before the corrective rally started.
Besides, even though the rally in gold hasn’t started yet, silver is slowly moving higher.
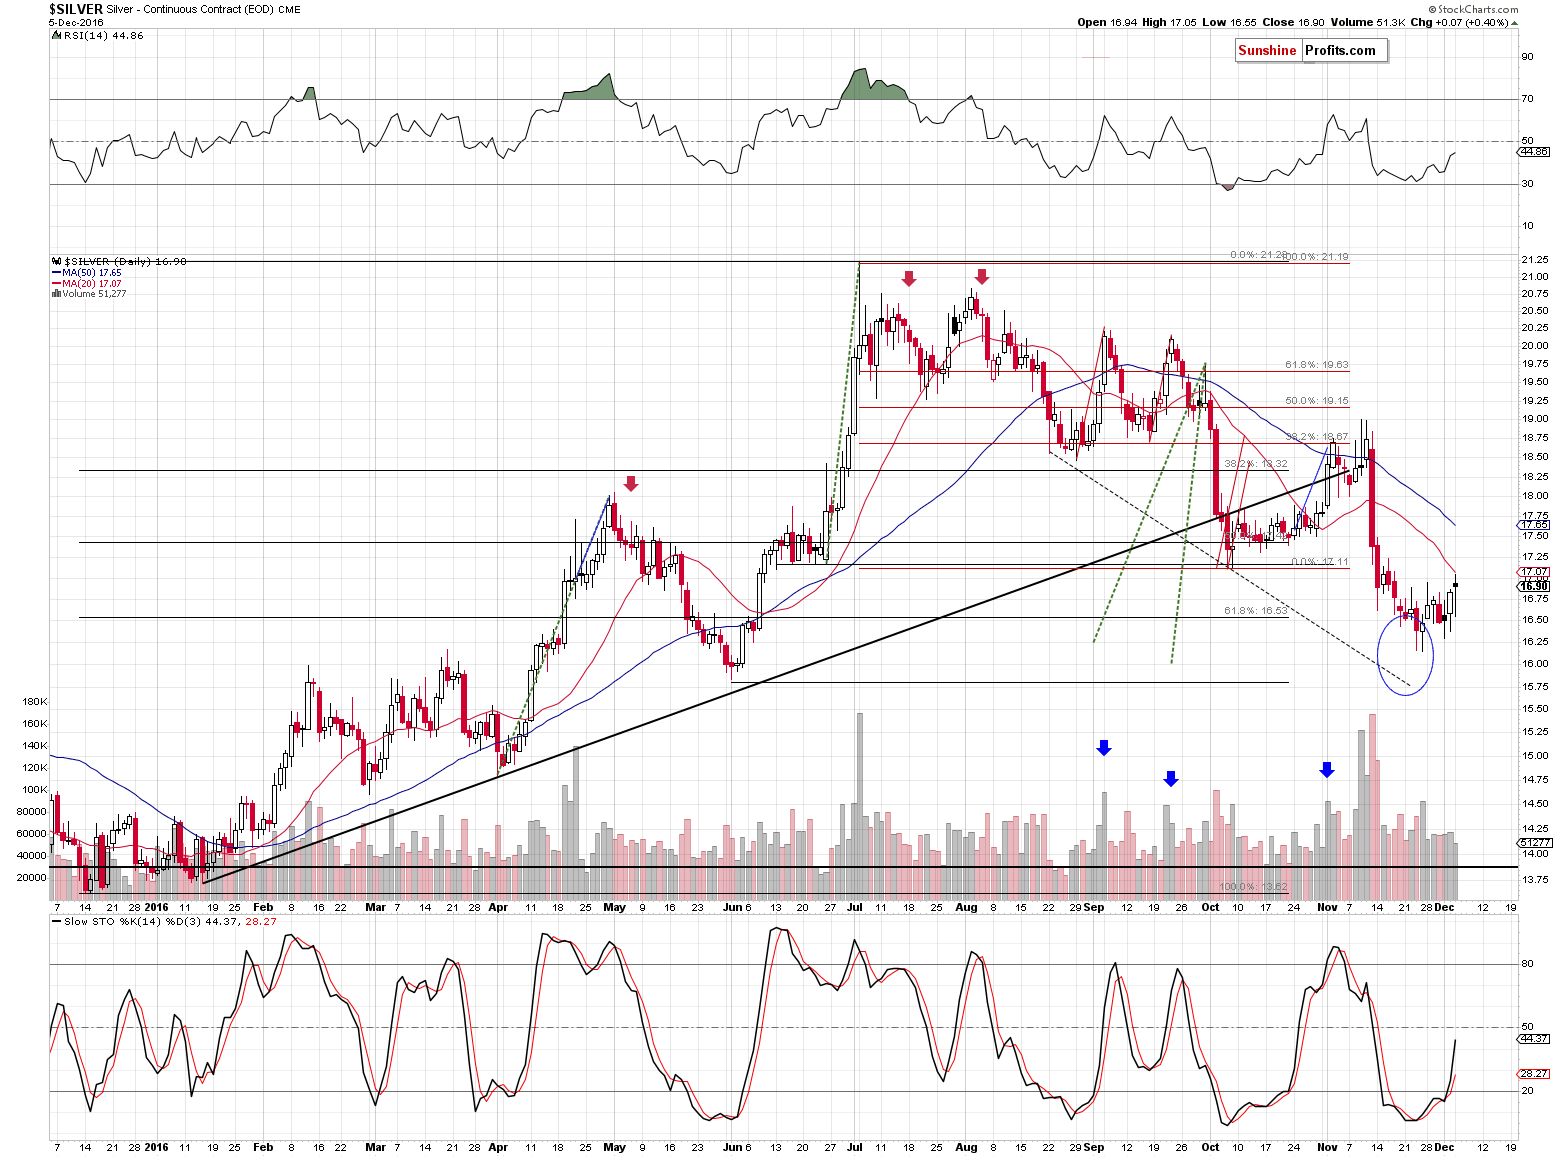
Silver’s outperformance is not significant enough to be a bearish confirmation (yet), but it’s enough to make our long positions in metals profitable on average. Please note that most local tops in the white metal were accompanied by the Stochastic close to the 80 level – this indicator is moving higher, but since its currently at 44, it appears that both the Stochastic and silver itself have further to go before the big downtrend resumes.
Mining stocks didn’t do much yesterday, so let’s move to the thing that appears to be the most important sign at this moment – yesterday’s slide in the USD Index.
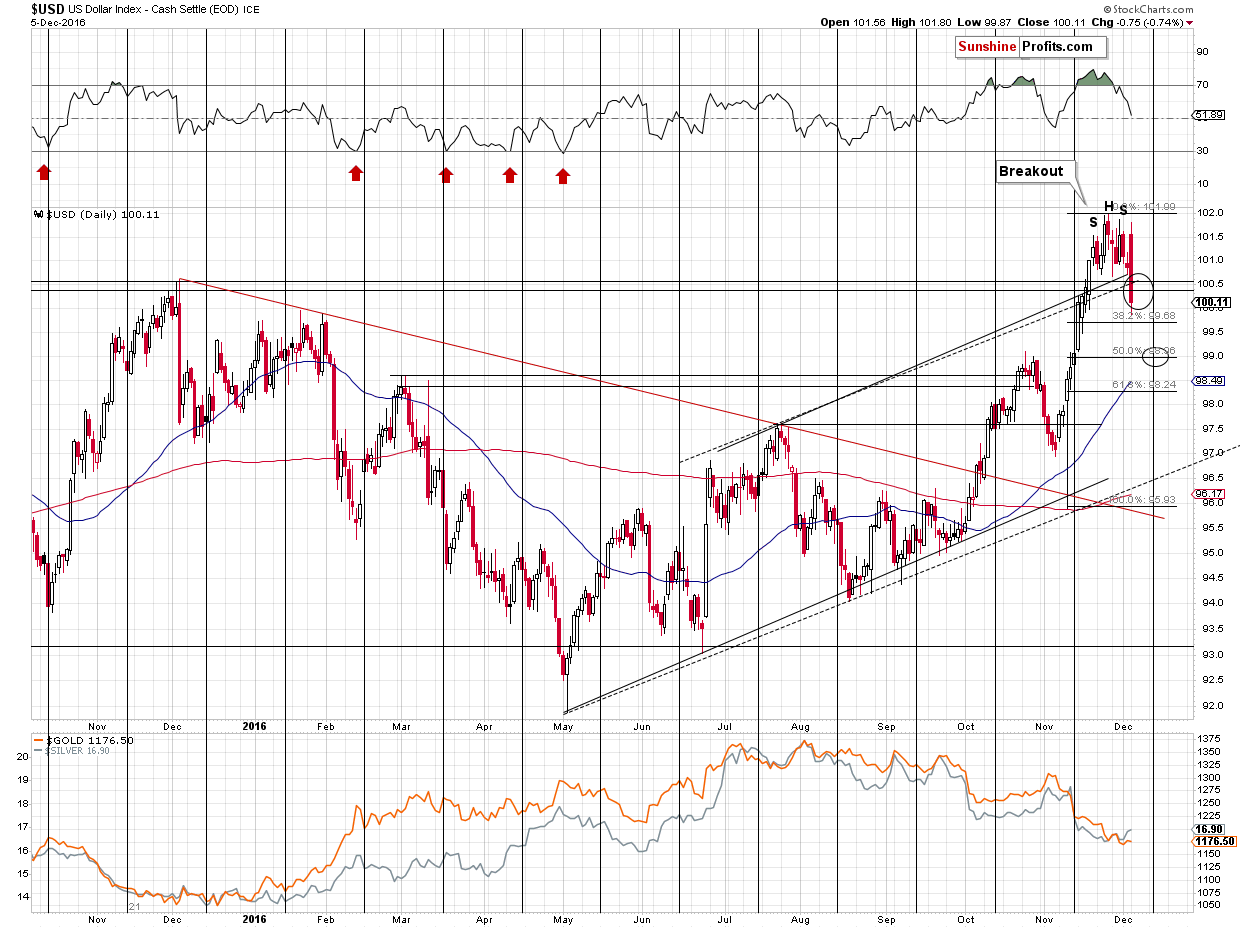
The USD Index moved considerably lower, moving right into our target area and almost touching the 38.2% Fibonacci retracement level. Is the bottom in? It could be, but there’s a very important reason to think it is not (and to think that a lower price target – the 99 level, which is the 50% retracement and the October high – will be reached).
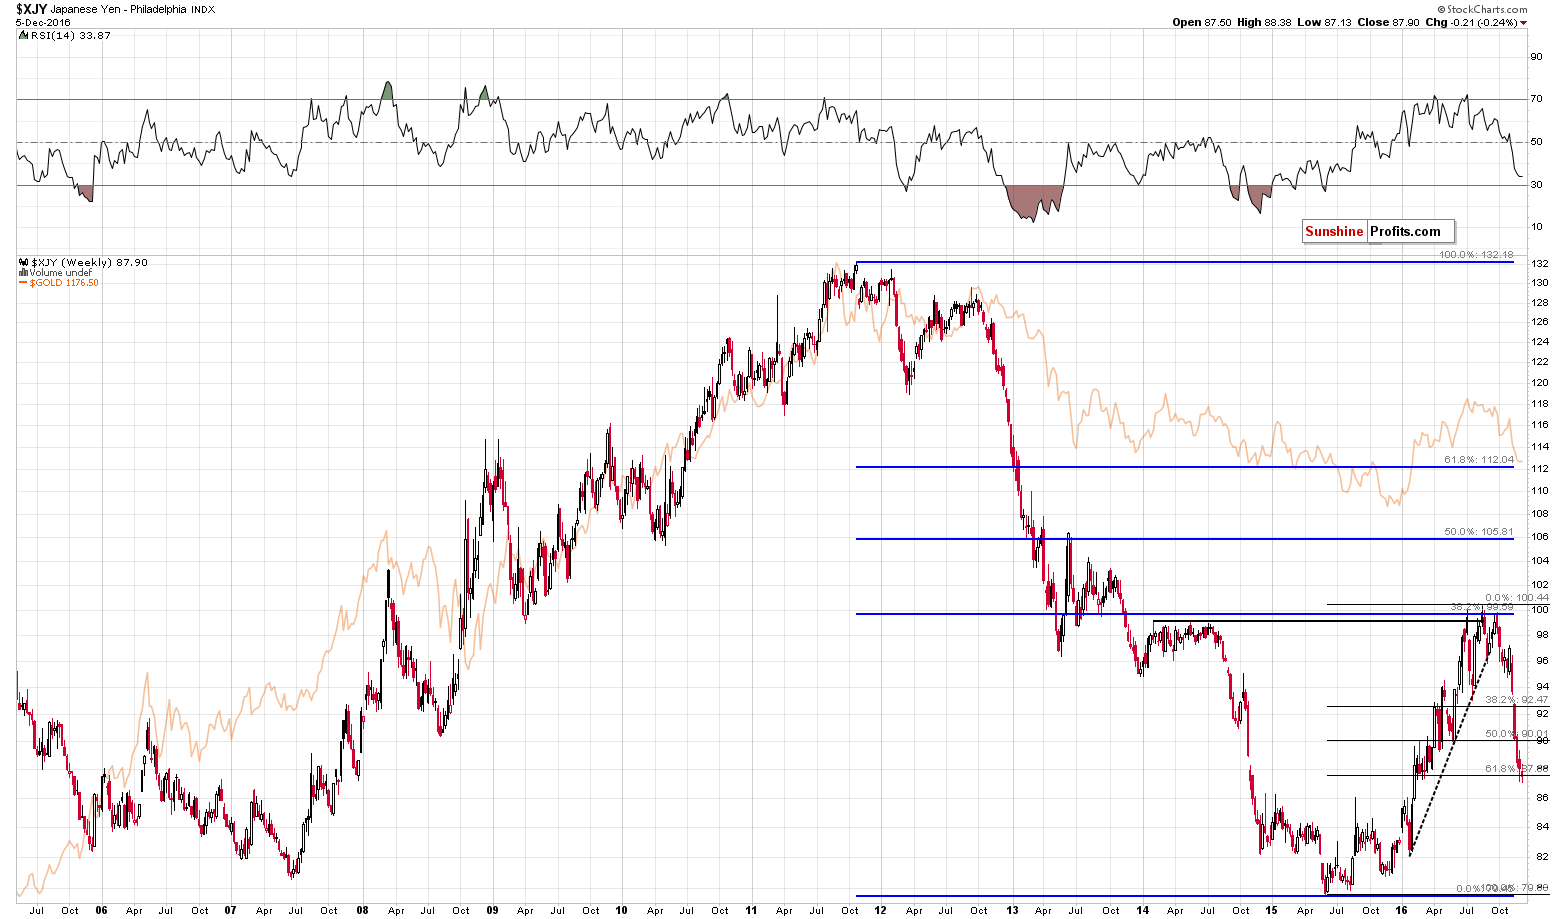
Based on the sharpness of the decline and the 61.8% Fibonacci retracement that was reached, the Japanese yen is likely to rally against the USD in the short term, which is likely to correspond to a move lower in the USD Index (after all, the USD/JPY exchange rate is the second biggest component of the USD Index) and a move higher in gold as the two markets have been highly correlated. The biggest component is the EUR/USD exchange rate and this rate also appears to be moving higher in the short term (!) as it just invalidated a previous breakdown.
So, if the USD Index is going lower and the Japanese yen is going higher (in the short term), then it is very likely that we will see higher gold prices in the short term (!), especially that silver and miners don’t appear to be confirming gold’s intra-day downswings.
Summing up, even though gold didn’t rally last week and yesterday despite the USD’s decline, we still think that the short-term outlook remains bullish. As far as relative performance is concerned, it seems that the somewhat bearish inaction in gold vs. the USD is offset by the bullish outperformance of miners. As far as the situation in the USD Index is concerned, it seems that we’ll need to see a rally in the Japanese yen and slightly lower USDX values before the bottom in the latter is really in. There are several other factors suggesting that a short-term rally is at hand and that it is probably the final corrective upswing before the big plunge. Be sure to prepare yourself for the latter – we haven’t made a change in our long-term investment capital, but it is likely to change in the coming months. Again, it seems that we will have a short-term rally first.
As always, we will keep you – our subscribers – updated.
To summarize:
Trading capital (supplementary part of the portfolio; our opinion): Long positions (full position) in gold, silver and mining stocks are justified from the risk/reward perspective with the following entry prices, stop-loss orders and initial target price levels:
- Gold: initial target price: $1,237; stop-loss: $1,146, initial target price for the UGLD ETN: $10.48; stop-loss for the UGLD ETN $8.48
- Silver: initial target price: $17.27; stop-loss: $15.67, initial target price for the USLV ETN: $15.04; stop-loss for the USLV ETN $11.22
- Mining stocks (price levels for the GDX ETF): initial target price: $23.27; stop-loss: $18.87, initial target price for the NUGT ETF: $10.74; stop-loss for the NUGT ETF $5.78
In case one wants to bet on junior mining stocks' prices (we do not suggest doing so – we think senior mining stocks are more predictable in the case of short-term trades – if one wants to do it anyway, we provide the details), here are the stop-loss details and initial target prices:
- GDXJ ETF: initial target price: $38.17; stop-loss: $30.94
- JNUG ETF: initial target price: $8.88; stop-loss: $4.78
Long-term capital (core part of the portfolio; our opinion): No positions (in other words: cash)
Insurance capital (core part of the portfolio; our opinion): Full position
Plus, you might want to read why our stop-loss orders are usually relatively far from the current price.
Please note that a full position doesn’t mean using all of the capital for a given trade. You will find details on our thoughts on gold portfolio structuring in the Key Insights section on our website.
As a reminder – “initial target price” means exactly that – an “initial” one, it’s not a price level at which we suggest closing positions. If this becomes the case (like it did in the previous trade) we will refer to these levels as levels of exit orders (exactly as we’ve done previously). Stop-loss levels, however, are naturally not “initial”, but something that, in our opinion, might be entered as an order.
Since it is impossible to synchronize target prices and stop-loss levels for all the ETFs and ETNs with the main markets that we provide these levels for (gold, silver and mining stocks – the GDX ETF), the stop-loss levels and target prices for other ETNs and ETF (among other: UGLD, DGLD, USLV, DSLV, NUGT, DUST, JNUG, JDST) are provided as supplementary, and not as “final”. This means that if a stop-loss or a target level is reached for any of the “additional instruments” (DGLD for instance), but not for the “main instrument” (gold in this case), we will view positions in both gold and DGLD as still open and the stop-loss for DGLD would have to be moved lower. On the other hand, if gold moves to a stop-loss level but DGLD doesn’t, then we will view both positions (in gold and DGLD) as closed. In other words, since it’s not possible to be 100% certain that each related instrument moves to a given level when the underlying instrument does, we can’t provide levels that would be binding. The levels that we do provide are our best estimate of the levels that will correspond to the levels in the underlying assets, but it will be the underlying assets that one will need to focus on regarding the signs pointing to closing a given position or keeping it open. We might adjust the levels in the “additional instruments” without adjusting the levels in the “main instruments”, which will simply mean that we have improved our estimation of these levels, not that we changed our outlook on the markets. We are already working on a tool that would update these levels on a daily basis for the most popular ETFs, ETNs and individual mining stocks.
Our preferred ways to invest in and to trade gold along with the reasoning can be found in the how to buy gold section. Additionally, our preferred ETFs and ETNs can be found in our Gold & Silver ETF Ranking.
As always, we'll keep you - our subscribers - updated should our views on the market change. We will continue to send out Gold & Silver Trading Alerts on each trading day and we will send additional Alerts whenever appropriate.
The trading position presented above is the netted version of positions based on subjective signals (opinion) from your Editor, and the Tools and Indicators.
As a reminder, Gold & Silver Trading Alerts are posted before or on each trading day (we usually post them before the opening bell, but we don't promise doing that each day). If there's anything urgent, we will send you an additional small alert before posting the main one.
=====
Latest Free Trading Alerts:
Italians said “no” to constitutional reforms in Sunday’s referendum. What does it mean for the gold market?
=====
Hand-picked precious-metals-related links:
Factbox: The perfect storm that's sinking gold
Citi Sees 2017 ‘Gold Price Pain Before Gains,’ $1,160 Average
WGC: Shari’ah Standard on Gold
Bitcoin Demand Seen to Rise as China Restricts Gold Importation
=====
In other news:
The dollar won't perform as expected in 2017, thanks to the Fed, strategist Jim Paulsen says
China’s yuan didn't suffer a sharp fall despite the rumors swirling on social media
Oil dips as OPEC, Russian output rises ahead of production cut
Markets relaxed as state aid looms for Italy's Monte dei Paschi – business live
Van der Bellen confirmed victor in Austrian presidential vote
=====
Thank you.
Sincerely,
Przemyslaw Radomski, CFA
Founder, Editor-in-chief, Gold & Silver Fund Manager
Gold & Silver Trading Alerts
Forex Trading Alerts
Oil Investment Updates
Oil Trading Alerts

