

Briefly: In our opinion, regular (100% of the full position) speculative long positions in gold, silver and mining stocks are justified from the risk/reward perspective.
Gold declined visibly last week and the most important development took place on Friday as gold declined a bit below the 61.8% Fibonacci retracement level and reversed visibly before the end of the session. Will the strong support and a daily reversal trigger a corrective upswing?
In short, it seems quite likely. Let’s take a look at the charts (charts courtesy of http://stockcharts.com), starting with the USD Index, which continues to provide an important context for the current outlook for metals and miners.
In short, our previous comments remain up-to-date:
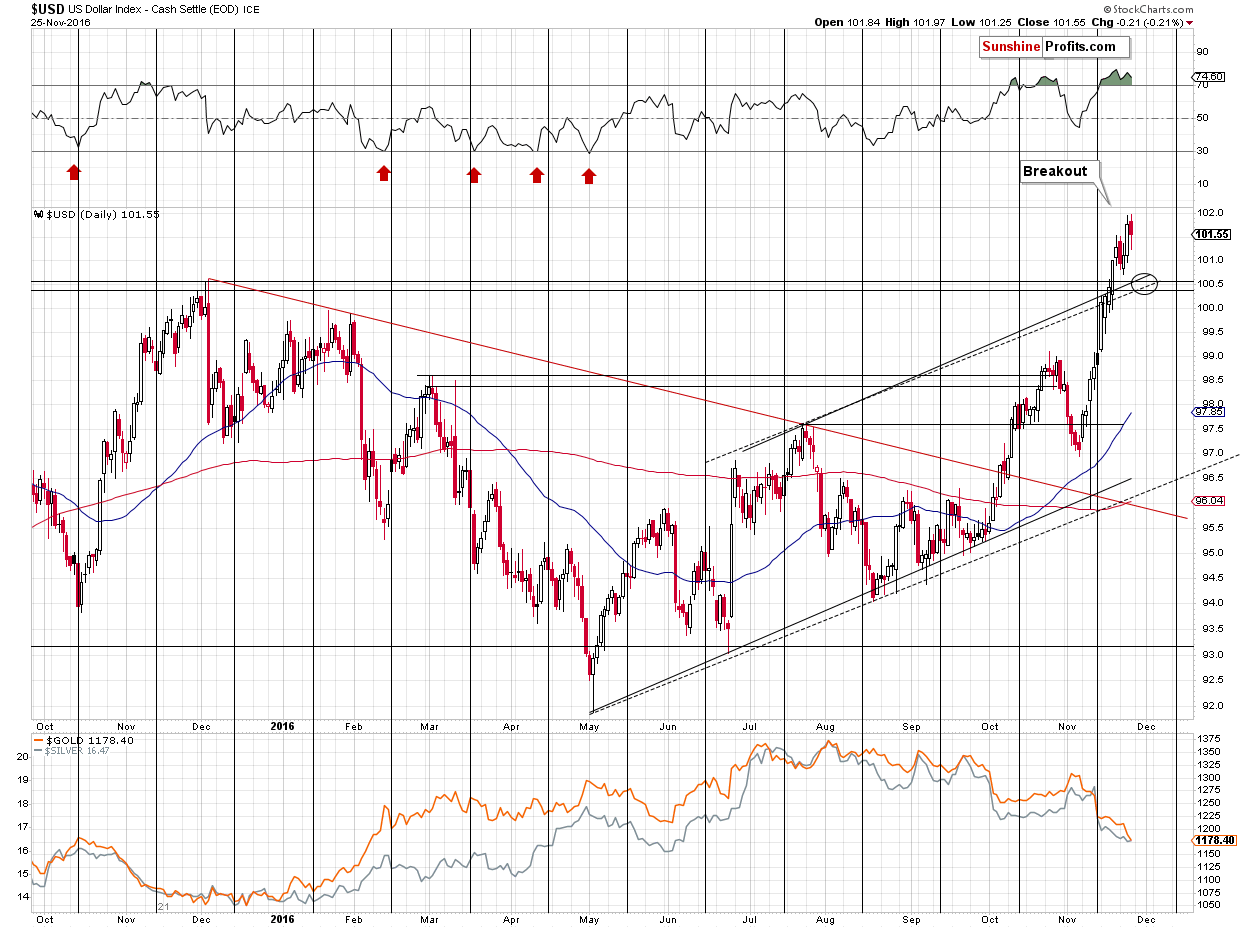
On the above short-term chart, the outlook for the USD Index is bullish as it moved above the previous resistance levels, verified the breakout and on Wednesday, it moved to new highs. However, the potential for further appreciation is rather limited in the very near term, based on the long-term chart.
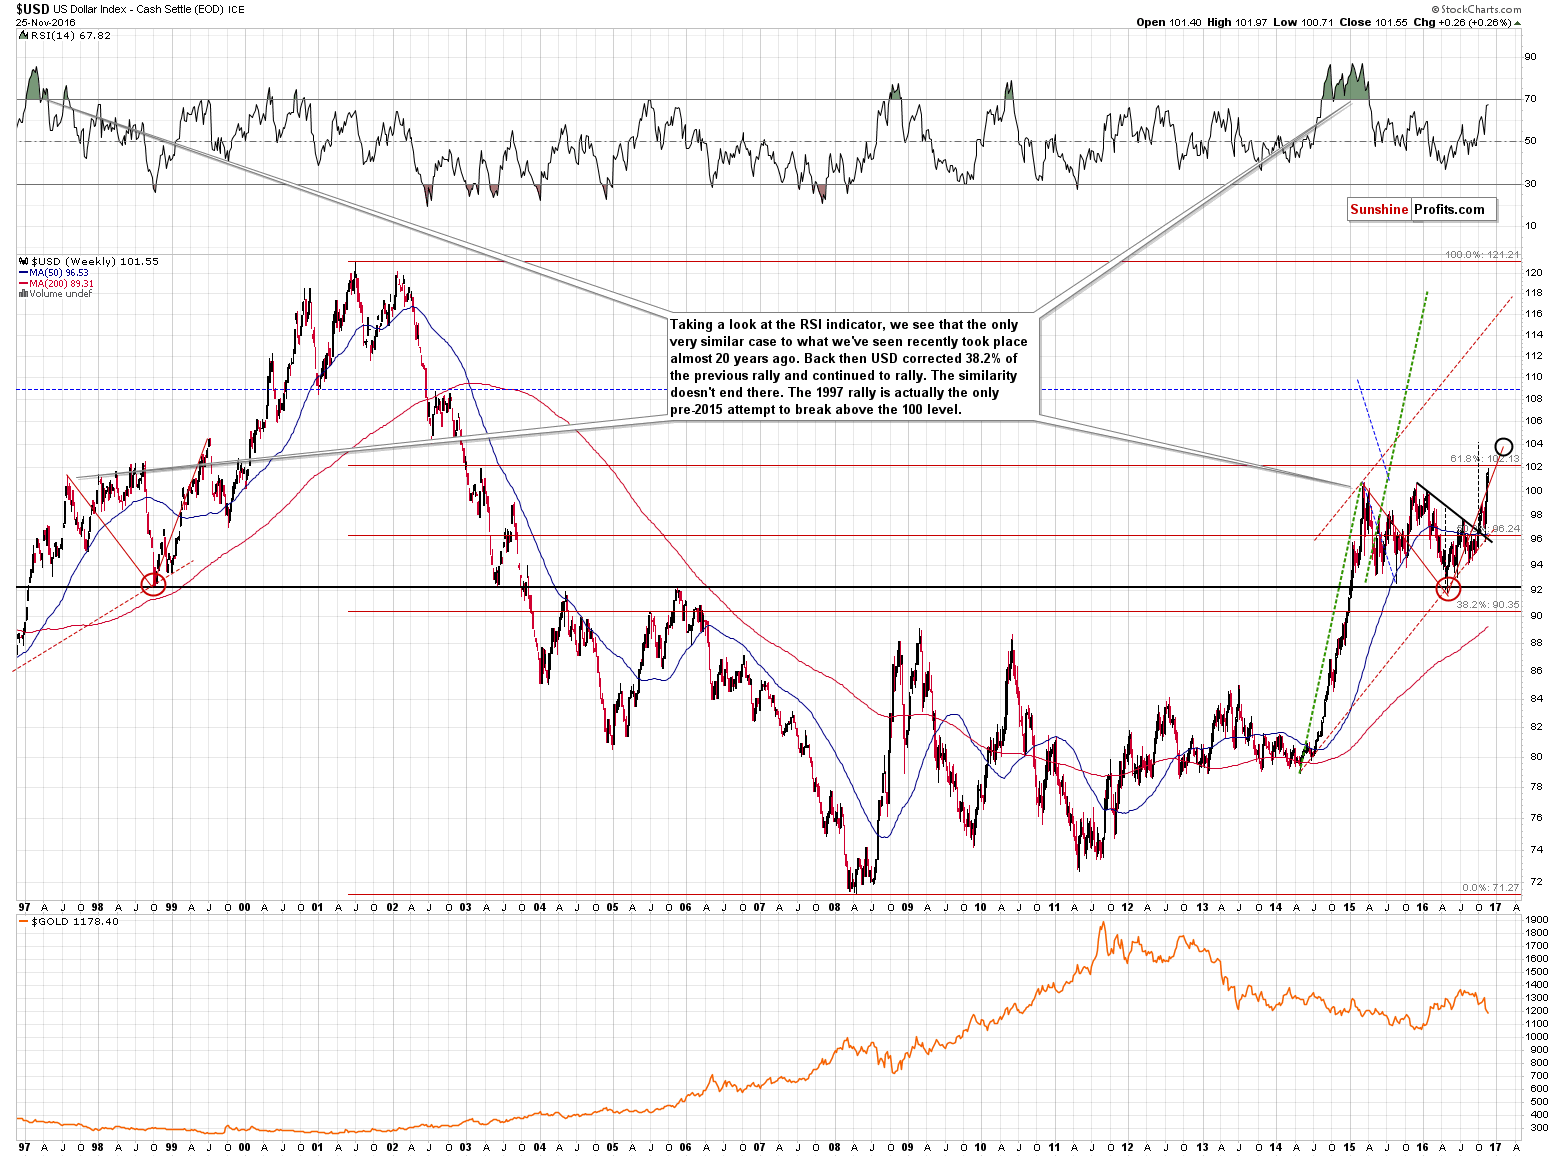
As you can see on the latter, the USD Index is about to encounter a very important resistance – the 61.8% Fibonacci retracement level based on the entire 2001 – 2008 decline. That’s a very important retracement based on a very important decline. It’s quite likely to stop a rally if the market gets too overbought on a short-term basis, and it seems this is the case right now.
Back in 1999, when the USD Index rallied in a similar fashion, it did so without a major decline, but still, it didn’t rally in a straight line. There were corrections along the way (small, but still) and the first time the USD Index moved above the rising red line, it then corrected back below it before the rally resumed. We now have the USD Index visibly above the rising red line, but we have yet to see a move back below it. A decline to 100 or so would serve as a correction similar to what we saw previously and thus it appears quite likely.
Wednesday’s intra-day high was 101.96 and the 61.8% Fibonacci retracement is at 102.13 – very close to where the USD Index moved. Consequently, the upside potential for the USD Index in the short term is very limited.
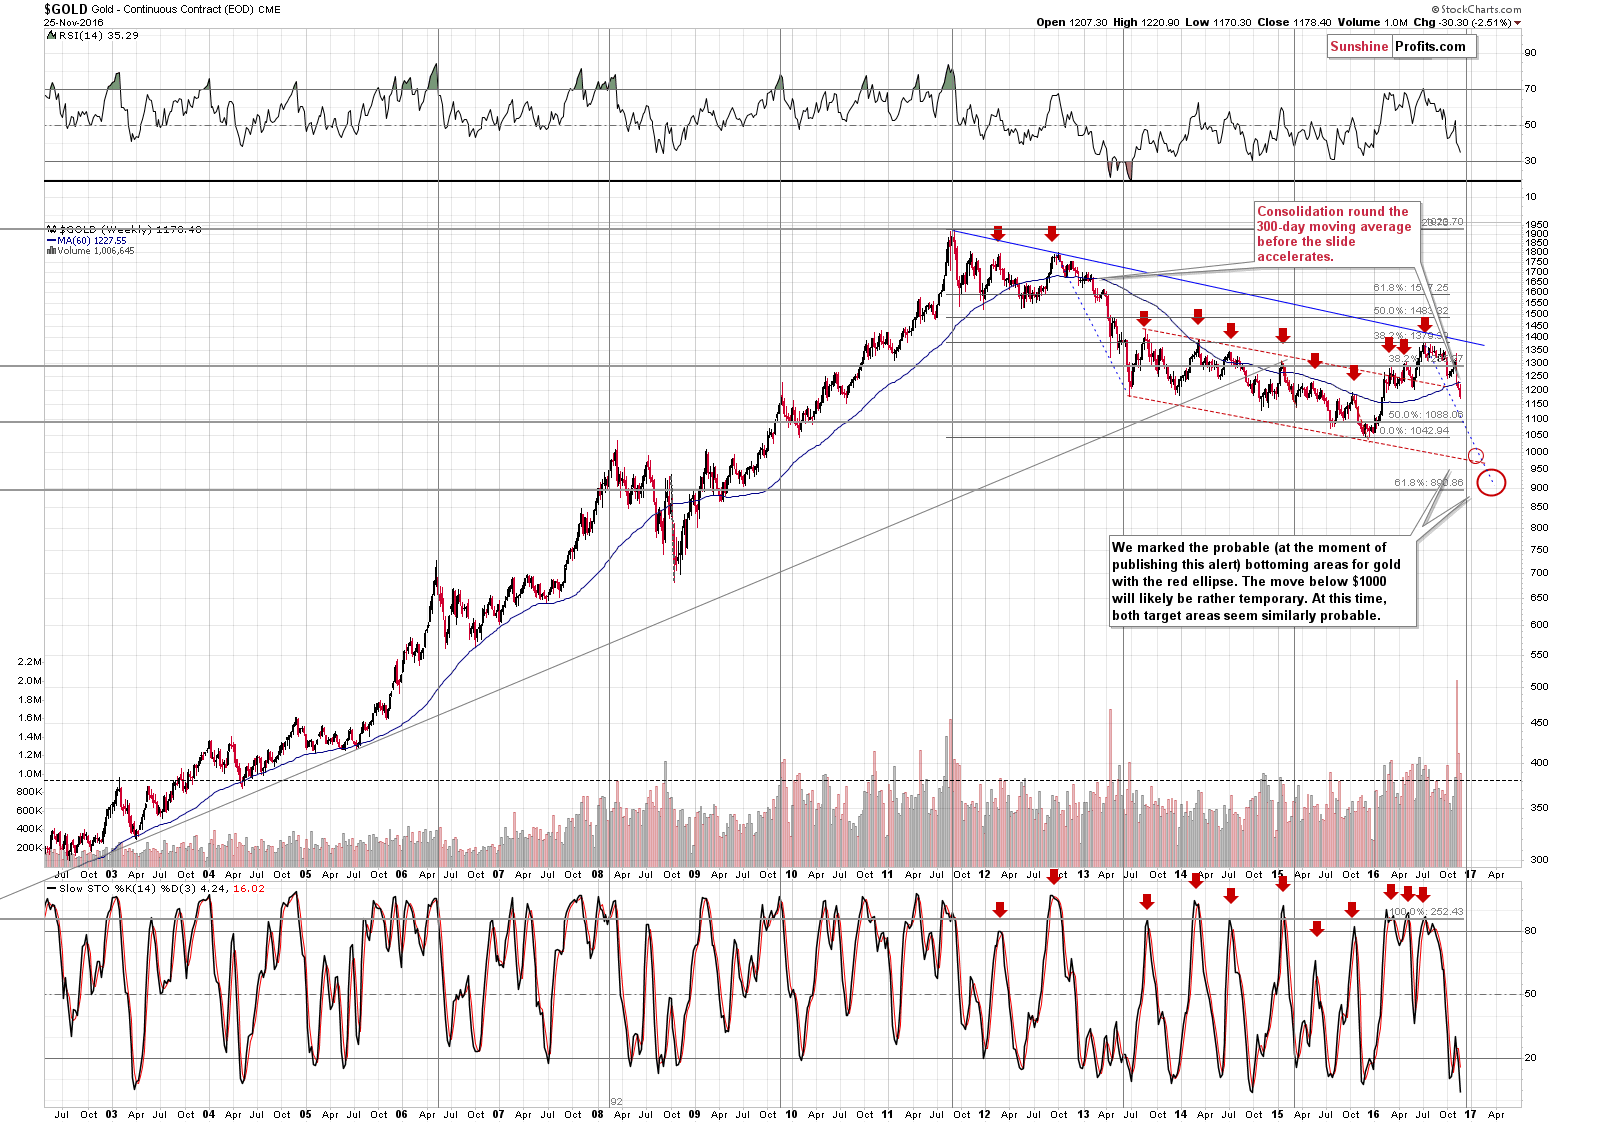
Gold declined over $30 last week as it moved well below the previous lows and the decline caused the weekly Stochastic indicator to be more oversold than it’s been since the second half of 2014. The indicator being oversold is not a buy signal by itself, but please note that back in 2014, a corrective upswing took place shortly after similar Stochastic levels were seen and while it was not the final bottom, the rally was quite sizable. Interestingly the mentioned rally started shortly after gold broke below the $1,200 level, just like what we see today. Back then gold moved a little above $1,250 temporarily, before continuing to decline. It appears that a similar action is likely also this time.
As far as gold’s short-term chart is concerned, in our previous alert we wrote the following:
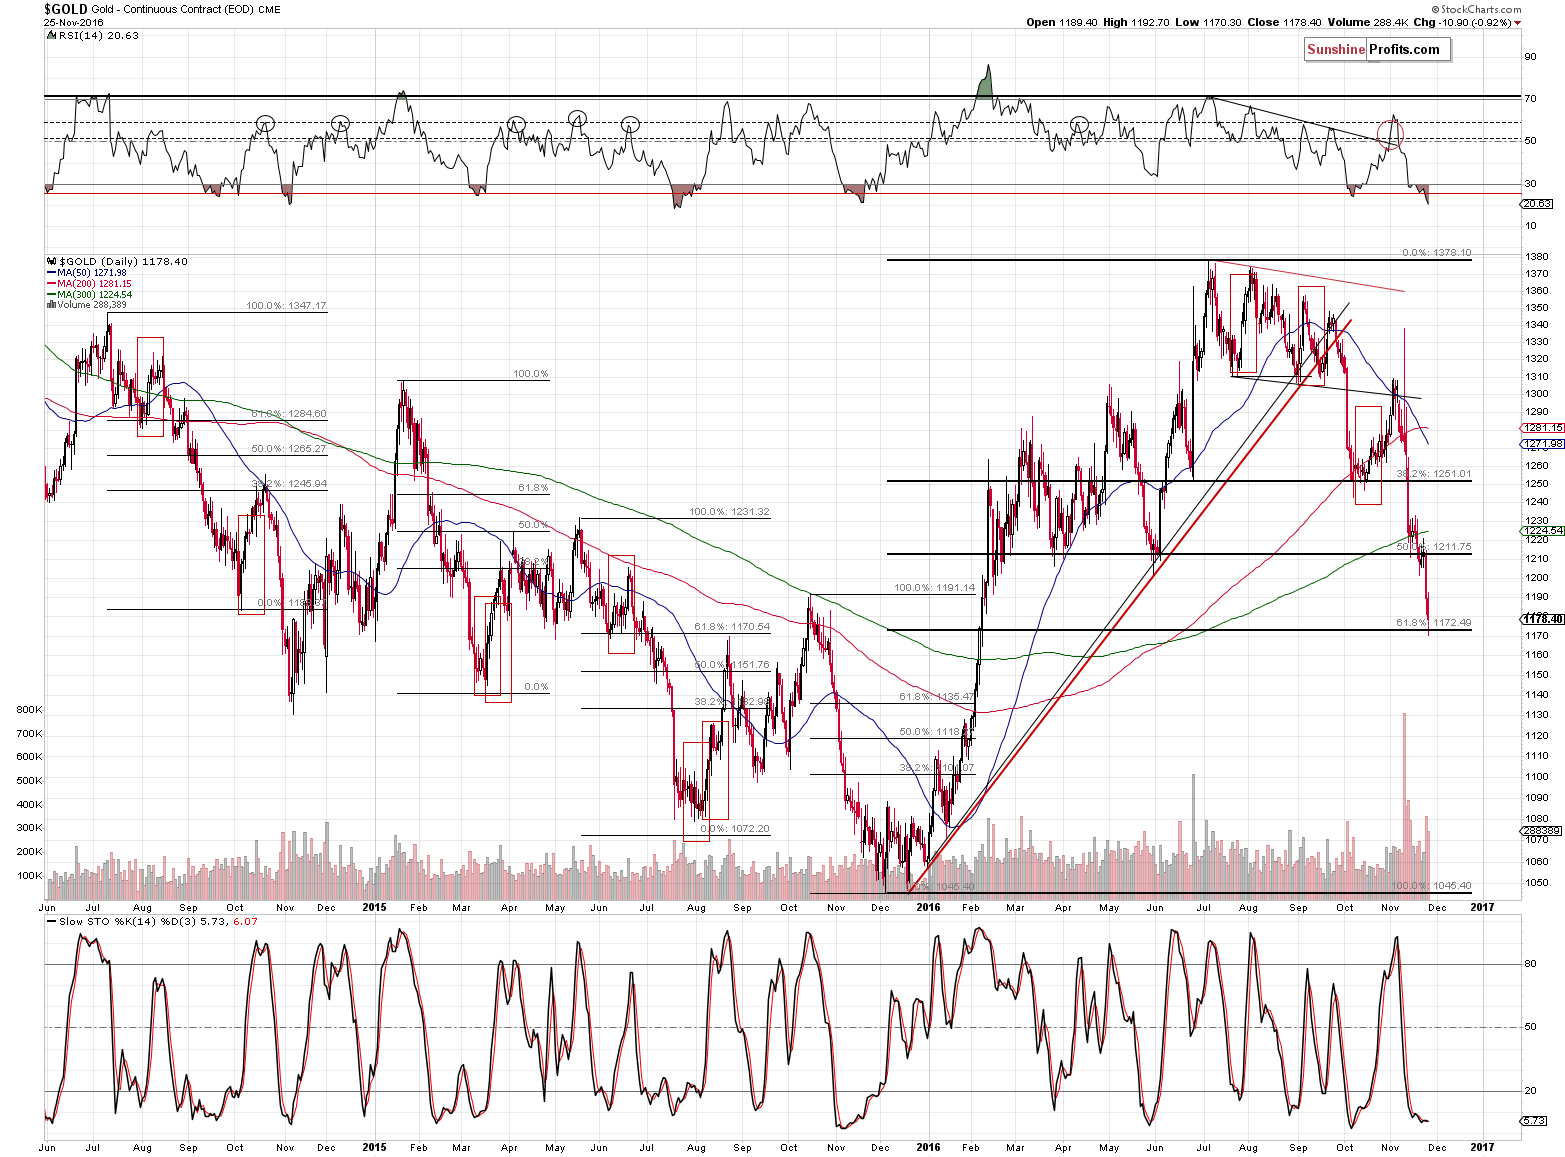
The USD Index was very close to reaching its 61.8% Fibonacci retracement and we can say the same about gold. The yellow metal moved very quickly from over $1,330 below $1,190 and it seems that a corrective upswing is just around the corner.
Several weeks ago, we discussed the temporary downside targets for gold and we focused on the 38.2%, 50% and 61.8% Fibonacci retracements. We wrote that depending on how they were reached, they were more or less likely to trigger a corrective upswing. The decline that took gold to about $1,180 was very sharp and – based on the situation in the USD Index – may be overdone. It does seem likely that a corrective upswing will be seen either shortly or after gold moves to the 61.8% Fibonacci retracement ($1,172).
The above is up-to-date. Gold has indeed moved to the 61.8% Fibonacci retracement and a corrective upswing just became very likely, especially that neither silver, nor mining stocks moved to new lows on Friday.
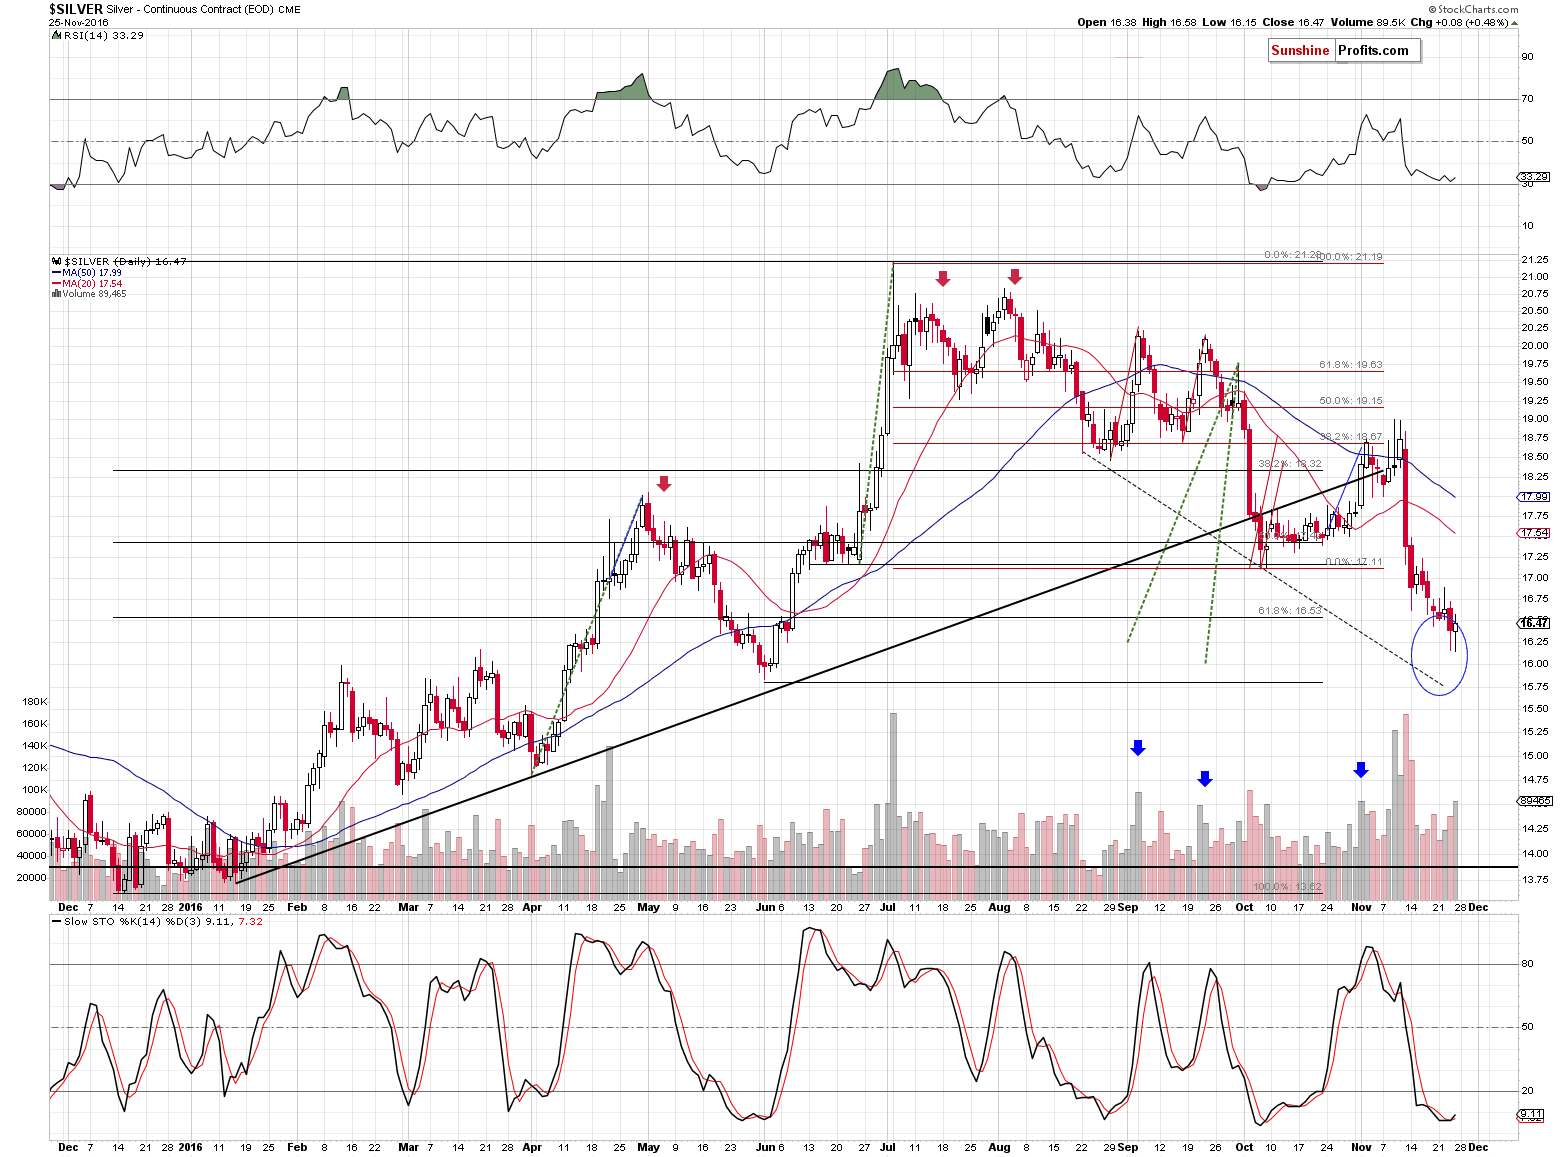
Silver closed 8 cents higher on Friday, so the points that we made previously remain up-to-date:
Silver is already in our target area, so betting on further declines here doesn’t appear to be justified – the white metal is likely to rebound shortly (as the 61.8% Fibonacci retracement has been broken insignificantly and the breakdown was not confirmed) or after a decline to $15.75 or so (June low and the declining dashed support line). Either way, the potential size of the decline in the short term appears to be rather limited.
Does the above mean that the decline in silver is entirely over? No – it simply means that a pause or corrective upswing is quite likely to be seen in the short term, after which the big decline (probably bigger than what we saw recently) is likely to resume.
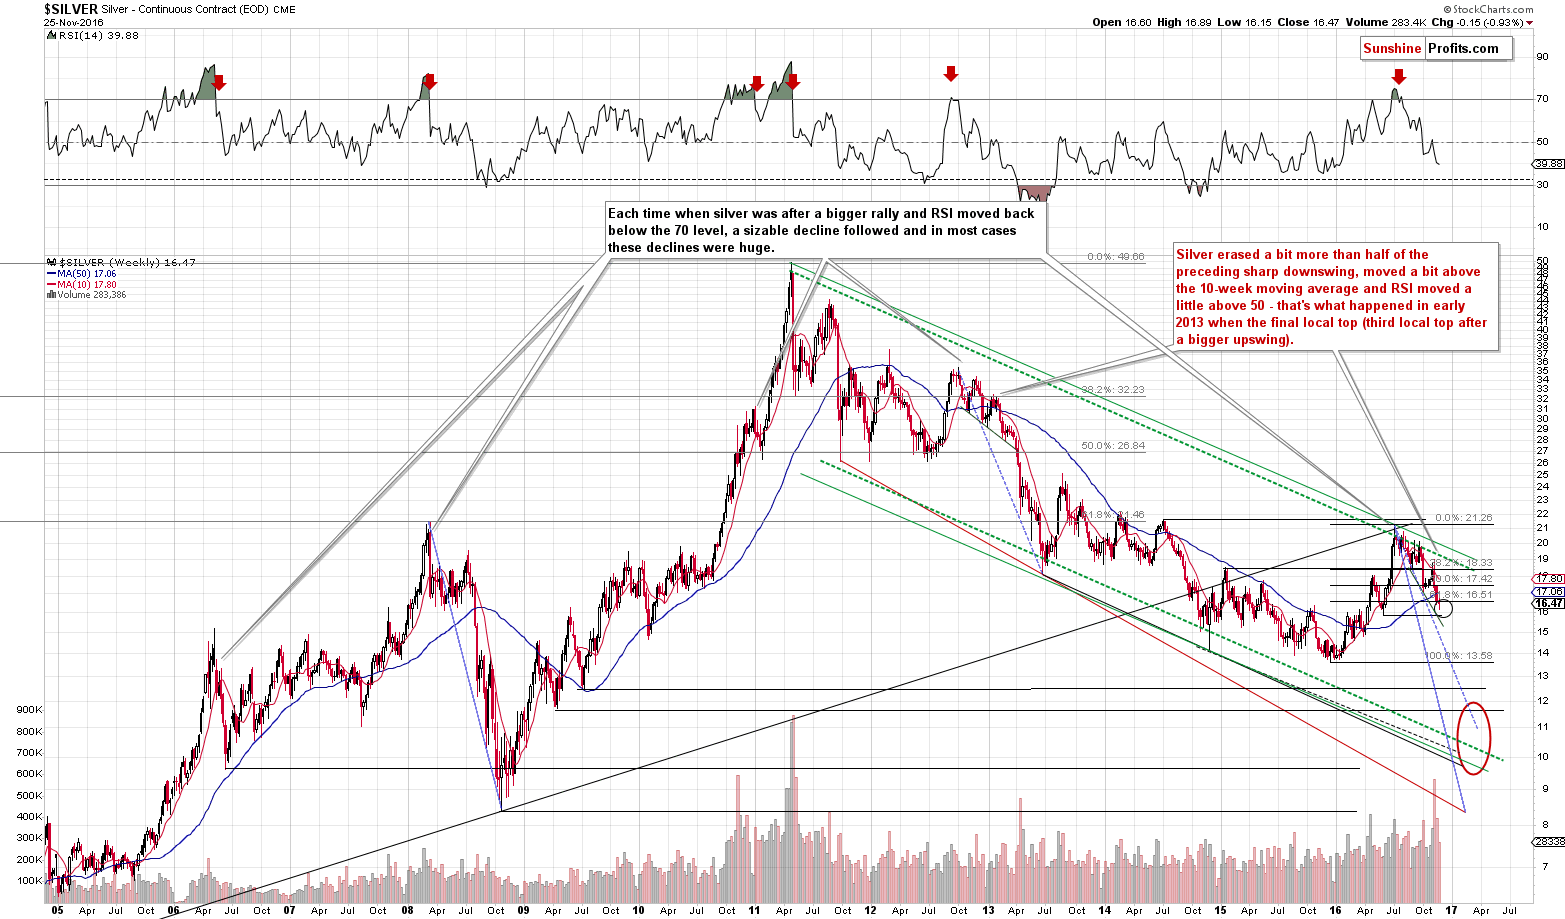
On the long-term silver chart you can see that if silver rallies, then it’s likely to rally either to the 50% Fibonacci retracement, the 50-week moving average of the previous 2016 low. In other words, silver would be likely to rally to $17 - $17.50.
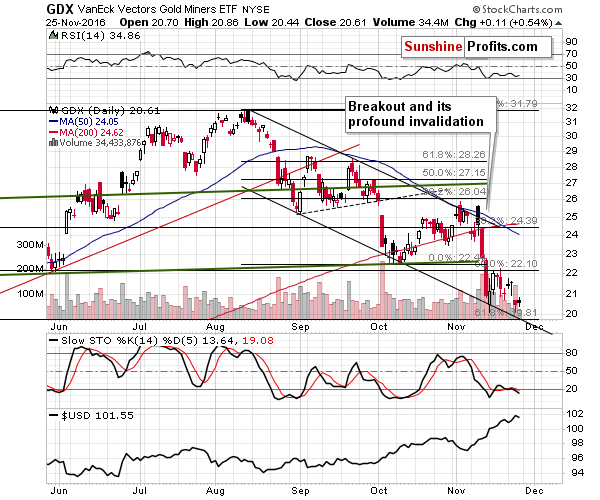
Mining stocks continue to provide us with bullish indications for the short term as they didn’t move to new intra-day lows, even though gold moved visibly lower. The fact that we saw the same signal (miners refused to decline, even though gold did) for another day makes the short-term outlook bullish.
The GDX ETF still remains within the lower border of the declining trend channel and the medium-term trend is not likely to change, but it now seems that a counter-trend bounce is very likely in the short term.
Summing up, even though the medium-term trend in the precious metals market remains down (as multiple bearish indications for the medium term remain in place), it appears that a combination of bullish factors (support levels were reached in gold, silver and mining stocks and resistance was almost reached in the USD, miners are showing exceptional strength in the short term and the weekly Stochastic indicator suggests a temporary upswing) makes a speculative long position justified at this time.
This is a bet on a quick rebound, so this time we will define the exit orders (binding profit take levels) in advance. Reaching each of them should exit the entire position. In other words, if gold reaches its profit take level, it means closing the position in gold, silver and mining stocks. If silver reaches its profit take level, it means closing the position in gold, silver and mining stocks, and if mining stocks reach their profit-take level, it also means closing the position in gold, silver and mining stocks.
As always, we will keep you – our subscribers – updated.
To summarize:
Trading capital (supplementary part of the portfolio; our opinion): Long positions (full position) in gold, silver and mining stocks are justified from the risk/reward perspective with the following entry prices, stop-loss orders and initial target price levels:
- Gold: initial target price: $1,237; stop-loss: $1,157, initial target price for the UGLD ETN: $10.48; stop-loss for the UGLD ETN $8.62
- Silver: initial target price: $17.27; stop-loss: $15.67, initial target price for the USLV ETN: $15.04; stop-loss for the USLV ETN $11.22
- Mining stocks (price levels for the GDX ETF): initial target price: $23.27; stop-loss: $18.87, initial target price for the NUGT ETF: $10.74; stop-loss for the NUGT ETF $5.78
In case one wants to bet on junior mining stocks' prices (we do not suggest doing so – we think senior mining stocks are more predictable in the case of short-term trades – if one wants to do it anyway, we provide the details), here are the stop-loss details and initial target prices:
- GDXJ ETF: initial target price: $38.17; stop-loss: $30.94
- JNUG ETF: initial target price: $8.88; stop-loss: $4.78
Long-term capital (core part of the portfolio; our opinion): No positions (in other words: cash)
Insurance capital (core part of the portfolio; our opinion): Full position
Plus, you might want to read why our stop-loss orders are usually relatively far from the current price.
Please note that a full position doesn’t mean using all of the capital for a given trade. You will find details on our thoughts on gold portfolio structuring in the Key Insights section on our website.
As a reminder – “initial target price” means exactly that – an “initial” one, it’s not a price level at which we suggest closing positions. If this becomes the case (like it did in the previous trade) we will refer to these levels as levels of exit orders (exactly as we’ve done previously). Stop-loss levels, however, are naturally not “initial”, but something that, in our opinion, might be entered as an order.
Since it is impossible to synchronize target prices and stop-loss levels for all the ETFs and ETNs with the main markets that we provide these levels for (gold, silver and mining stocks – the GDX ETF), the stop-loss levels and target prices for other ETNs and ETF (among other: UGLD, DGLD, USLV, DSLV, NUGT, DUST, JNUG, JDST) are provided as supplementary, and not as “final”. This means that if a stop-loss or a target level is reached for any of the “additional instruments” (DGLD for instance), but not for the “main instrument” (gold in this case), we will view positions in both gold and DGLD as still open and the stop-loss for DGLD would have to be moved lower. On the other hand, if gold moves to a stop-loss level but DGLD doesn’t, then we will view both positions (in gold and DGLD) as closed. In other words, since it’s not possible to be 100% certain that each related instrument moves to a given level when the underlying instrument does, we can’t provide levels that would be binding. The levels that we do provide are our best estimate of the levels that will correspond to the levels in the underlying assets, but it will be the underlying assets that one will need to focus on regarding the signs pointing to closing a given position or keeping it open. We might adjust the levels in the “additional instruments” without adjusting the levels in the “main instruments”, which will simply mean that we have improved our estimation of these levels, not that we changed our outlook on the markets. We are already working on a tool that would update these levels on a daily basis for the most popular ETFs, ETNs and individual mining stocks.
Our preferred ways to invest in and to trade gold along with the reasoning can be found in the how to buy gold section. Additionally, our preferred ETFs and ETNs can be found in our Gold & Silver ETF Ranking.
As always, we'll keep you - our subscribers - updated should our views on the market change. We will continue to send out Gold & Silver Trading Alerts on each trading day and we will send additional Alerts whenever appropriate.
The trading position presented above is the netted version of positions based on subjective signals (opinion) from your Editor, and the Tools and Indicators.
As a reminder, Gold & Silver Trading Alerts are posted before or on each trading day (we usually post them before the opening bell, but we don't promise doing that each day). If there's anything urgent, we will send you an additional small alert before posting the main one.
=====
Latest Free Trading Alerts:
Last week, the minutes of the Federal Reserve’s November meeting were released. What do they say about the Fed’s stance and what do they mean for the gold market?
November FOMC Minutes and Gold
S&P 500 index extended its uptrend on Friday. Will it continue higher? Or is this some topping pattern before a downward reversal? Is holding short position still justified?
Stock Trading Alert: New Record Highs, But Will The Uptrend Continue?
=====
Hand-picked precious-metals-related links:
Gold climbs as dollar and U.S. bond yields retreat
SCOTIA MOCATTA : Commitments of Traders (CFTC)
Islamic finance body approves standard for gold-based products
=====
In other news:
This bull market is just getting started
OPEC makes last-ditch bid to save oil deal as tensions grow
Oil slip sends dollar, bond yields skidding
What Will Italy’s Referendum Mean for the Euro?
South Africa's Zuma faces no-confidence vote by top ANC committee
=====
Thank you.
Sincerely,
Przemyslaw Radomski, CFA
Founder, Editor-in-chief, Gold & Silver Fund Manager
Gold & Silver Trading Alerts
Forex Trading Alerts
Oil Investment Updates
Oil Trading Alerts

