

Briefly: In our opinion, regular (100% of the full position) speculative short positions in gold, silver and mining stocks are justified from the risk/reward perspective.
Today’s Gold & Silver Trading Alert is going to be about the USD Index and there’s a good reason for it. What happened with the dollar has profound implications for the precious metals sector, even though it doesn’t appear evident for most market participants (if it were, the PMs would have plunged yesterday, instead of declining a bit). Speaking of the precious metals sector, nothing particularly important happened yesterday – gold, silver and mining stocks declined, but they didn’t break below their previous low. The latter may appear as strong performance of the PMs relative to the USD Index, but it seems much more likely that PM investors simply don’t believe in the breakout in the USD Index that took place in the final hours of yesterday’s session.
Let’s take a look at the charts (charts courtesy of http://stockcharts.com).
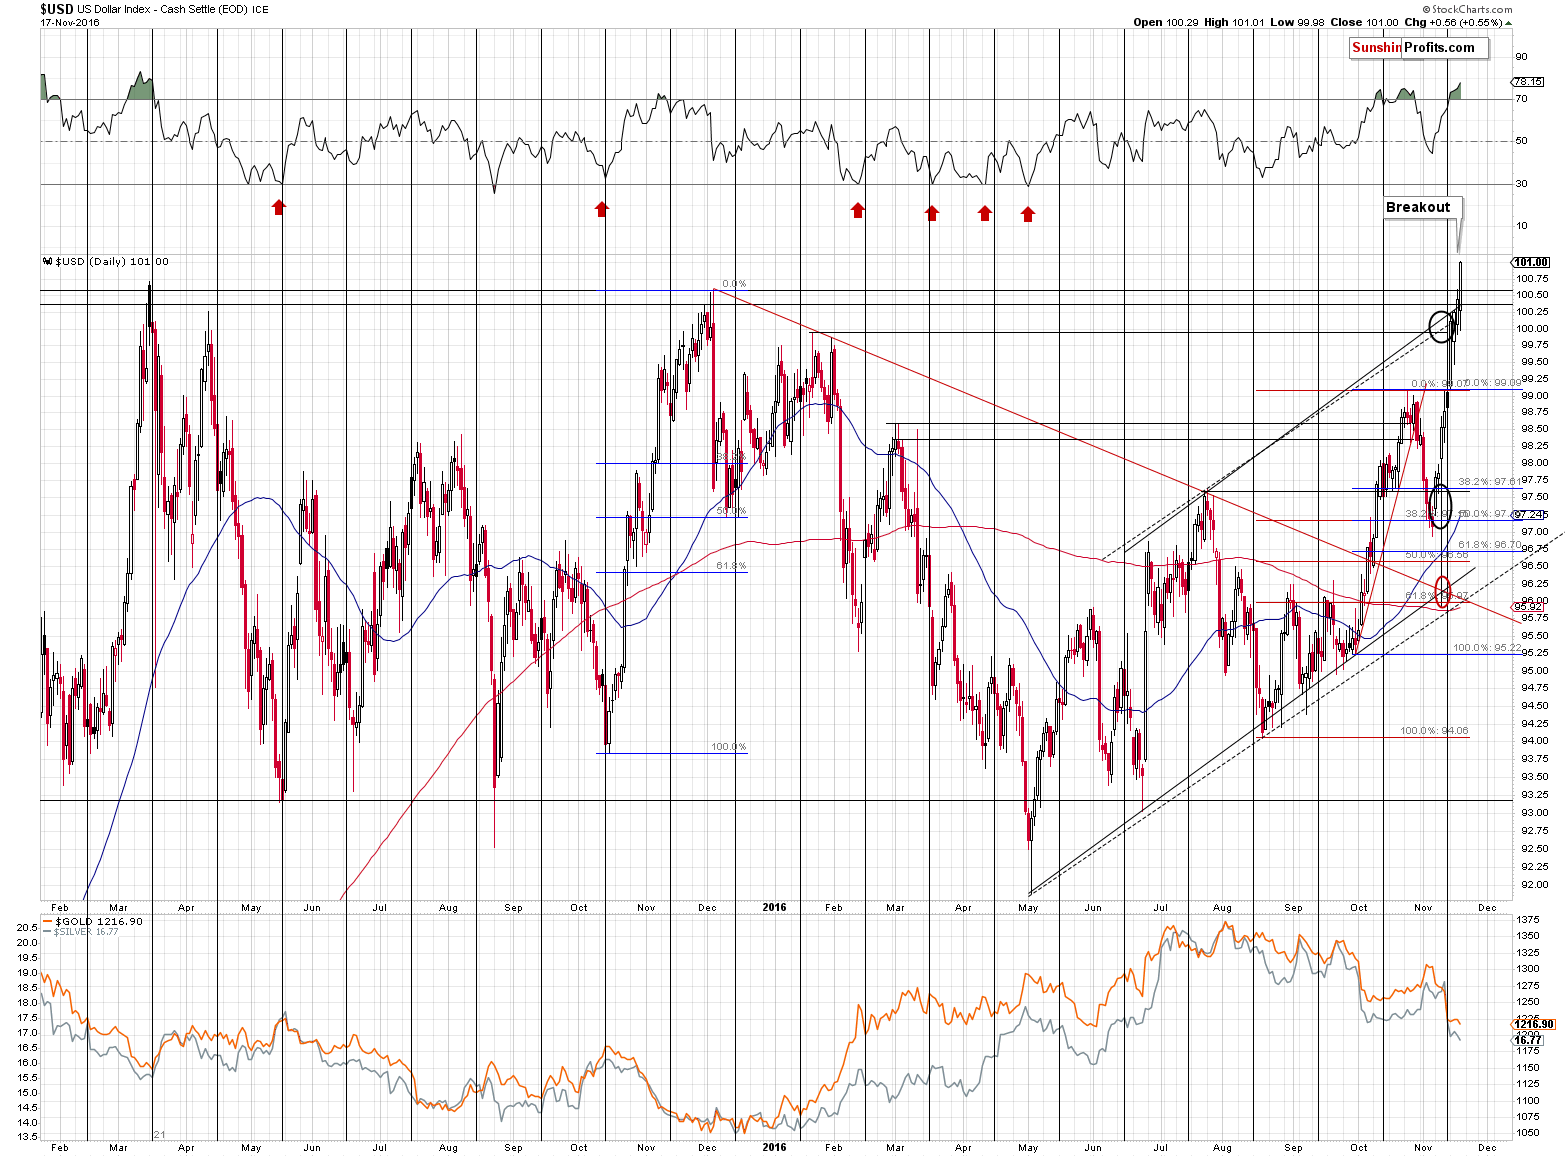
The previous high (as far as the past 13 years are concerned) in terms of daily closing prices was seen in November 2015 and that high was 100.21. This high was broken on November 15, 2016 as the USD Index closed at 100.25, and it then continued to rally further. On November 16, the USD closed at 100.44 and on November 17 it closed at 101. That was the third consecutive close above the previous high – the breakout was just verified. It will be even more verified and bullish if we also get a weekly closing price above 100.21. So, unless the USD declines strongly today, we will have a major breakout in terms of weekly closing prices as well. The implications are bullish for the following weeks and are likely to be even more bullish due to the above.
What makes the breakout even more believable?
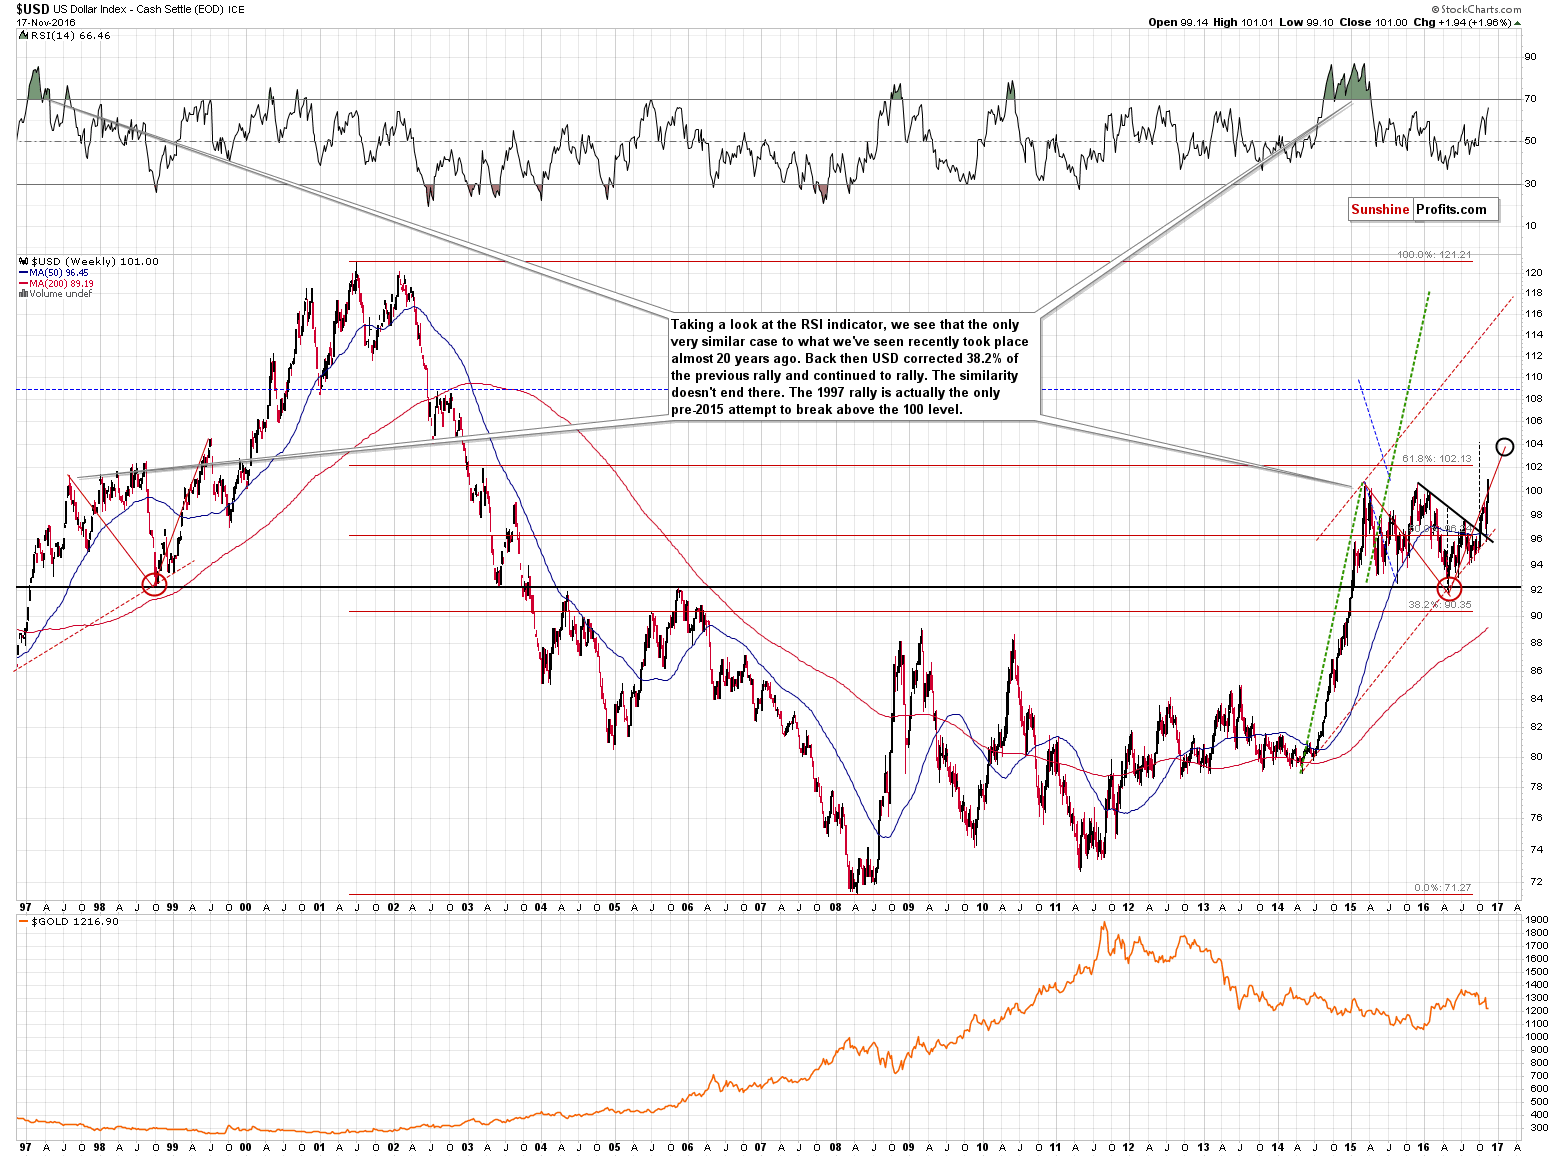
The very long-term chart. We discussed the above chart in the November 15 alert, but it’s very important to keep it in mind, so we’ll quote this analysis today:
The key chart to look at is the very long-term one. The key thing about yesterday’s session is that the USD Index reached the 100 level once again. That’s the third attempt of the USD Index to move above this level and it seems likely that… It will actually succeed this time. However, this is not widely expected. People remember that 100 was unbreakable in the recent history and that the rally preceding it was sharp. Thus, one can really expect a corrective downswing from here. The problem is that when too many people believe in a certain scenario it’s unlikely to take place (in case of some markets, the same goes for “too perfect” chart patterns that everyone recognizes) and it seems that this is what we have right now. The above is quite vague, though, so it’s not a key bullish thing to focus on right now.
There are 2 other – more important – factors: the analogy to the 1999 rally and the symmetry between the previous big decline (the 2001 top – the 2009 bottom) and the current big rally (the 2009 bottom – now). We discussed the former thoroughly previously (and what we wrote previously remains up-to-date), so we’ll discuss the latter. We are in the part of the decline that is symmetrical to what we saw in late 2002 and early 2003. Back then the USD Index was breaking below 100 and now it’s breaking above it. What makes the symmetry so special right now? The time that it took between the breakdown below 100 and the middle of the symmetry (the 2009 bottom) is extremely close to the time between the 2009 bottom and the current moment. The previous attempts of the USD Index to break above 100 were likely unsuccessful because the time factor was not fulfilled. In other words, the USD Index had previously rallied too fast and too soon. The USD Index is now after an almost 2-year-long consolidation – it was definitely enough to cool down investors’ emotions after the huge 2014 – 2015 rally. Consequently, the USD Index can rally further and - based on the symmetrical analogy - it’s likely to.
If it weren’t for the situation visible on the long-term chart, we would be skeptical about the USD’s breakout and the implications for PMs. However, it seems much more likely that the long-term analogies and signs are not followed by many precious metals investors (if you know of an analyst or website that discussed the similarity between the current rally and the previous bottom, please let us know) and that the current breakout is not really taken into account. However, with each additional day when the USD closes above 100, people will become convinced that the breakout is indeed in and that another huge upswing has just started. It could take place today, on Monday or in the following days, but when it finally does happen, the resulting price moves in metals and miners could be sharp and huge. Therefore, it seems that having a position opened at this time is already justified from the risk to reward point of view.
Summing up, due to the USD’s ability to close for 4 consecutive days above the previous high (in terms of daily closing prices) and due to the breakout (and a daily close) above the 2015 intra-day high, its outlook became very bullish. Even thought it doesn’t appear obvious due to the limited (so far) reaction in metals and miners, the above has profound bearish implications for the precious metals sector for the coming weeks. The week is not over yet, so we could see a reversal, but it doesn’t seem likely. Once we see a weekly close above the previous 2015 high, the situation will improve further for the USD Index and deteriorate further for the precious metals sector.
As always, we will keep you – our subscribers – updated.
To summarize:
Trading capital (supplementary part of the portfolio; our opinion): Short positions (full position) in gold, silver and mining stocks are justified from the risk/reward perspective with the following entry prices, stop-loss orders and initial target price levels:
- Gold: initial target price: $1,006; stop-loss: $1,272, initial target price for the DGLD ETN: $73.19; stop-loss for the DGLD ETN $47.51
- Silver: initial target price: $13.12; stop-loss: $18.13, initial target price for the DSLV ETN: $39.78; stop-loss for the DSLV ETN $22.81
- Mining stocks (price levels for the GDX ETF): initial target price: $9.34; stop-loss: $23.12, initial target price for the DUST ETF: $297; stop-loss for the DUST ETF $38.52
In case one wants to bet on junior mining stocks' prices (we do not suggest doing so – we think senior mining stocks are more predictable in the case of short-term trades – if one wants to do it anyway, we provide the details), here are the stop-loss details and initial target prices:
- GDXJ ETF: initial target price: $14.13; stop-loss: $38.23
- JDST ETF: initial target price: $245; stop-loss: $26.58
Long-term capital (core part of the portfolio; our opinion): No positions (in other words: cash)
Insurance capital (core part of the portfolio; our opinion): Full position
Plus, you might want to read why our stop-loss orders are usually relatively far from the current price.
Please note that a full position doesn’t mean using all of the capital for a given trade. You will find details on our thoughts on gold portfolio structuring in the Key Insights section on our website.
As a reminder – “initial target price” means exactly that – an “initial” one, it’s not a price level at which we suggest closing positions. If this becomes the case (like it did in the previous trade) we will refer to these levels as levels of exit orders (exactly as we’ve done previously). Stop-loss levels, however, are naturally not “initial”, but something that, in our opinion, might be entered as an order.
Since it is impossible to synchronize target prices and stop-loss levels for all the ETFs and ETNs with the main markets that we provide these levels for (gold, silver and mining stocks – the GDX ETF), the stop-loss levels and target prices for other ETNs and ETF (among other: UGLD, DGLD, USLV, DSLV, NUGT, DUST, JNUG, JDST) are provided as supplementary, and not as “final”. This means that if a stop-loss or a target level is reached for any of the “additional instruments” (DGLD for instance), but not for the “main instrument” (gold in this case), we will view positions in both gold and DGLD as still open and the stop-loss for DGLD would have to be moved lower. On the other hand, if gold moves to a stop-loss level but DGLD doesn’t, then we will view both positions (in gold and DGLD) as closed. In other words, since it’s not possible to be 100% certain that each related instrument moves to a given level when the underlying instrument does, we can’t provide levels that would be binding. The levels that we do provide are our best estimate of the levels that will correspond to the levels in the underlying assets, but it will be the underlying assets that one will need to focus on regarding the signs pointing to closing a given position or keeping it open. We might adjust the levels in the “additional instruments” without adjusting the levels in the “main instruments”, which will simply mean that we have improved our estimation of these levels, not that we changed our outlook on the markets. We are already working on a tool that would update these levels on a daily basis for the most popular ETFs, ETNs and individual mining stocks.
Our preferred ways to invest in and to trade gold along with the reasoning can be found in the how to buy gold section. Additionally, our preferred ETFs and ETNs can be found in our Gold & Silver ETF Ranking.
As always, we'll keep you - our subscribers - updated should our views on the market change. We will continue to send out Gold & Silver Trading Alerts on each trading day and we will send additional Alerts whenever appropriate.
The trading position presented above is the netted version of positions based on subjective signals (opinion) from your Editor, and the Tools and Indicators.
As a reminder, Gold & Silver Trading Alerts are posted before or on each trading day (we usually post them before the opening bell, but we don't promise doing that each day). If there's anything urgent, we will send you an additional small alert before posting the main one.
=====
Latest Free Trading Alerts:
Are Japanese Yen and Gold Moving in Tandem?
There is a growing conviction that both gold and the Japanese yen behave like safe havens, but is this really the case? We invite you to read our today’s article about the relationship between the yellow metal and the USD/JPY exchange rate and find out how the Japanese currency affects the gold market.
=====
Hand-picked precious-metals-related links:
Gold-Fund Holdings Slide for Fifth Day as Rate Concerns Mount
Gold Prices Give Up Gains as Dollar Strengthens
=====
In other news:
Obama Reckons with a Trump Presidency
Janet Yellen: US Fed could raise interest rates 'soon'
=====
Thank you.
Sincerely,
Przemyslaw Radomski, CFA
Founder, Editor-in-chief, Gold & Silver Fund Manager
Gold & Silver Trading Alerts
Forex Trading Alerts
Oil Investment Updates
Oil Trading Alerts

