

Briefly: In our opinion, speculative long (full) positions in gold, silver and mining stocks are justified from the risk/reward perspective.
Gold, silver and mining stocks once again showed strength by not declining on Friday, while the USD Index rallied and once again we are reporting that this is a bullish sing. When the USD Index finally does decline (after all, no market can move in a single line forever), precious metals are likely to rally. So, is there anything new that we can discuss today? Yes – there are more markets that need to be taken into account while estimating the outlook than just metals, miners and the USD Index and in today’s alert we also discuss one of them – copper.
Before discussing the latter, let’s review the latest changes in metals and miners (charts courtesy of http://stockcharts.com).
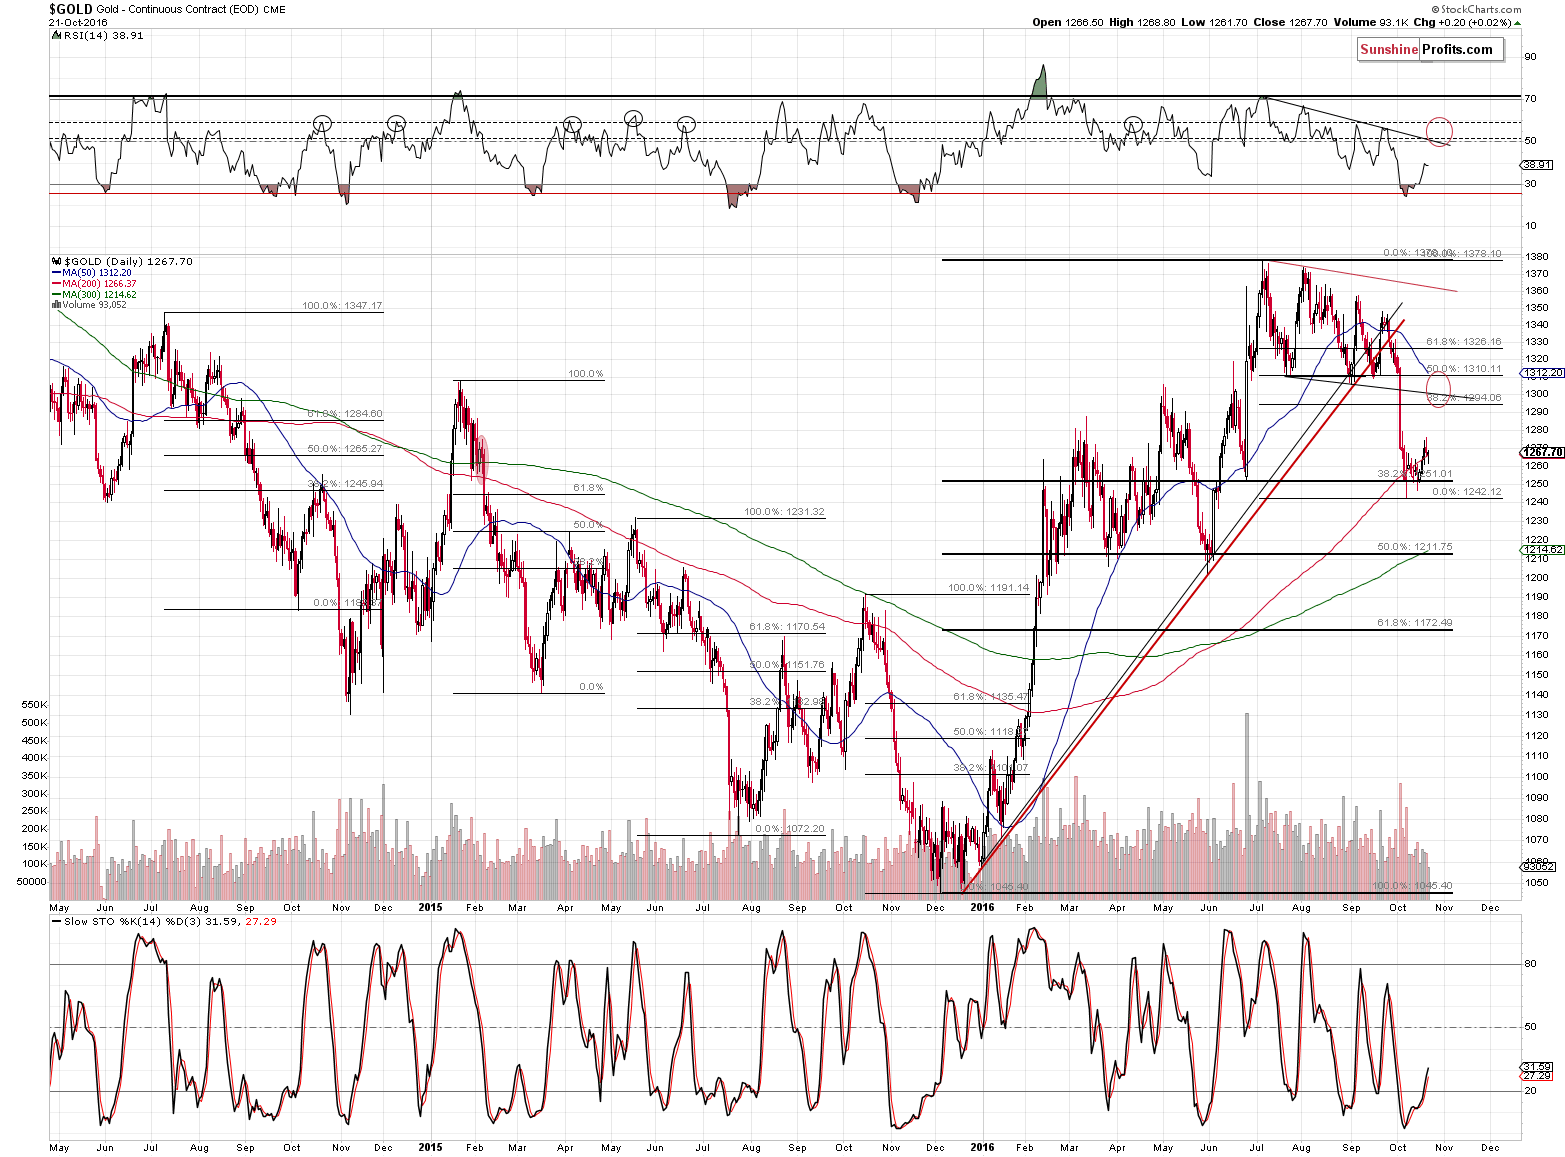
As far as gold is concerned, nothing really happened and our previous comments remain up-to-date:
It seems that gold will move to the $1,295 - $1,310 area before the rally is over. Why there? Because a rally – in general – is likely to remain in place until it approaches some kind of resistance level. There is no meaningful resistance below $1,294. The latter is created by the 38.2% Fibonacci retracement level based on the July – October decline, the second resistance is the declining line based on the July and August lows and the third one is provided by the 50% retracement.
Moreover, by the time gold gets to these levels, the odds are that the 50-day moving average (given the pace at which it declines) will be more or less at the $1,310 as well.
Which of these levels will stop the rally? It’s unclear at this time, but it will likely become clearer as gold moves higher and we see target areas being reached in other markets along with other bearish signs. One of the confirmations would be a move of the RSI indicator to the 50-60 area as that’s what we’ve seen quite often at previous local tops.
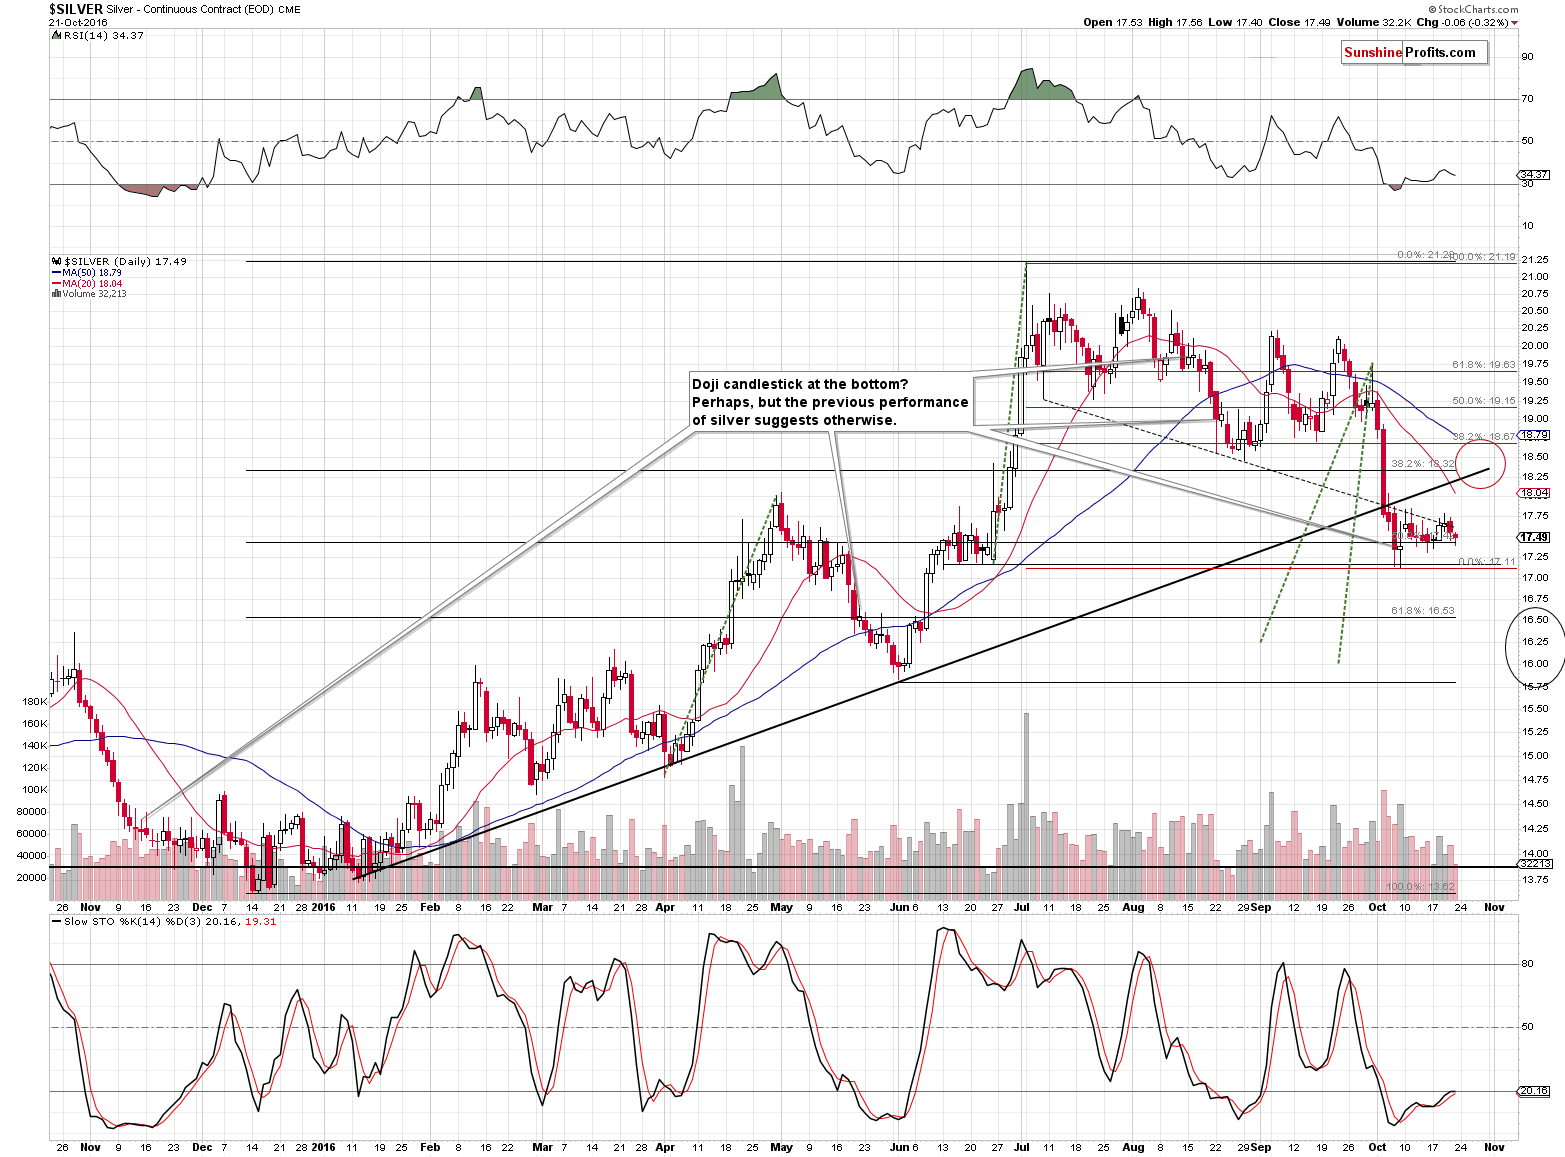
Silver’s chart features even less changes than the gold chart. Silver moved back and forth in the previous several days. The bullish thing about it is that it didn’t decline despite the USD’s rally, which is bullish as it’s a sign of strength. Another thing worth mentioning is that silver didn’t outperform gold, which means that there was no indication that the top was already in.
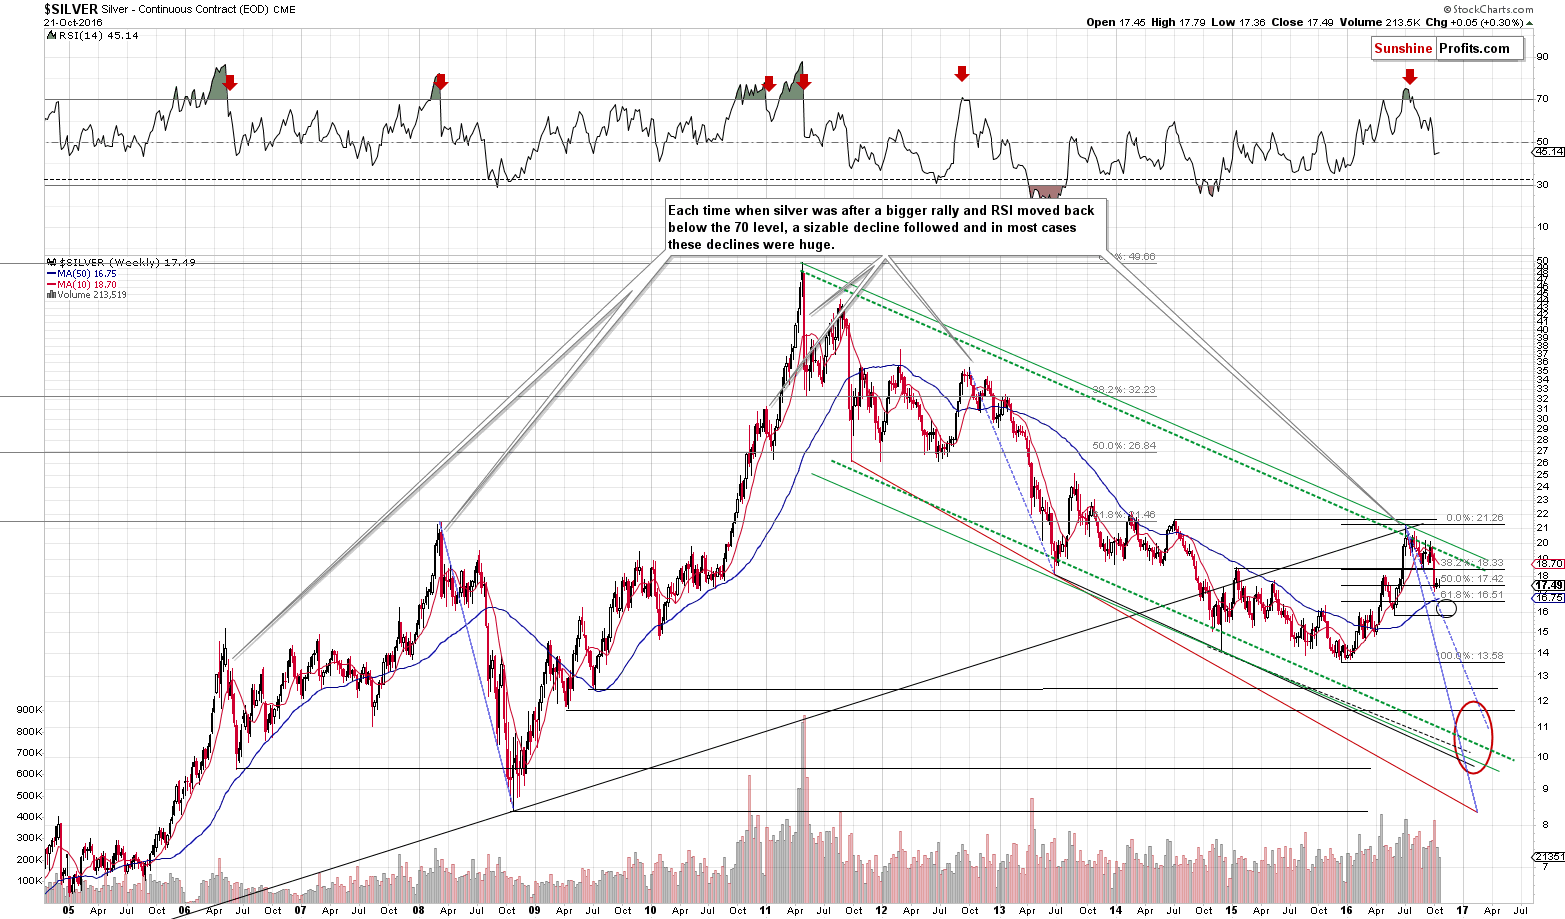
We added blue lines on the above chart (solid and dashed ones) that show the analogy between the 2008 and 2012 – 2013 declines and the one that started earlier this year. We added them to show that the expectation for silver to reach very low levels in the coming months is not only not unreasonable, but actually in tune with historical norms. If the current slide is like the 2008 one, then silver could slide even below $9 in the first quarter of 2017 – perhaps even in January or February. Sounds crazy? It’s certainly possible – was silver below $9 crazy back in early 2008 when it was trading above $20? Naturally – and yet it happened.
The above is not our official prediction, though – we’re just mentioning a possibility. It seems more likely that silver will bottom in the red ellipse – between $10 and $12. Silver below $10 would be an extremely favorable buying opportunity regardless of whether it were to move below $9 or not.
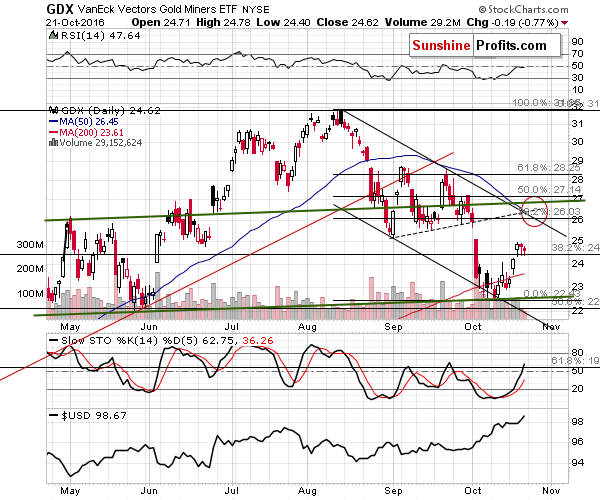
Mining stocks moved a bit lower on Friday and – similarly to what we had seen on Thursday – once again the volume was very low. This suggests that the tiny decline is a pause within a rally – it’s not a bearish sign, but a bullish one.
Since the short-term outlook was already bullish, nothing really changed.
Having said that, let’s move to the copper market.
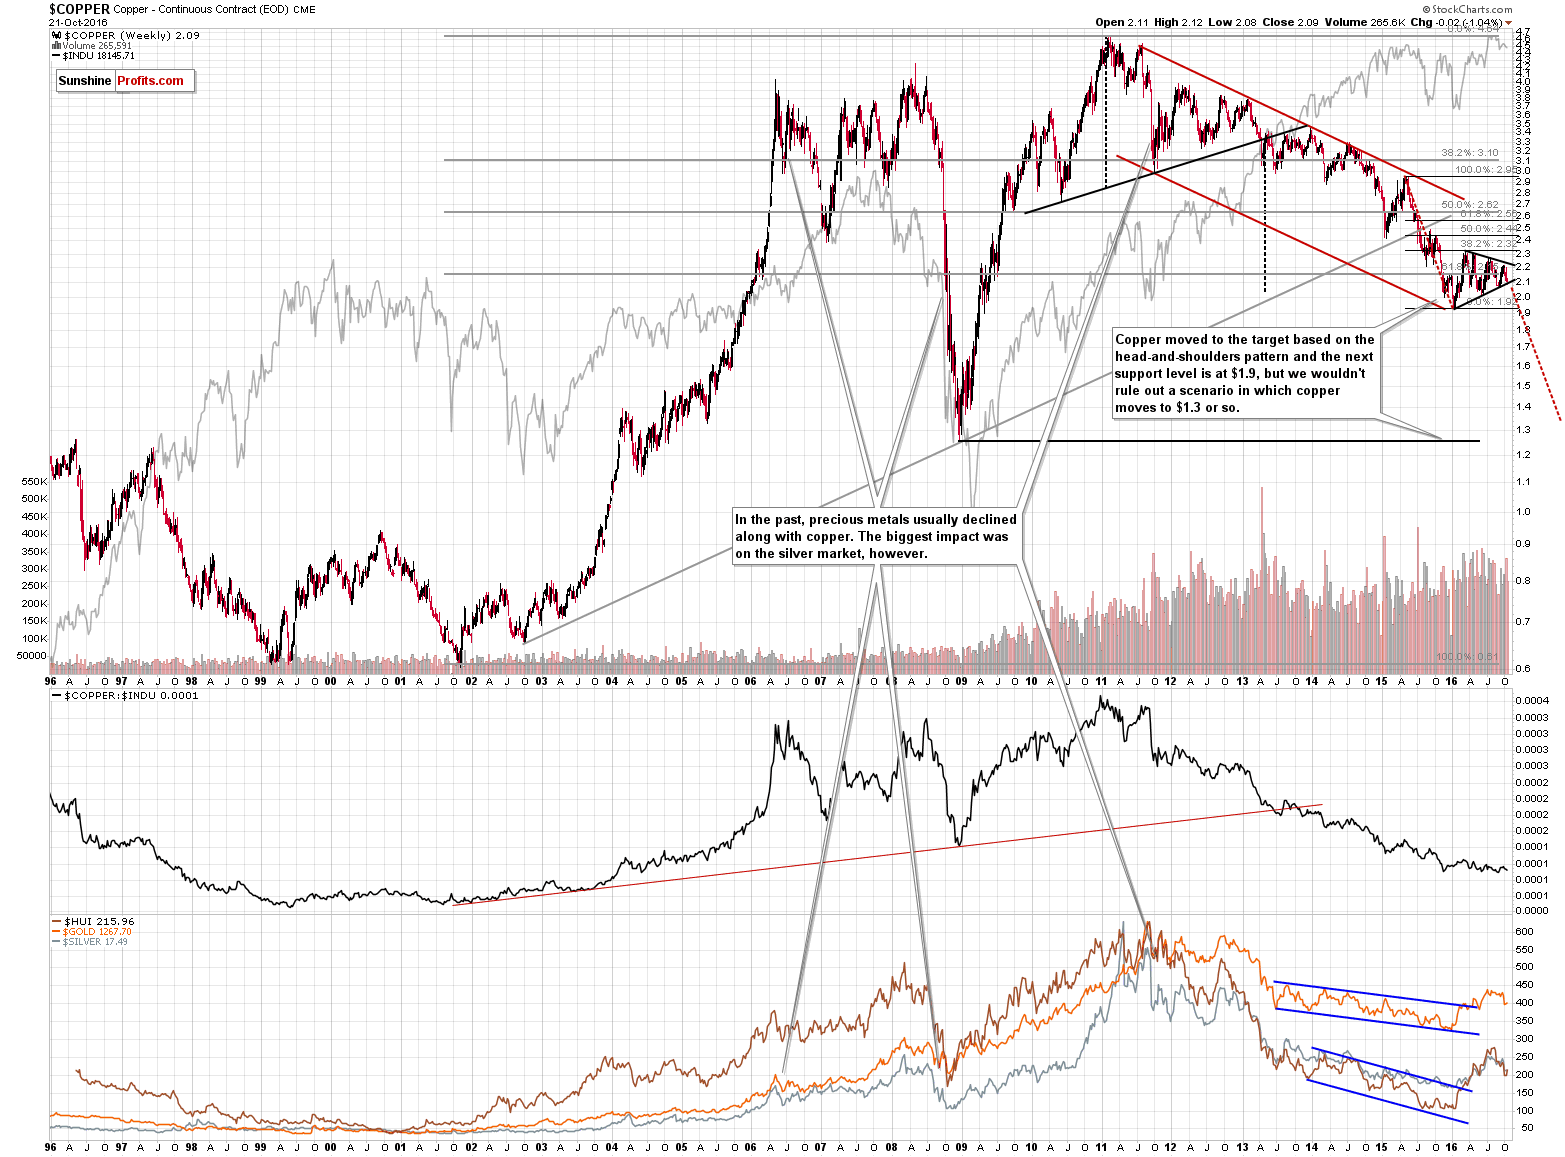
First of all, please note how the 2010 – 2013 head-and-shoulders pattern worked. That’s a good illustration of what we wrote on Friday about the USD Index and its big reverse-head-and-shoulders pattern. The height of the head (dashed black line) plotted on the breakdown provided the price target (close to the 2.0 level) even though it was reached over 2 years after the breakdown.
The mentioned bottom formed at the end of 2015, just like the bottom in the precious metals sector. However, the similarity doesn’t end there. The 2011 top was quite aligned with the one seen in the HUI Index and so was the 2008 bottom. There are more examples, but to make a long story short, let’s just say that major moves are in tune in copper and the PM sector.
Why is the above significant? Because the copper market declined substantially in 2015 and spend this year consolidating. The shape of the consolidation is a triangle, which is generally a continuation pattern. As it is the case with many other consolidation patterns, the size of the move that preceded the consolidation is likely to be similar to the size of the move that follows it. Based on the above, we created the red dashed lines and based on this technique, copper is likely to slide all the way down to the 1.3 level. That’s nothing new for those who have been following our analyses for years, but since we have a lot of new subscribers as well, we thought that it would be useful to remind about this situation.
The 1.3 level is also very close to the 2008 bottom, so if copper indeed gets that low, it’s likely that we’ll see a big reversal from there (which would be a very bullish sign for PMs as well). However, the thing that is most important at this time, is the likely proximity of the decline’s start. Copper is on the verge of breaking below the lower border of the triangle pattern and once it does (and the breakdown is confirmed), the huge slide will most likely be underway. In light of the mentioned link between copper and PMs, that’s likely to have a very bearish impact on the prices of gold, silver and mining stocks.
Will copper slide immediately? We have seen a breakdown below the triangle pattern if it is based on daily closing prices and we haven’t seen one if it is based on intra-day lows. All in all, the breakdown is not confirmed so far. If the USD Index declines, it could give copper additional several days (or a few weeks, but we don’t expect to see much beyond that) of strength, which would postpone the breakdown and the subsequent decline.
What does the above imply? That copper is very close to providing us with a very bearish medium-term sell signal. If it doesn’t happen right away, it’s still likely to happen sooner rather than later (after the USD corrects and moves back up). The implications for the current moment are rather non-existent, but the implications for the coming months are very bearish.
Summing up, while the short-term indications for the precious metals sector remain bullish, the medium-term trend remains bearish and it seems that the copper market will provide us with a very strong bearish confirmation in the coming weeks. Meanwhile, it seems that the profits on our long positions will increase further before the trade is over and the downtrend resumes. As always – we will keep you – our subscribers – updated.
To summarize:
Trading capital (supplementary part of the portfolio; our opinion): Long positions (100% of the full position) in gold, silver and mining stocks are justified from the risk/reward perspective with the following stop-loss orders and initial target price levels:
- Gold: initial target price: $1,295; stop-loss: $1,237, initial target price for the UGLD ETN: $12.47; stop-loss for the UGLD ETN $10.23
- Silver: initial target price: $18.45; stop-loss: $16.88, initial target price for the USLV ETN: $19.78; stop-loss for the USLV ETN $14.67
- Mining stocks (price levels for the GDX ETF): initial target price: $25.77; stop-loss: $21.77, initial target price for the NUGT ETF: $17.38; stop-loss for the NUGT ETF $9.77
In case one wants to bet on junior mining stocks' prices (we do not suggest doing so – we think senior mining stocks are more predictable in the case of short-term trades – if one wants to do it anyway, we provide the details), here are the stop-loss details and initial target prices:
- GDXJ ETF: initial target price: $43.87; stop-loss: $35.86
- JNUG ETF: initial target price: $15.87; stop-loss: $8.78
Long-term capital (core part of the portfolio; our opinion): No positions
Insurance capital (core part of the portfolio; our opinion): Full position
Plus, you might want to read why our stop-loss orders are usually relatively far from the current price.
Please note that a full position doesn’t mean using all of the capital for a given trade. You will find details on our thoughts on gold portfolio structuring in the Key Insights section on our website.
As a reminder – “initial target price” means exactly that – an “initial” one, it’s not a price level at which we suggest closing positions. If this becomes the case (like it did in the previous trade) we will refer to these levels as levels of exit orders (exactly as we’ve done previously). Stop-loss levels, however, are naturally not “initial”, but something that, in our opinion, might be entered as an order.
Since it is impossible to synchronize target prices and stop-loss levels for all the ETFs and ETNs with the main markets that we provide these levels for (gold, silver and mining stocks – the GDX ETF), the stop-loss levels and target prices for other ETNs and ETF (among other: UGLD, DGLD, USLV, DSLV, NUGT, DUST, JNUG, JDST) are provided as supplementary, and not as “final”. This means that if a stop-loss or a target level is reached for any of the “additional instruments” (DGLD for instance), but not for the “main instrument” (gold in this case), we will view positions in both gold and DGLD as still open and the stop-loss for DGLD would have to be moved lower. On the other hand, if gold moves to a stop-loss level but DGLD doesn’t, then we will view both positions (in gold and DGLD) as closed. In other words, since it’s not possible to be 100% certain that each related instrument moves to a given level when the underlying instrument does, we can’t provide levels that would be binding. The levels that we do provide are our best estimate of the levels that will correspond to the levels in the underlying assets, but it will be the underlying assets that one will need to focus on regarding the signs pointing to closing a given position or keeping it open. We might adjust the levels in the “additional instruments” without adjusting the levels in the “main instruments”, which will simply mean that we have improved our estimation of these levels, not that we changed our outlook on the markets. We are already working on a tool that would update these levels on a daily basis for the most popular ETFs, ETNs and individual mining stocks.
Our preferred ways to invest in and to trade gold along with the reasoning can be found in the how to buy gold section. Additionally, our preferred ETFs and ETNs can be found in our Gold & Silver ETF Ranking.
As always, we'll keep you - our subscribers - updated should our views on the market change. We will continue to send out Gold & Silver Trading Alerts on each trading day and we will send additional Alerts whenever appropriate.
The trading position presented above is the netted version of positions based on subjective signals (opinion) from your Editor, and the Tools and Indicators.
As a reminder, Gold & Silver Trading Alerts are posted before or on each trading day (we usually post them before the opening bell, but we don't promise doing that each day). If there's anything urgent, we will send you an additional small alert before posting the main one.
=====
Latest Free Trading Alerts:
There are only two weeks left before the U.S. presidential election. What are the current odds of both candidates and what do they mean for the gold market?
Gold Two Weeks before U.S. Presidential Election
S&P 500 index remained within a short-term consolidation on Friday. Will it break out today? Is holding short position still justified?
Stock Trading Alert: Positive Expectations, Will Stocks Continue Higher?
=====
Hand-picked precious-metals-related links:
Gold may regain ground in 2017 but 'bumpy road' ahead - Reuters poll
Mark Mobius says gold will gain in 2017 as Fed goes slow on hikes
India's Best Monsoon in 3 Years
Gold price: Hedge funds abandoning market at record pace
=====
In other news:
Brexit Bulletin: Bankers Prepare for Exodus From London
Chinese state-owned banks seen selling dollars to shore up yuan
German inflation could exceed 1 percent at year-end: Bundesbank
Dr Doom Marc Faber on why commodity prices will rise, oil to hit $70 soon
Oil prices under pressure as Iraq resists joining output cut
The EU's signature free trade deal is on life support
=====
Thank you.
Sincerely,
Przemyslaw Radomski, CFA
Founder, Editor-in-chief, Gold & Silver Fund Manager
Gold & Silver Trading Alerts
Forex Trading Alerts
Oil Investment Updates
Oil Trading Alerts

