

Briefly: In our opinion, speculative long (full) positions in gold, silver and mining stocks are justified from the risk/reward perspective.
We’ve been writing about the cyclical turning point in the USD Index for some time now and we didn’t have to wait long for this technique to become useful once again. The turning point was October 13 and that’s exactly when the USD Index reversed. Still, gold and silver didn’t soar – does this mean that there will be no rally in metals as the USD corrects?
In short, that’s most likely not the case. Let’s take a look at the USD Index chart (charts courtesy of http://stockcharts.com).
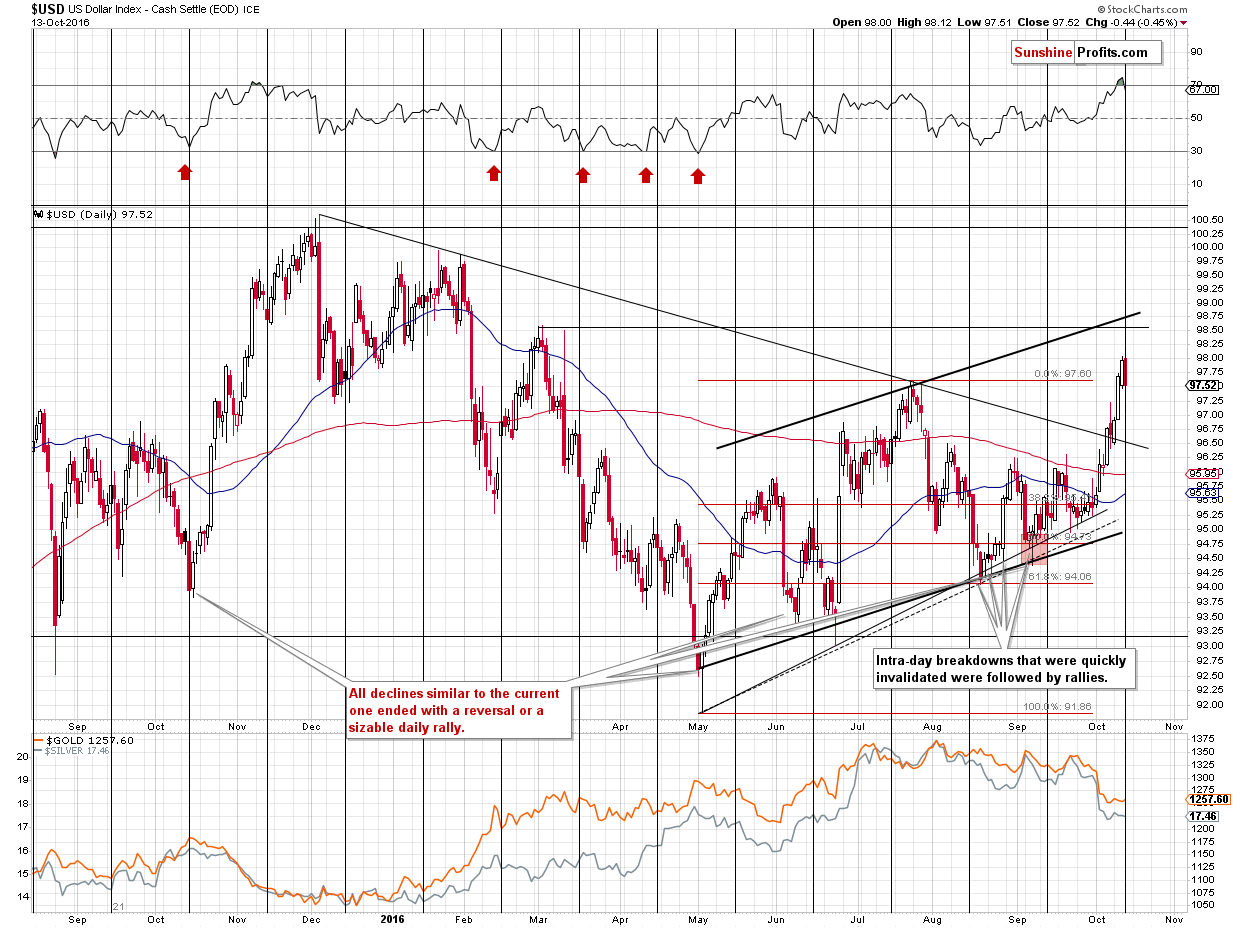
We previously wrote that the precious metals tend to react more to breakouts and breakdowns in the USD Index than to any other kind of movement and this has most likely not changed. That’s important right now as we just saw a breakout in the USD above the July highs. During yesterday’s session, the USD declined, but it closed the session above the highest daily closes of July. Consequently, the previous breakout was not really invalidated. Without invalidation, one can view the breakout as confirmed, which doesn’t have bearish implications for the USD, but bullish ones.
In light of the precious metals traders’ wait-and-see attitude, this is not surprising. What does the above imply for the near future? The same that we described previously – the overall implications didn’t change:
The USD Index soared yesterday in a sharp manner and moved a bit above the July highs – we saw a breakout, but since the move is tiny, the breakout is not confirmed. Consequently, we are still likely to see a reversal relatively soon, or a pause. The former is more likely due to the proximity of the cyclical turning point.
Moreover, please note that the RSI Indicator just moved above the 70 level, which generally suggests that a turnaround is likely. Back in November 2015, when we saw such a development, the USD corrected, but it wasn’t the end of the rally, so the implications are bearish, but only for the short term.
At this time, we expect the USD Index to correct to the declining black support line and verify it as such by not moving lower. At this moment, the support line is at about 96.50. An important note here is that the cyclical turning points work on a near-to basis, so we could still see some strength this week, even though a bigger correction is looming.
What’s the likely impact on the precious metals sector? Gold, silver and mining stocks seem to have stopped replying to the dollar’s rally and unless they start to do so again, the implications will be bullish for PMs.
(…)
If gold and silver don’t want to respond to USD’s rally, they are quite likely to respond to USD’s decline (the above indicates that people don’t seem to be willing to sell at this time, which means that buyer can easily outnumber them).
In addition to the above, we just saw a confirmation (third consecutive close) of the breakout above the declining black line. This line stopped the rally in July (which was the biggest rally in the USD this year) and we just saw a confirmed breakout above it, which is a big deal. As discussed earlier, the cyclical turning point is just around the corner, so the USD may not be able to rally very high (the July tops seem to be a probable target) before a turnaround and a corrective decline, but still, the outlook for the following weeks has just improved. This means that the implications for the precious metals sector became more bearish for the following weeks, but at the same time, we could see a rebound in PMs and miners as the USD corrects.
(…)
The USD Index can move even higher from here – to 98.50 (the March high) or even 98.75 (the rising support line), but it doesn’t change much – it’s still likely to reverse based on the turning point and metals and miners are likely not to react to higher USD prices, but to respond to lower prices.
All in all, we are not ruling out another very quick move up before the correction starts, but that doesn’t seem to matter as much as the mentioned gold-USD link.
Since practically nothing happened in gold and silver, let’s take a look at mining stocks.
Miners moved higher, but a large part of the rally was erased before the session was over. The volume was not huge, so it doesn’t appear to be a meaningful reversal (with bearish implications). Overall, the above doesn’t change anything – miners outperformed metals once again, which is bullish, but they didn’t soar much, which is understandable given the fact that we didn’t see the invalidation of a breakout in the USD Index.
All in all, our previous comments on mining stocks remain up-to-date:
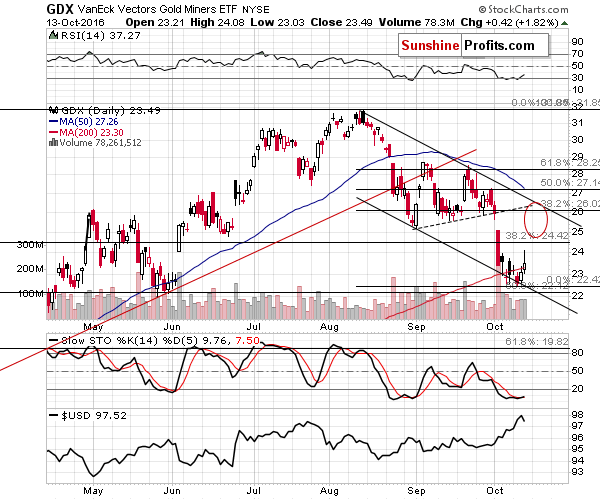
Miners reached their support level created by the lower border of the declining trend channel – another way to view it is that the October decline is similar to the August one. If this similarity is to continue, then miners are likely to rally rather quickly, similarly to what happened in early September.
Moreover, please note that it took 5 trading days from the most volatile drop of the previous decline (August 24) to the final short-term bottom (August 31). The most volatile drop in this decline took place on October 4th. Adding 5 trading days gives us October 11th as the target date for a bottom. Consequently, if it hadn’t been for the USD’s yesterday’s rally, we might have already seen miners soar. In other words, the USD’s rally likely postponed the miners’ rally and provided us with a bullish confirmation.
The volume that we saw yesterday was not huge, but it was a bit higher than what we saw during Tuesday’s decline, which is a small bullish sign as well.
So, how high will miners go? The red ellipse is our target area for this quick rally and it’s based on the upper border of the declining trend channel, the previous rising support line (which now serves as resistance), the 38.2% Fibonacci retracement level based on the August – October decline (at about $26) and the August low (close to $25). Which of these levels is most probable? At this time, we think that the $26 level (also being a round number) is the most probable target, but we’ll be revisiting this issue daily and we will likely close the current long positions once we see some bearish signs – based not only on the price level that will be reached.
Summing up, it seems that even though precious metals remain in a medium-term downtrend, a short-term rally is very likely before the decline continues. Based on this week’s strength of the entire precious metals sector in light of the USD’s rally and miners’ strength in light of both the lack of rally in gold and the rally in the USD, it seems that the risk to reward ratio favors speculative long positions.
As always, we will keep you – our subscribers – updated.
To summarize:
Trading capital (supplementary part of the portfolio; our opinion): Long positions (100% of the full position) in gold, silver and mining stocks are justified from the risk/reward perspective with the following stop-loss orders and initial target price levels:
- Gold: initial target price: $1,295; stop-loss: $1,237, initial target price for the UGLD ETN: $12.47; stop-loss for the UGLD ETN $10.23
- Silver: initial target price: $18.45; stop-loss: $16.88, initial target price for the USLV ETN: $19.78; stop-loss for the USLV ETN $14.67
- Mining stocks (price levels for the GDX ETF): initial target price: $25.77; stop-loss: $21.77, initial target price for the NUGT ETF: $17.38; stop-loss for the NUGT ETF $9.77
In case one wants to bet on junior mining stocks' prices (we do not suggest doing so – we think senior mining stocks are more predictable in the case of short-term trades – if one wants to do it anyway, we provide the details), here are the stop-loss details and initial target prices:
- GDXJ ETF: initial target price: $43.87; stop-loss: $35.86
- JNUG ETF: initial target price: $15.87; stop-loss: $8.78
Long-term capital (core part of the portfolio; our opinion): No positions
Insurance capital (core part of the portfolio; our opinion): Full position
Plus, you might want to read why our stop-loss orders are usually relatively far from the current price.
Please note that a full position doesn’t mean using all of the capital for a given trade. You will find details on our thoughts on gold portfolio structuring in the Key Insights section on our website.
As a reminder – “initial target price” means exactly that – an “initial” one, it’s not a price level at which we suggest closing positions. If this becomes the case (like it did in the previous trade) we will refer to these levels as levels of exit orders (exactly as we’ve done previously). Stop-loss levels, however, are naturally not “initial”, but something that, in our opinion, might be entered as an order.
Since it is impossible to synchronize target prices and stop-loss levels for all the ETFs and ETNs with the main markets that we provide these levels for (gold, silver and mining stocks – the GDX ETF), the stop-loss levels and target prices for other ETNs and ETF (among other: UGLD, DGLD, USLV, DSLV, NUGT, DUST, JNUG, JDST) are provided as supplementary, and not as “final”. This means that if a stop-loss or a target level is reached for any of the “additional instruments” (DGLD for instance), but not for the “main instrument” (gold in this case), we will view positions in both gold and DGLD as still open and the stop-loss for DGLD would have to be moved lower. On the other hand, if gold moves to a stop-loss level but DGLD doesn’t, then we will view both positions (in gold and DGLD) as closed. In other words, since it’s not possible to be 100% certain that each related instrument moves to a given level when the underlying instrument does, we can’t provide levels that would be binding. The levels that we do provide are our best estimate of the levels that will correspond to the levels in the underlying assets, but it will be the underlying assets that one will need to focus on regarding the signs pointing to closing a given position or keeping it open. We might adjust the levels in the “additional instruments” without adjusting the levels in the “main instruments”, which will simply mean that we have improved our estimation of these levels, not that we changed our outlook on the markets. We are already working on a tool that would update these levels on a daily basis for the most popular ETFs, ETNs and individual mining stocks.
Our preferred ways to invest in and to trade gold along with the reasoning can be found in the how to buy gold section. Additionally, our preferred ETFs and ETNs can be found in our Gold & Silver ETF Ranking.
As always, we'll keep you - our subscribers - updated should our views on the market change. We will continue to send out Gold & Silver Trading Alerts on each trading day and we will send additional Alerts whenever appropriate.
The trading position presented above is the netted version of positions based on subjective signals (opinion) from your Editor, and the Tools and Indicators.
As a reminder, Gold & Silver Trading Alerts are posted before or on each trading day (we usually post them before the opening bell, but we don't promise doing that each day). If there's anything urgent, we will send you an additional small alert before posting the main one.
=====
Latest Free Trading Alerts:
Last week, the World Gold Council (WGC) released a market update entitled “Price drop likely to spur demand”. What are the main conclusions of the report?
Will Price Drop Spur Demand for Gold?
The Great Recession prompted central banks to adopt non-standard policies like quantitative easing and zero interest rates. The effectiveness of these tools in stimulating private credit expansion and economic growth is increasingly being questioned. This is why many economists and policymakers call for helicopter money. We invite you to read our today’s article about helicopter drops and find out how they could affect the gold market.
How Could Helicopter Money Affect the Gold Market?
=====
Hand-picked precious-metals-related links:
Gold is going back to $1,050 says Wells Fargo analyst
UBS: Gold is setting up for a big comeback
Strong Diwali Gold Buying Expected
How London’s Gold Market, the World’s Largest, Evolved Over Time
=====
In other news:
Land With Longest Stretch of Negative Rates Finds Rich Are Getting Richer Faster
Oil From $50 Billion Kashagan Field Starts Flowing to Export
Windfall for startups? Saudi Arabia backs new $100 billion tech fund
Goldman Sachs says copper is about to 'hit a wall of supply'
Stocks Rebound as Commodities Advance After China Alarm Subsides
China inflation relief sends stocks, dollar higher
UK PM May rejects suggestion by EU's Tusk that Brexit may not happen: spokeswoman
=====
Thank you.
Sincerely,
Przemyslaw Radomski, CFA
Founder, Editor-in-chief, Gold & Silver Fund Manager
Gold & Silver Trading Alerts
Forex Trading Alerts
Oil Investment Updates
Oil Trading Alerts

