

Briefly: In our opinion, short positions (full position) in gold, silver and mining stocks are justified from the risk/reward perspective.
In previous days we wrote quite a lot about gold’s performance, it’s price targets and possible price movement in the coming weeks. Naturally, the yellow metal will not move alone – it will move along with its sister metal - silver. What we can say about the silver market might support or invalidate points made about gold – after all, confirmations or lack thereof are very important.
Let’s jump right into charts (charts courtesy of http://stockcharts.com).
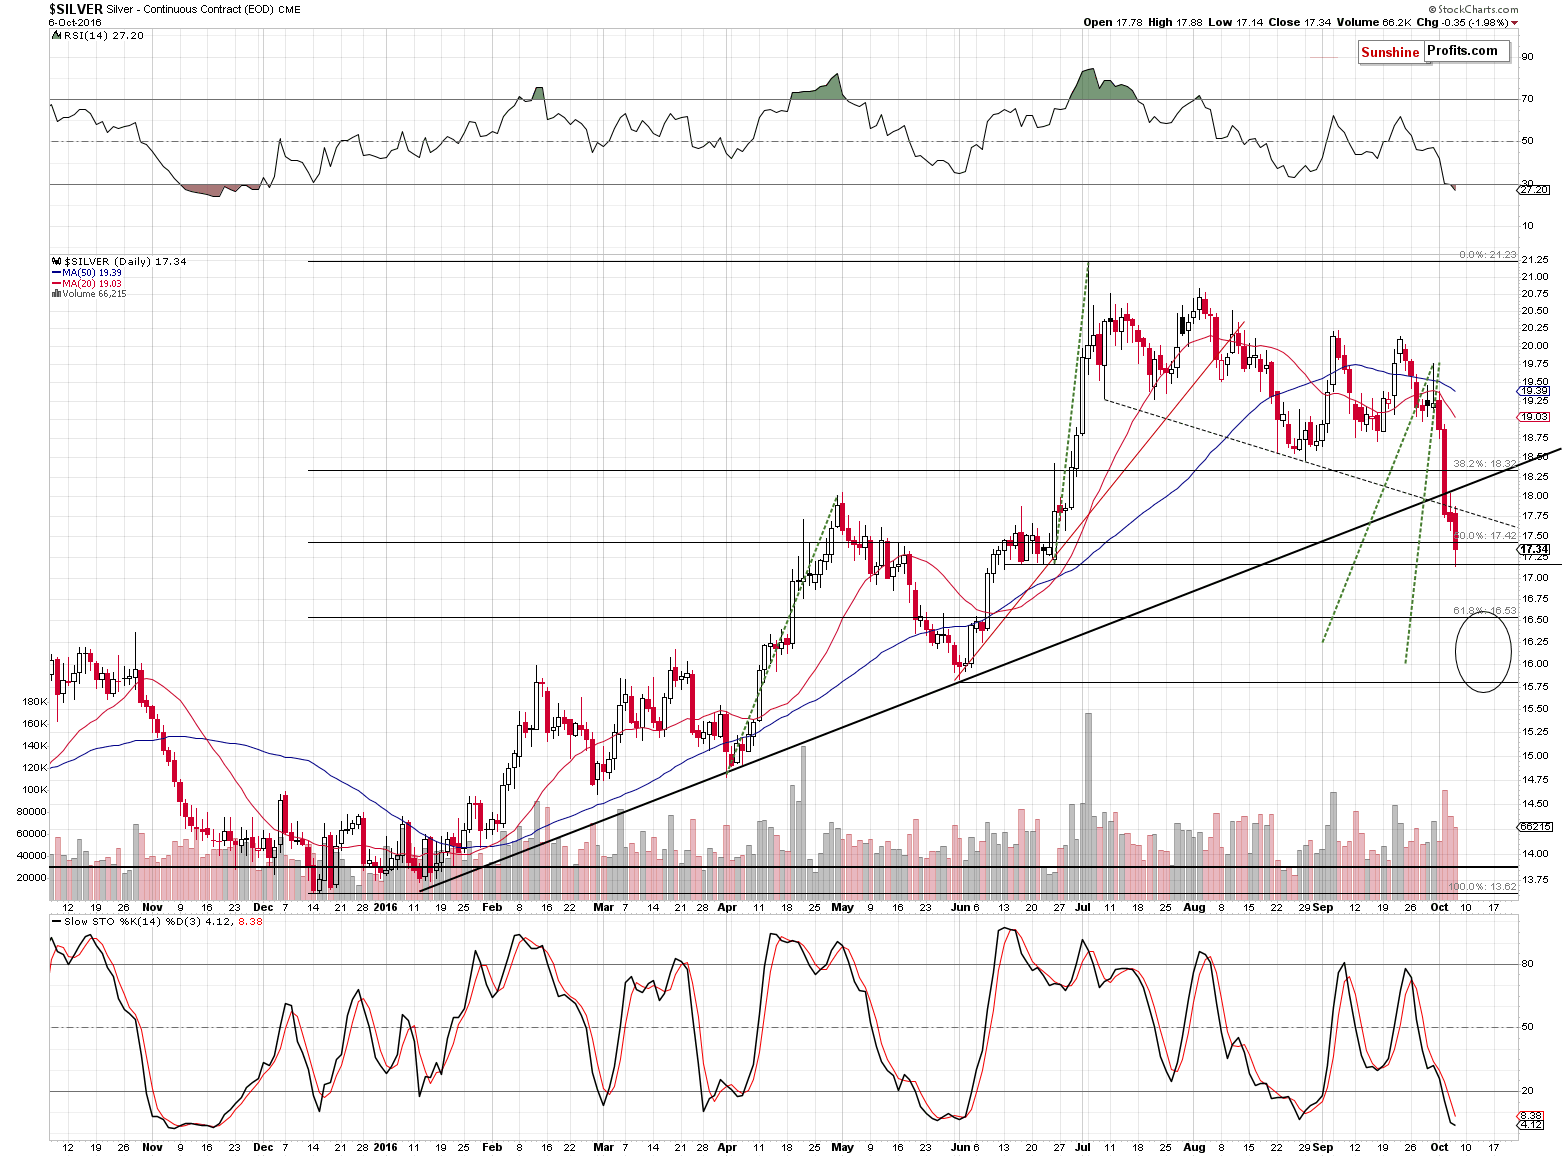
The above short-term chart shows quite a few interesting developments. Silver reached a support level just like gold did – in case of the white metal it was the series of June lows. Silver closed below the 50% Fibonacci retracement level based on the entire 2015 – 2016 rally, which is a bearish sign. This breakdown is not confirmed, so the implications are not significant, but another breakdown – is confirmed. Silver closed below the big rising medium-term support line for 3 consecutive trading days, so the breakdown is now confirmed. Moreover, the declines were accompanied by significant volume – another bearish confirmation.
However, since no market moves in a straight line, either up or down, there has to be a price level that generates a corrective upswing. In gold the closest price levels are about $1,250 and $1,200. In case of silver, we have a bit less clarity as the next support (we are at one at this time) is an area instead of one price level.
The area (black ellipse) ranges between about $15.80 and $16.50 as several techniques point to “somewhere there” as a likely target for the current price swing (not the end of the entire decline, but the end of it’s first big part).
One technique is quite simple and it’s based on Fibonacci retracements – with silver below the 50%, the next classic retracement becomes a natural target. The 61.8% Fibonacci retracement points to the upper border of the target range. Yes, we realize it may sound too simple to be true, but Fibonacci retracements are a tool that proves itself useful over and over again.
Another thing is that once the mid-June lows are broken, then the next important bottom is at about $15.80 – and that’s the lower part of the target area.
The $16 level provides support as well, just because it’s a round number. Sounds silly? Perhaps, but please note that $16 stopped rallies in February and March, $18 stopped the April rally, $21 (approximately) stopped the June – July rally and $20 stopped both September rallies.
Why would silver decline below the mid-June lows? Let’s take a look at the previous sharp (thus likely emotional) rallies: the April one and the June – July one – especially the latter one.
Very sharp rallies are usually driven by those who want to jump in the market as soon as possible, making the rally even more attractive (as they generate another price increase with their demand) for others who also jump in quickly and so on. The point is that these are emotional decisions and these investors / traders are likely to run from the market as soon as they get scared. They don’t buy due to the long-term potential of a given market, but because they want to gain on a price upswing – nothing more. What would scare these traders? The opposite to what attracted them in the first place – a big, sharp decline. Trading sideways and small declines are not really scary – they suggest that the market could still rally.
How can the above help us? If a given rally was really driven by speculators (more precisely: speculative capital), then a similar amount of speculators (precisely: speculative capital) should be expected to get out of the market when fear becomes the prevailing emotion. In other words – the sharp decline could be similar in size to the previous sharp rally / rallies.
Consequently, we marked the sizes of the previous sharp rallies with green dashed lines and we plotted them on the current decline. If the above analogy is correct, then we can really expect silver to move even lower before this part of the decline is over. The price targets based on these analogies are about $16 and $16.25.
The Stochastic indicator is below 10, but doesn’t imply an immediate rally here – it was there at the beginning of November 2015, in the second half of May 2016 and in late August 2016. An immediate rally followed only in the last case, so in 2 out of 3 cases, we saw an additional downswing before the bottom was seen.
The RSI indicator moved below the 30 level, which could appear bullish, but it’s not really the case. The only similar situation was in early November 2015 and at that time a decline followed, not a rally. Besides, the move that has begun is likely a medium-term one, not a short-term one, so a weekly version of the indicator should be more informative than the daily one.
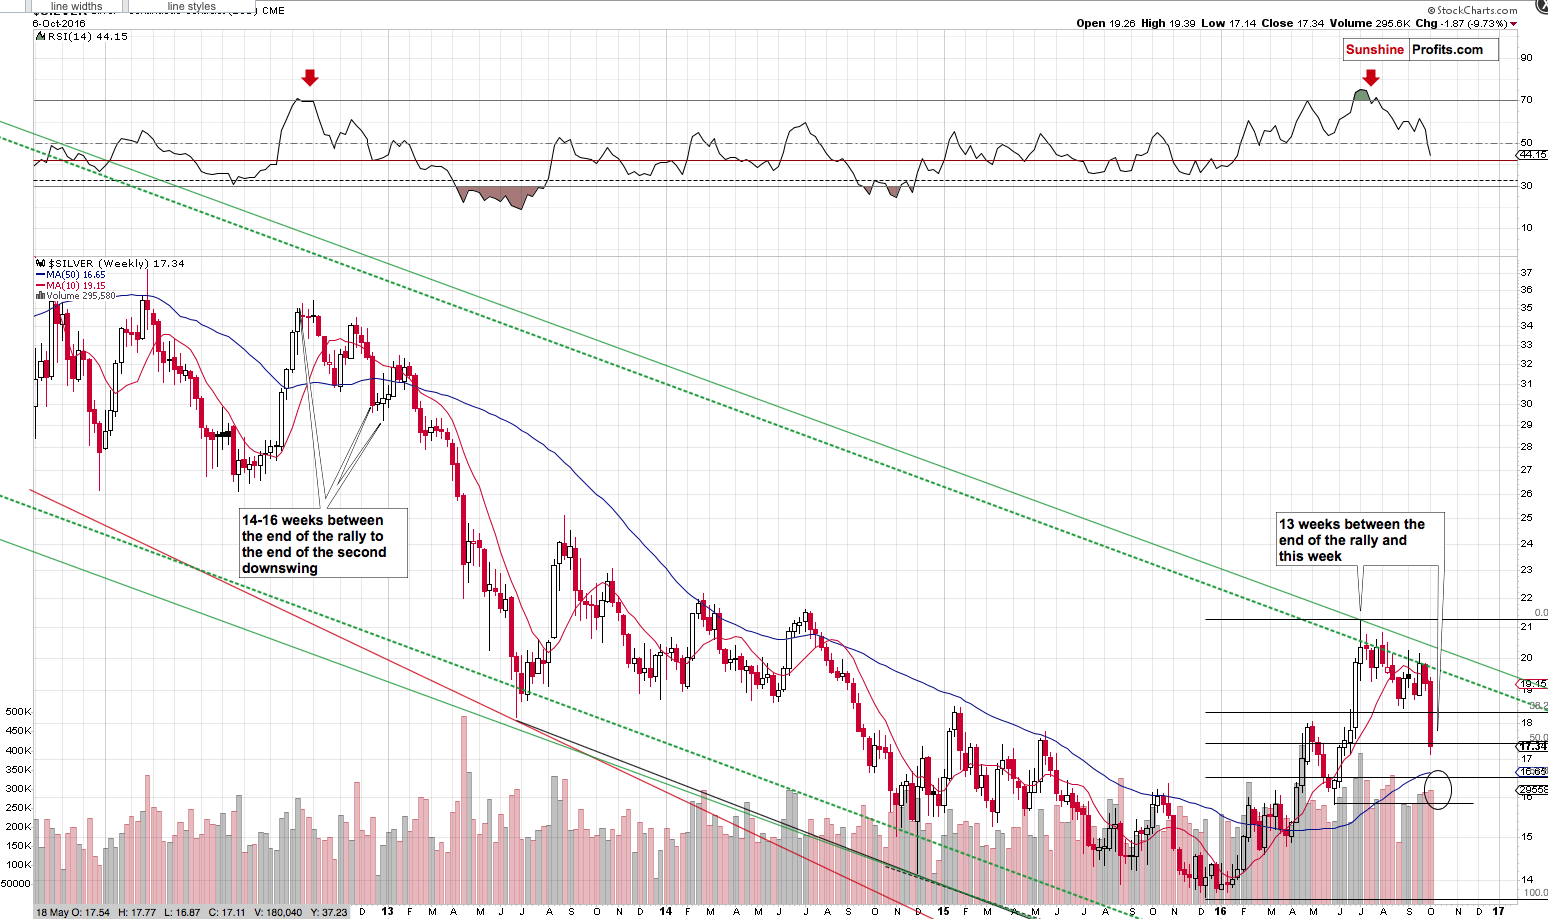
Zooming out and changing the type of chart to weekly (created using weekly candlesticks) changes the position of the RSI indicator. We can now see that comparing the current downswing to the previous medium-term ones does not have bullish implications.
The important thing about this decline is where it started – it started when silver topped with the RSI above 70. That’s not something that happens often and consequently it’s critical to check what tends to happen next once such a situation materializes. Long story short – silver declined after such cases, but the most important thing is that after the $50 top we saw only one similar case – the 2012 top and the 2012 – 2013 decline. Actually, we wrote about the similarity of these declines a few times in the past months. So far the analogy holds.
The late 2012 top and the 2016 top were followed by some sideways trading, then an initial small decline, then a rally close to the previous high. The sharp decline followed in both cases. In the past, silver was only one small (smaller than the previous ones) correction away from the big slide.
When and where did silver bottom in late 2012 before the final small correction? After 14 – 16 weeks (depending on how we define to bottom – weekly closing price or the intra-day price), below the 50-week moving average and with the RSI at about 40 (the dark red line on the chart).
Right now silver is in the 13th week of the decline, still above the 50-week moving average and the RSI is at 44. Silver appears to be relatively close to the bottom (the majority of the decline seems to be behind us) but may not be at it just yet.
Before summarizing, let’s briefly discuss the (lack of) reaction to the employment numbers that were released today. The statistics were worse then expected, which means that the precious metals sector is likely to respond with a rally – and we saw one, but the size of the upswing (and the fact that silver outperformed on an immediate-term basis) have actually bearish implications. It shows that PMs and miners may not be ready to rally just yet, which confirms points made about silver earlier today.
Summing up, it’s likely that the profits from the current short trade will become much bigger before the trade is completely over and “the bottom” is in. There will likely be interim bottoms along the way, but the closest likely price target for silver is still visibly lower than the current price. If silver slides to $15.80 - $16.50, we may have a good opportunity to take profits off the table and re-enter the short position at higher prices. We will be monitoring the market for opportunities and report to you accordingly.
As always, we will keep you – our subscribers – updated.
To summarize:
Trading capital (supplementary part of the portfolio; our opinion): Short positions (100% of the full position) in gold, silver and mining stocks are justified from the risk/reward perspective with the following entry prices, stop-loss orders and initial target price levels:
- Gold: initial target price: $1,006; stop-loss: $1,313, initial target price for the DGLD ETN: $73.19; stop-loss for the DGLD ETN $44.28
- Silver: initial target price: $13.12; stop-loss: $19.03, initial target price for the DSLV ETN: $39.78; stop-loss for the DSLV ETN $20.43
- Mining stocks (price levels for the GDX ETF): initial target price: $9.34; stop-loss: $25.87, initial target price for the DUST ETF: $297; stop-loss for the DUST ETF $34.78
In case one wants to bet on junior mining stocks' prices (we do not suggest doing so – we think senior mining stocks are more predictable in the case of short-term trades – if one wants to do it anyway, we provide the details), here are the stop-loss details and initial target prices:
- GDXJ ETF: initial target price: $14.13; stop-loss: $43.22
- JDST ETF: initial target price: $245; stop-loss: $25.47
Long-term capital (core part of the portfolio; our opinion): No positions
Insurance capital (core part of the portfolio; our opinion): Full position
Plus, you might want to read why our stop-loss orders are usually relatively far from the current price.
Please note that a full position doesn’t mean using all of the capital for a given trade. You will find details on our thoughts on gold portfolio structuring in the Key Insights section on our website.
As a reminder – “initial target price” means exactly that – an “initial” one, it’s not a price level at which we suggest closing positions. If this becomes the case (like it did in the previous trade) we will refer to these levels as levels of exit orders (exactly as we’ve done previously). Stop-loss levels, however, are naturally not “initial”, but something that, in our opinion, might be entered as an order.
Since it is impossible to synchronize target prices and stop-loss levels for all the ETFs and ETNs with the main markets that we provide these levels for (gold, silver and mining stocks – the GDX ETF), the stop-loss levels and target prices for other ETNs and ETF (among other: UGLD, DGLD, USLV, DSLV, NUGT, DUST, JNUG, JDST) are provided as supplementary, and not as “final”. This means that if a stop-loss or a target level is reached for any of the “additional instruments” (DGLD for instance), but not for the “main instrument” (gold in this case), we will view positions in both gold and DGLD as still open and the stop-loss for DGLD would have to be moved lower. On the other hand, if gold moves to a stop-loss level but DGLD doesn’t, then we will view both positions (in gold and DGLD) as closed. In other words, since it’s not possible to be 100% certain that each related instrument moves to a given level when the underlying instrument does, we can’t provide levels that would be binding. The levels that we do provide are our best estimate of the levels that will correspond to the levels in the underlying assets, but it will be the underlying assets that one will need to focus on regarding the signs pointing to closing a given position or keeping it open. We might adjust the levels in the “additional instruments” without adjusting the levels in the “main instruments”, which will simply mean that we have improved our estimation of these levels, not that we changed our outlook on the markets. We are already working on a tool that would update these levels on a daily basis for the most popular ETFs, ETNs and individual mining stocks.
Our preferred ways to invest in and to trade gold along with the reasoning can be found in the how to buy gold section. Additionally, our preferred ETFs and ETNs can be found in our Gold & Silver ETF Ranking.
As always, we'll keep you - our subscribers - updated should our views on the market change. We will continue to send out Gold & Silver Trading Alerts on each trading day and we will send additional Alerts whenever appropriate.
The trading position presented above is the netted version of positions based on subjective signals (opinion) from your Editor, and the Tools and Indicators.
As a reminder, Gold & Silver Trading Alerts are posted before or on each trading day (we usually post them before the opening bell, but we don't promise doing that each day). If there's anything urgent, we will send you an additional small alert before posting the main one.
=====
Latest Free Trading Alerts:
UK Prime Minister Theresa May is to trigger Article 50 by the end of March 2017. What does it imply for the gold market?
Last month, the Bank of Japan has introduced new unconventional measures. Will the Fed implement them as well? We invite you to read our today’s article about monetary weapons the Fed could use to stimulate the economy when the next recession strikes and find out how they could affect the gold market.
What Tools Does the Fed Have Left and How Could They Affect the Gold Market?
=====
Hand-picked precious-metals-related links:
BofA Says Buy World’s Worst Stock Market, Short Gold: Chart
Goldman Sees ‘Buying Opportunity’ If Gold’s Slump Gets Worse
Couldn’t Be A Better Time To Buy Gold – WGC
PRECIOUS-Gold steady ahead of jobs data after 5 pct weekly drop
Asia Gold-Demand rises on price drop; discounts in India at multi-month low
3.2 million oz of COMEX paper gold crashed the price on Tuesday
The world's largest gold project, just got a whole lot bigger
'Monetary supercycle' demise could add $1,000s to gold price
INFOGRAPHIC: The facts and figures that make space mining real
Lonmin can withstand current platinum prices, CEO Magara says
Dutch central bank to move gold reserves out of Amsterdam
=====
In other news:
U.S. job growth slows, clouds case for Fed rate hike
Wall Street eyes jobs report, Fed speakers
Two-Minute Mystery Pound Rout Puts Spotlight on Robot Trades
U.K. pound plunges more than 6% in mysterious flash crash
Deutsche Bank capital-raising rumors swirl as shares push higher
=====
Thank you.
Sincerely,
Przemyslaw Radomski, CFA
Founder, Editor-in-chief, Gold & Silver Fund Manager
Gold & Silver Trading Alerts
Forex Trading Alerts
Oil Investment Updates
Oil Trading Alerts

