

Briefly: In our opinion, no speculative positions in gold, silver and mining stocks are justified from the risk/reward perspective.
Gold, silver and mining stocks moved higher this week, but yesterday we saw daily reversals in all of them. Moreover, mining stocks ended the session lower even though gold, silver and the general stock market moved higher. Do these reversals and underperformance indicate that the top is in?
In our opinion, that’s likely, but not yet extremely likely, so we will still wait for additional signs before opening a speculative position. However, such confirmations could be seen today, and if this is the case, we will send out another alert.
Let’s take a look at the charts (charts courtesy of http://stockcharts.com).
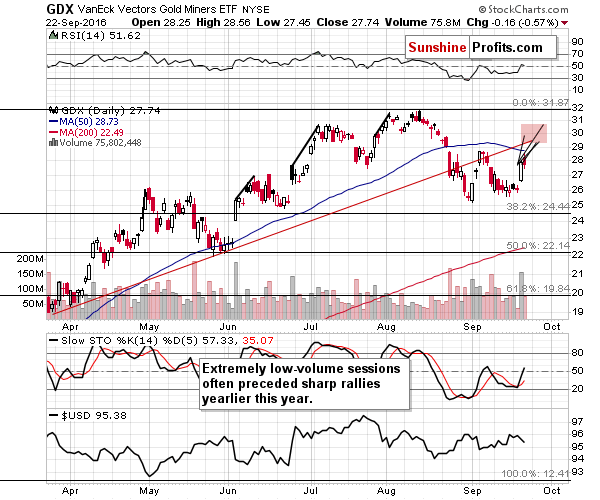
We expected to see a sudden jump in mining stocks and we saw it – consequently, what was about to happen, could already be behind us and yesterday’s intra-day reversal and a decline in miners despite rallying gold, silver and the general stock market certainly suggests so. Still, based on the previous rallies, we should not be shocked or surprised by an additional upswing (to the area marked in red) and the reasons due to which this could take place remain up-to-date:
How high can miners rally? Earlier this month, we compared the sizes of the previous post-sudden-jump rallies and applied this analogy to the early-September one, creating the $28 price target. Applying the same analogy this time provides us with price targets close to the $29 - $30 range. This area also includes the rising red support / resistance line and the 50-day moving average and they both could stop the rally.
But, is it inevitable that miners will rally here? Of course not, and the gold chart shows why.
Moreover, the underperformance of miners vs. metals was only seen for one trading day – it could have simply been miners taking a breather after an exceptional daily rally (which we saw on Wednesday). Consequently, the signals are not very bearish just yet.
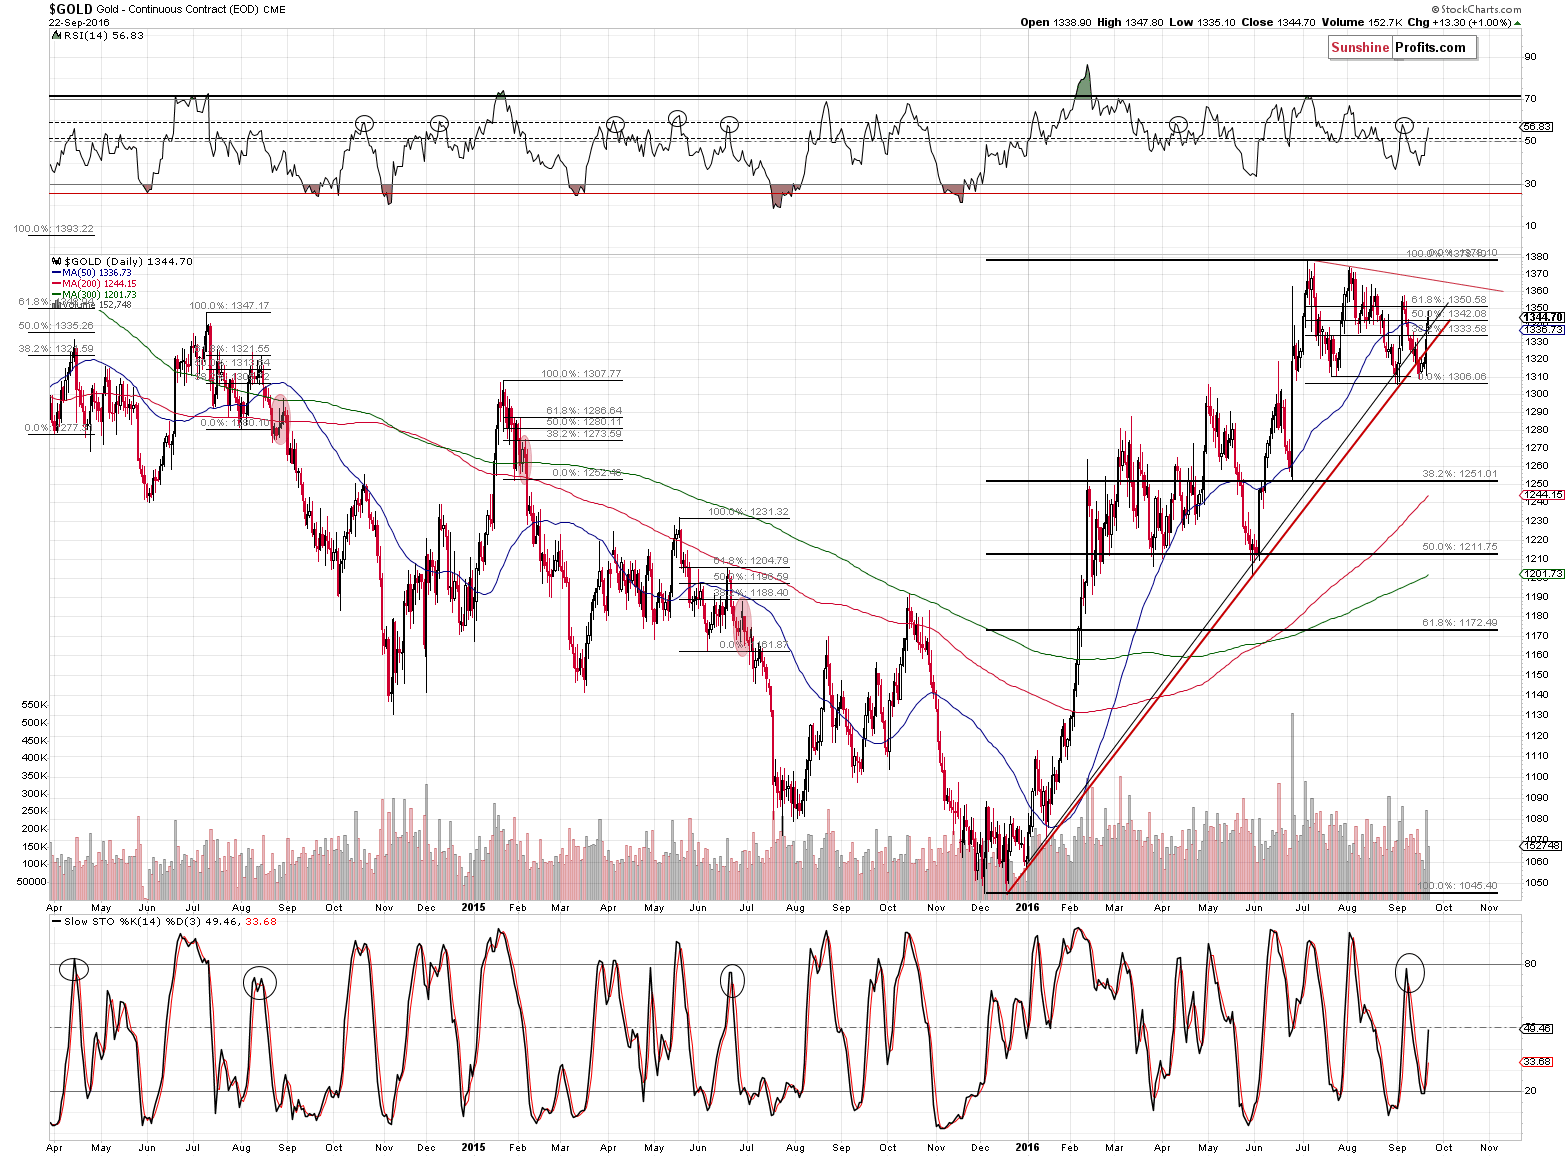
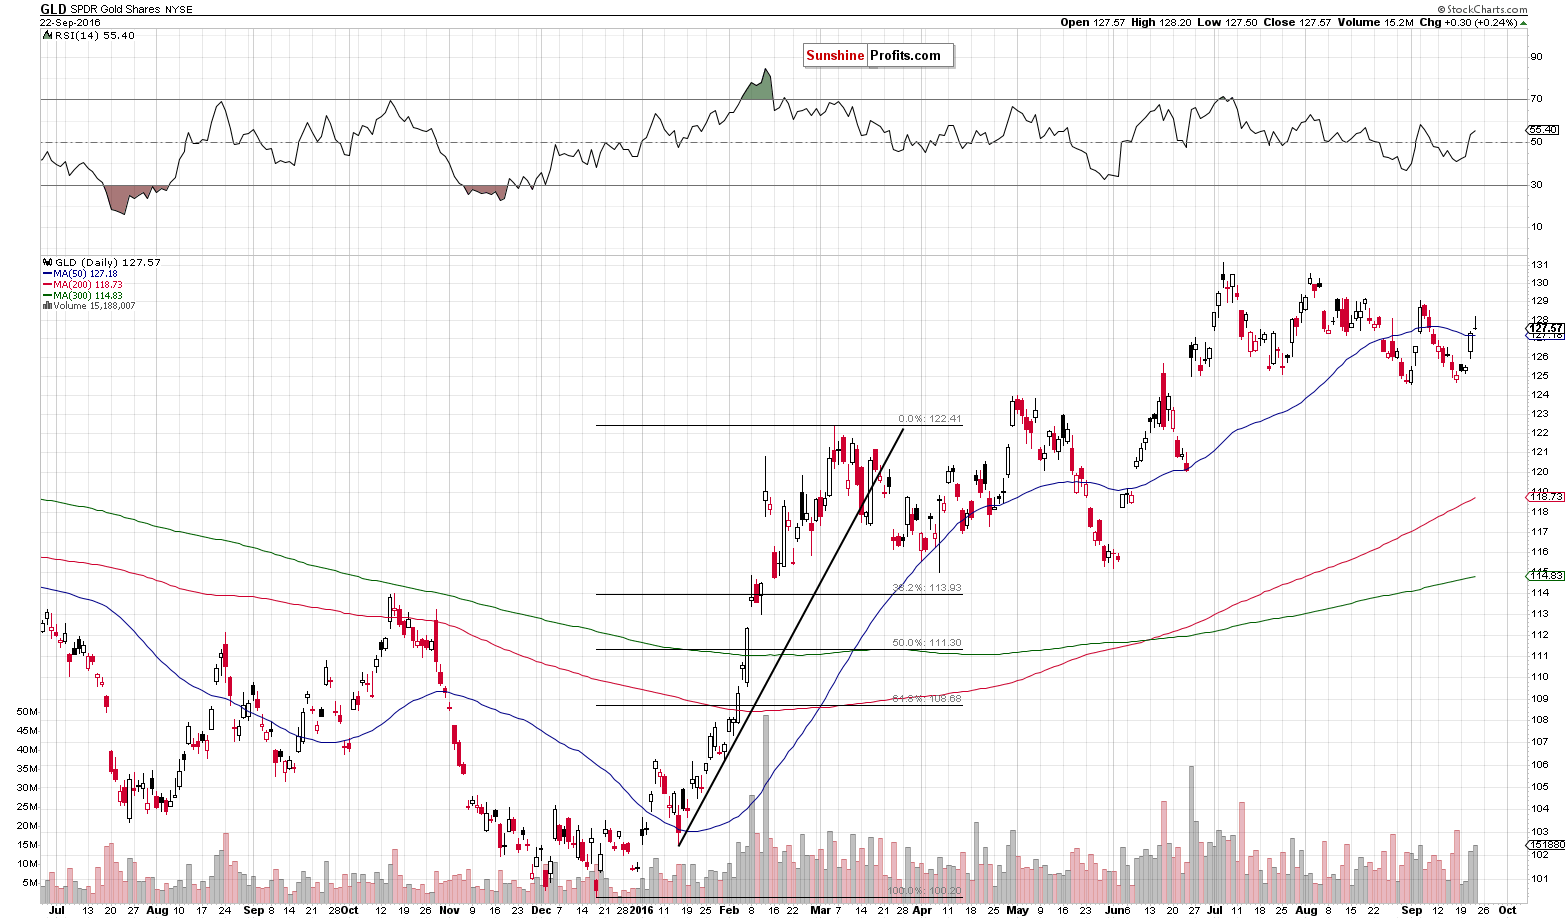
We included two gold charts as it seems that the Stockcharts’ closing price is incorrect (the correct value being about $1,336 – slightly below the 50-day moving average). The GLD chart clearly shows that the shape of yesterday’s session was a daily reversal. The volume was quite significant in GLD, which further confirms the bearish implications.
Moving back to the gold chart, we can see that the breakdown below the rising black support / resistance line (based on the closing prices) was not invalidated – gold moved temporarily above it, but closed a bit below it.
Moreover, if we consider how long it took gold to top after previous local bottoms close to $1,300, it seems that the time for this rally may be over or is very close to being over.
The rally that started on September 1 took only 3 days to complete (in terms of closing prices). The rally that started on July 26 took 6 days. The rally that started on June 29 took 5-7 days (with the intra-day high after 5 days). If this rally is similar to the previous ones, then one should expect it to take about 4-6 days. Today – if gold closes higher – would be the 5th day of the rally. Consequently, the top could already be in, we can see it today, or on Monday.
Still, let’s keep in mind that even if gold rallies to $1,365, it wouldn’t invalidate the bearish outlook in general as that would be a move to a resistance line (the declining red line) and not a breakout above it.
As far as silver is concerned, we previously wrote the following:
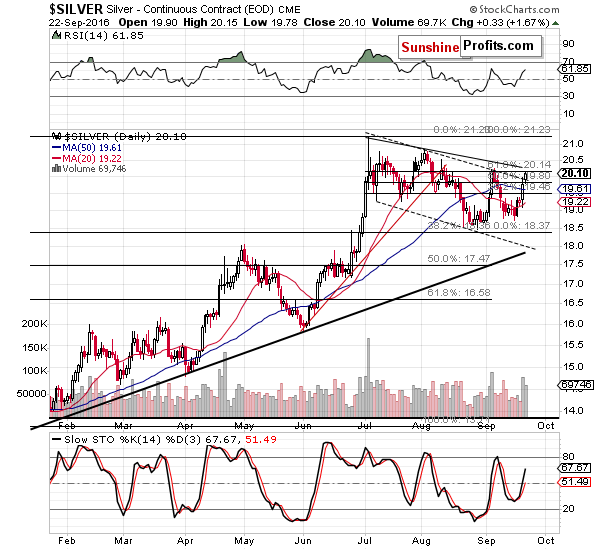
The white metal rallied sharply, but not yet sharply enough (relative to gold) for this to be a bearish sign on its own. At this time, it doesn’t seem that we have any specific signs from the white metal. However, based on the declining resistance lines, we can say something about the possible price targets. Namely, it seems that silver would not visibly exceed $20.50 (more or less the August high) and perhaps it would not exceed $20.20 as that’s where it topped previously and this level is further supported by the proximity of the 61.8% Fibonacci retracement and the declining resistance line.
Other than that, there’s not much that we can currently say about the above chart. On a side note, the buy signal from the Stochastic indicator is not significant – please note how fake these signals were in mid-May and in August (except for the last one).
The above remains up-to-date. Silver still didn’t outperform gold in an extreme manner, so we have seen no sell confirmation so far.
Silver topped at $20.15 yesterday, a bit below the lower of our target levels, so the top may be in, but the problem here is that we don’t have enough confirmations yet to view this as very likely (likely – yes, but not likely enough to open a speculative position).
Summing up, based on Wednesday’s session we saw some new bullish sings (big rally on big volume in miners) and we saw some new bearish signs (another move back to the lowest retracement in gold) and yesterday’s session provided us with a few additional bearish indications. Still, overall, too little changed to make the bearish case strong enough to justify opening speculative short positions at this time. The medium-term outlook was bearish and it remains bearish today. We are monitoring the markets for signs and confirmations of weakness or strength and we will report to you accordingly.
As always, we will keep you – our subscribers – updated.
To summarize:
Trading capital (supplementary part of the portfolio; our opinion): No positions
Long-term capital (core part of the portfolio; our opinion): No positions
Insurance capital (core part of the portfolio; our opinion): Full position
Plus, you might want to read why our stop-loss orders are usually relatively far from the current price.
Please note that a full position doesn’t mean using all of the capital for a given trade. You will find details on our thoughts on gold portfolio structuring in the Key Insights section on our website.
As a reminder – “initial target price” means exactly that – an “initial” one, it’s not a price level at which we suggest closing positions. If this becomes the case (like it did in the previous trade) we will refer to these levels as levels of exit orders (exactly as we’ve done previously). Stop-loss levels, however, are naturally not “initial”, but something that, in our opinion, might be entered as an order.
Since it is impossible to synchronize target prices and stop-loss levels for all the ETFs and ETNs with the main markets that we provide these levels for (gold, silver and mining stocks – the GDX ETF), the stop-loss levels and target prices for other ETNs and ETF (among other: UGLD, DGLD, USLV, DSLV, NUGT, DUST, JNUG, JDST) are provided as supplementary, and not as “final”. This means that if a stop-loss or a target level is reached for any of the “additional instruments” (DGLD for instance), but not for the “main instrument” (gold in this case), we will view positions in both gold and DGLD as still open and the stop-loss for DGLD would have to be moved lower. On the other hand, if gold moves to a stop-loss level but DGLD doesn’t, then we will view both positions (in gold and DGLD) as closed. In other words, since it’s not possible to be 100% certain that each related instrument moves to a given level when the underlying instrument does, we can’t provide levels that would be binding. The levels that we do provide are our best estimate of the levels that will correspond to the levels in the underlying assets, but it will be the underlying assets that one will need to focus on regarding the signs pointing to closing a given position or keeping it open. We might adjust the levels in the “additional instruments” without adjusting the levels in the “main instruments”, which will simply mean that we have improved our estimation of these levels, not that we changed our outlook on the markets. We are already working on a tool that would update these levels on a daily basis for the most popular ETFs, ETNs and individual mining stocks.
Our preferred ways to invest in and to trade gold along with the reasoning can be found in the how to buy gold section. Additionally, our preferred ETFs and ETNs can be found in our Gold & Silver ETF Ranking.
As always, we'll keep you - our subscribers - updated should our views on the market change. We will continue to send out Gold & Silver Trading Alerts on each trading day and we will send additional Alerts whenever appropriate.
The trading position presented above is the netted version of positions based on subjective signals (opinion) from your Editor, and the Tools and Indicators.
As a reminder, Gold & Silver Trading Alerts are posted before or on each trading day (we usually post them before the opening bell, but we don't promise doing that each day). If there's anything urgent, we will send you an additional small alert before posting the main one.
=====
Latest Free Trading Alerts:
On Wednesday, the Federal Reserve not only released their most recent monetary policy statement, but also updated its newest economic projections. How can they influence the gold market?
Will September FOMC Economic Projections Support Gold?
We enter the hottest election season. Would it be a good or bad time for the price of gold? We invite you to read our today’s article about the gold’s short-term dynamics around election time and find out what it implies for the gold market this year.
=====
Hand-picked precious-metals-related links:
Gold Invigorated as Central Bankers’ Largesse Burnishes Demand
Newcastle Gold up fourfold in 2016 after latest assays
Platinum market could face shortage: PwC
Junior and mid-tier gold producers leading growth: Haywood
=====
In other news:
The Fed's 'costly failure' is leading to a 2017 bear market, economist says
The Fed's Mission: A Rocket Launch From Jupiter
ECB's Mario Draghi has run out of magic as deflation closes in
Euro zone business growth hits 20-month low, Germany loses momentum
China’s toxic debt pile may be 10 times official estimates: Fitch
=====
Thank you.
Sincerely,
Przemyslaw Radomski, CFA
Founder, Editor-in-chief, Gold & Silver Fund Manager
Gold & Silver Trading Alerts
Forex Trading Alerts
Oil Investment Updates
Oil Trading Alerts

