

Briefly: In our opinion, no speculative positions in gold, silver and mining stocks are justified from the risk/reward perspective.
Gold, silver and mining stocks all rallied substantially (the latter over 7%) on significant volume – but are the implications of this move really as extremely bullish as it appears at the first sight?
Not necessarily. Some signs point to higher precious metals prices in the coming days, but some suggest that the rally is already over or about to be over. Let’s take a look at the charts (charts courtesy of http://stockcharts.com).
In yesterday’s alert we wrote the following about mining stocks:
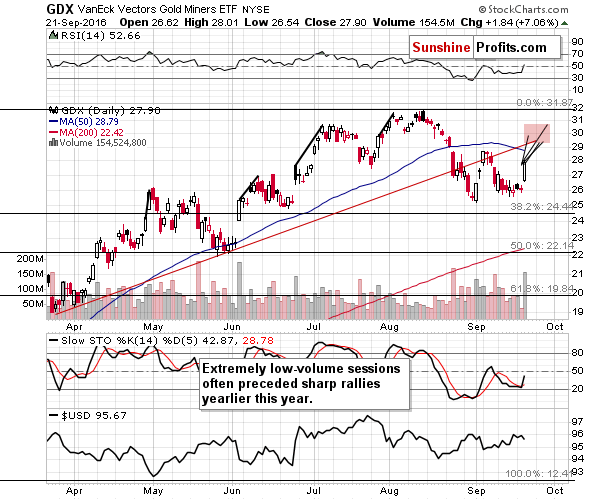
The volume was not just low – it was extremely low. Can it tell us anything? It suggests extra caution as metals and miners could be on the verge of a sudden upswing - that’s what happened in the previous months.
Early April, late April, early June and late July all included extremely-low-volume sessions and they were all followed by sharp rallies. Since history tends to rhyme, and we have a good reason for metals and miners to rally (FOMC meeting), a sudden price jump would not surprise us.
We saw exactly the latter – miners soared and since the volume that accompanied the upswing was huge, it seems that the rally is not over yet (at least based on the latest data).
How high can miners rally? Earlier this month, we compared the sizes of the previous post-sudden-jump rallies and applied this analogy to the early-September one, creating the $28 price target. Applying the same analogy this time provides us with price targets close to the $29 - $30 range. This area also includes the rising red support / resistance line and the 50-day moving average and they both could stop the rally.
But, is it inevitable that miners will rally here? Of course not, and the gold chart shows why.
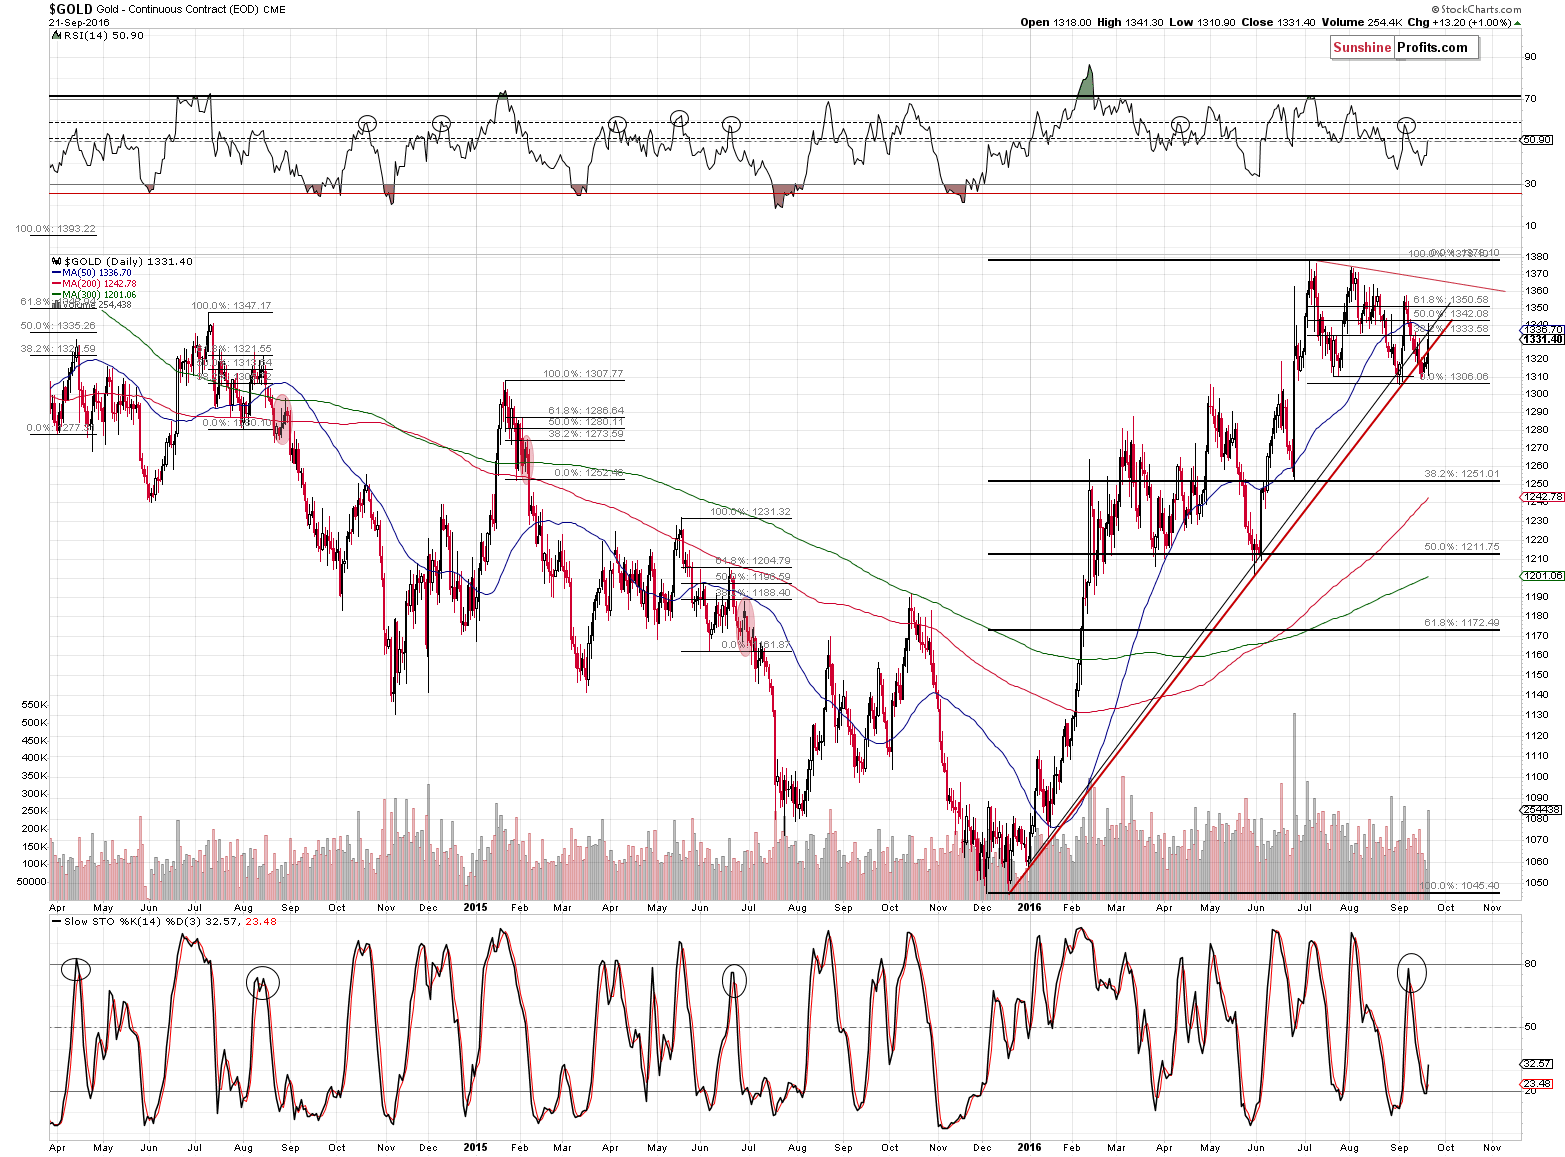
First of all, yes, gold moved above the rising red support line and the invalidation of the breakdown is a bullish event. However, the red line is based on the intra-day lows and there’s another line that needs to be taken into account as well – the one based on the daily closing prices. We marked it with black and it’s currently a bit above gold’s yesterday’s high. So, from this perspective, there was no invalidation – only a move back to this line.
Moreover, gold only moved to the first of the Fibonacci retracement levels, so the rally, even though it appeared sharp on an intra-day basis, is nothing to call home about – it didn’t change the technical picture.
Moreover, a move to the first of the Fibonacci retracements is exactly what happened after similar tops and counter-trend rallies. We marked the similar situations with red ellipses. The top in July 2014 was followed by an initial bottom and correction slightly above the 61.8% retracement, then another decline and then the final – smaller – move higher. The big slide followed in the upcoming weeks and months. The January 2015 top was followed by a sharp drop, sharp correction to the 61.8% Fibonacci retracement, another decline and then a quick move back to the lowest retracement. The big slide followed in the upcoming weeks and months. The May 2015 top was followed by a decline, correction back to the 61.8% retracement, another slide and then a move back to the lowest of the retracements (which was a bit below the 50-day moving average, just like what we see today). Gold plunged shortly in the following weeks. If history is to rhyme once again, we could see much lower gold prices in the coming weeks without a meaningful rally beforehand.
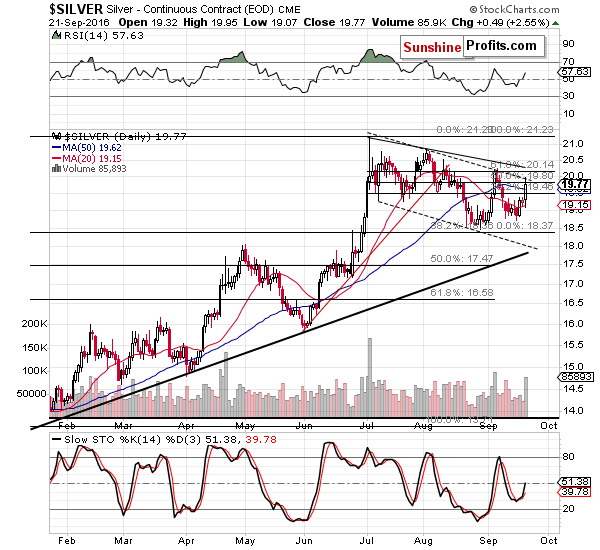
The white metal rallied sharply, but not yet sharply enough (relative to gold) for this to be a bearish sign on its own. At this time, it doesn’t seem that we have any specific signs from the white metal. However, based on the declining resistance lines, we can say something about the possible price targets. Namely, it seems that silver would not visibly exceed $20.50 (more or less the August high) and perhaps it would not exceed $20.20 as that’s where it topped previously and this level is further supported by the proximity of the 61.8% Fibonacci retracement and the declining resistance line.
Other than that, there’s not much that we can currently say about the above chart. On a side note, the buy signal from the Stochastic indicator is not significant – please note how fake these signals were in mid-May and in August (except for the last one).
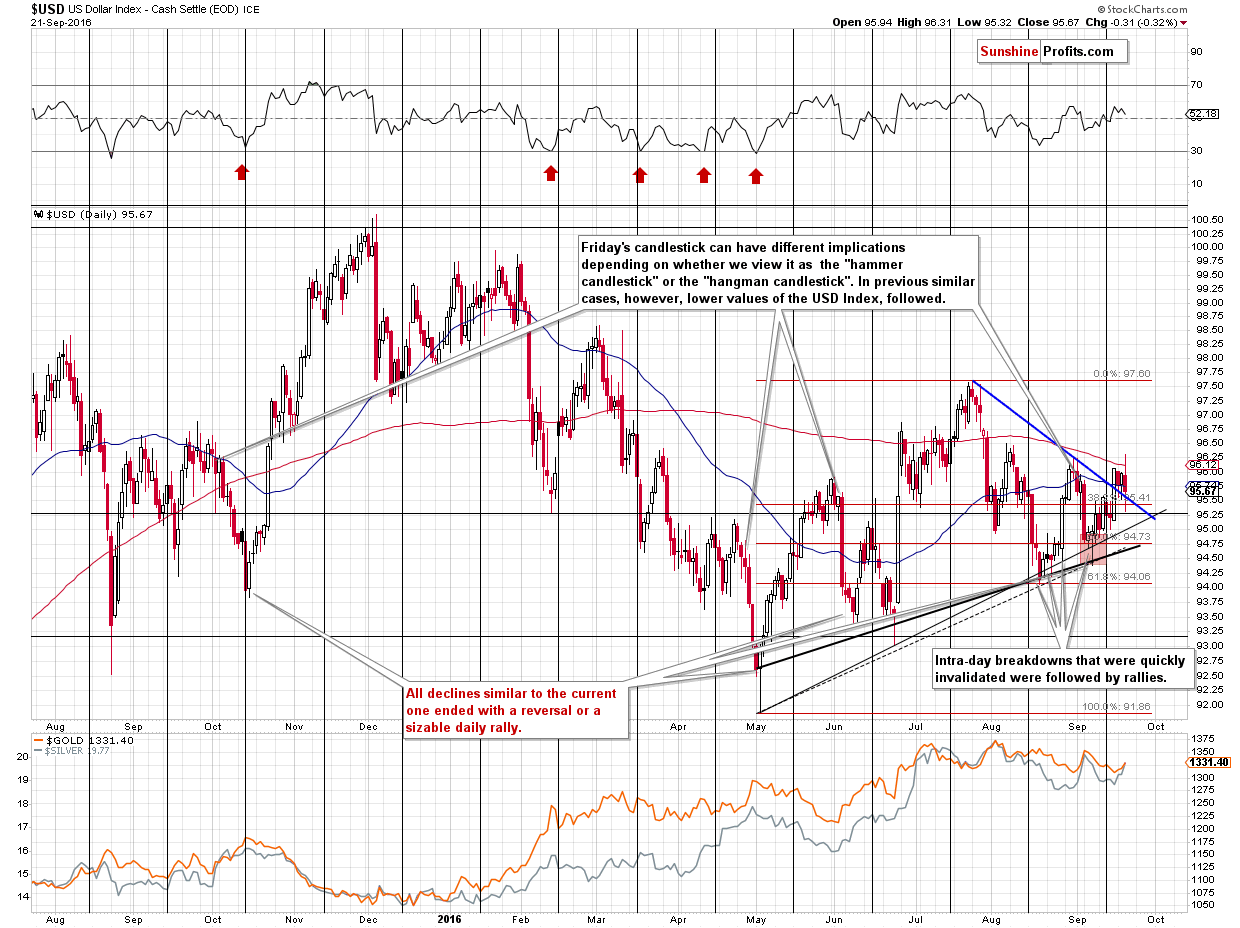
The situation in the USD Index didn’t change materially either (at least based on yesterday's closing prices). The breakout above the declining blue support line was not really invalidated – the USD Index moved below it, but finally closed very close to it. We don’t view this action as invalidation of the breakout. In light of the above, the bullish picture did not deteriorate and the bearish implications for the precious metals sector remain in place.
Summing up, based on yesterday’s session we saw some new bullish sings (big rally on big volume in miners) and we saw some new bearish signs (another move back to the lowest retracement in gold), but overall not that much changed. The medium-term outlook was bearish and it remains to be bearish today, whereas the short-term outlook was rather unclear and this remains to be the case also today. We are monitoring the markets for signs and confirmations of weakness or strength and we will report to you accordingly.
As always, we will keep you – our subscribers – updated.
To summarize:
Trading capital (supplementary part of the portfolio; our opinion): No positions
Long-term capital (core part of the portfolio; our opinion): No positions
Insurance capital (core part of the portfolio; our opinion): Full position
Plus, you might want to read why our stop-loss orders are usually relatively far from the current price.
Please note that a full position doesn’t mean using all of the capital for a given trade. You will find details on our thoughts on gold portfolio structuring in the Key Insights section on our website.
As a reminder – “initial target price” means exactly that – an “initial” one, it’s not a price level at which we suggest closing positions. If this becomes the case (like it did in the previous trade) we will refer to these levels as levels of exit orders (exactly as we’ve done previously). Stop-loss levels, however, are naturally not “initial”, but something that, in our opinion, might be entered as an order.
Since it is impossible to synchronize target prices and stop-loss levels for all the ETFs and ETNs with the main markets that we provide these levels for (gold, silver and mining stocks – the GDX ETF), the stop-loss levels and target prices for other ETNs and ETF (among other: UGLD, DGLD, USLV, DSLV, NUGT, DUST, JNUG, JDST) are provided as supplementary, and not as “final”. This means that if a stop-loss or a target level is reached for any of the “additional instruments” (DGLD for instance), but not for the “main instrument” (gold in this case), we will view positions in both gold and DGLD as still open and the stop-loss for DGLD would have to be moved lower. On the other hand, if gold moves to a stop-loss level but DGLD doesn’t, then we will view both positions (in gold and DGLD) as closed. In other words, since it’s not possible to be 100% certain that each related instrument moves to a given level when the underlying instrument does, we can’t provide levels that would be binding. The levels that we do provide are our best estimate of the levels that will correspond to the levels in the underlying assets, but it will be the underlying assets that one will need to focus on regarding the signs pointing to closing a given position or keeping it open. We might adjust the levels in the “additional instruments” without adjusting the levels in the “main instruments”, which will simply mean that we have improved our estimation of these levels, not that we changed our outlook on the markets. We are already working on a tool that would update these levels on a daily basis for the most popular ETFs, ETNs and individual mining stocks.
Our preferred ways to invest in and to trade gold along with the reasoning can be found in the how to buy gold section. Additionally, our preferred ETFs and ETNs can be found in our Gold & Silver ETF Ranking.
As always, we'll keep you - our subscribers - updated should our views on the market change. We will continue to send out Gold & Silver Trading Alerts on each trading day and we will send additional Alerts whenever appropriate.
The trading position presented above is the netted version of positions based on subjective signals (opinion) from your Editor, and the Tools and Indicators.
As a reminder, Gold & Silver Trading Alerts are posted before or on each trading day (we usually post them before the opening bell, but we don't promise doing that each day). If there's anything urgent, we will send you an additional small alert before posting the main one.
=====
Latest Free Trading Alerts:
Yesterday, the FOMC members leaved interest rates unchanged. What does it mean for the gold market?
Gold Jumps After Divided Fed Chickens Out
=====
Hand-picked precious-metals-related links:
Gold Holds Biggest Gain in Two Weeks and Miners Climb After Fed
LAWRIE WILLIAMS: The Curious Case of Swiss Gold Flows - Next Episode
Giant Gold Fields mine won’t be so giant for up to five years
Gold prices rise after Fed holds rates but high won't last, says CEF CEO
=====
In other news:
Yellen Rebuffs Pressure to Hike as Fed Gives Economy Room to Run
Bill Gross: I'm hardly able to speak after Fed decision
Marc Faber says central banks doomed to fail, as Fed, BOJ decisions come under microscope
Citi declares the end of QE as Japan overhauls its policy
=====
Thank you.
Sincerely,
Przemyslaw Radomski, CFA
Founder, Editor-in-chief, Gold & Silver Fund Manager
Gold & Silver Trading Alerts
Forex Trading Alerts
Oil Investment Updates
Oil Trading Alerts

