

Briefly: In our opinion, short positions (full position) in gold, silver and mining stocks are justified from the risk/reward perspective.
Yesterday was yet another day when gold, silver and mining stocks declined despite Monday’s rally in mining stocks. How low is gold likely to slide before turning up?
Let’s take a closer look at the gold charts (charts courtesy of http://stockcharts.com).
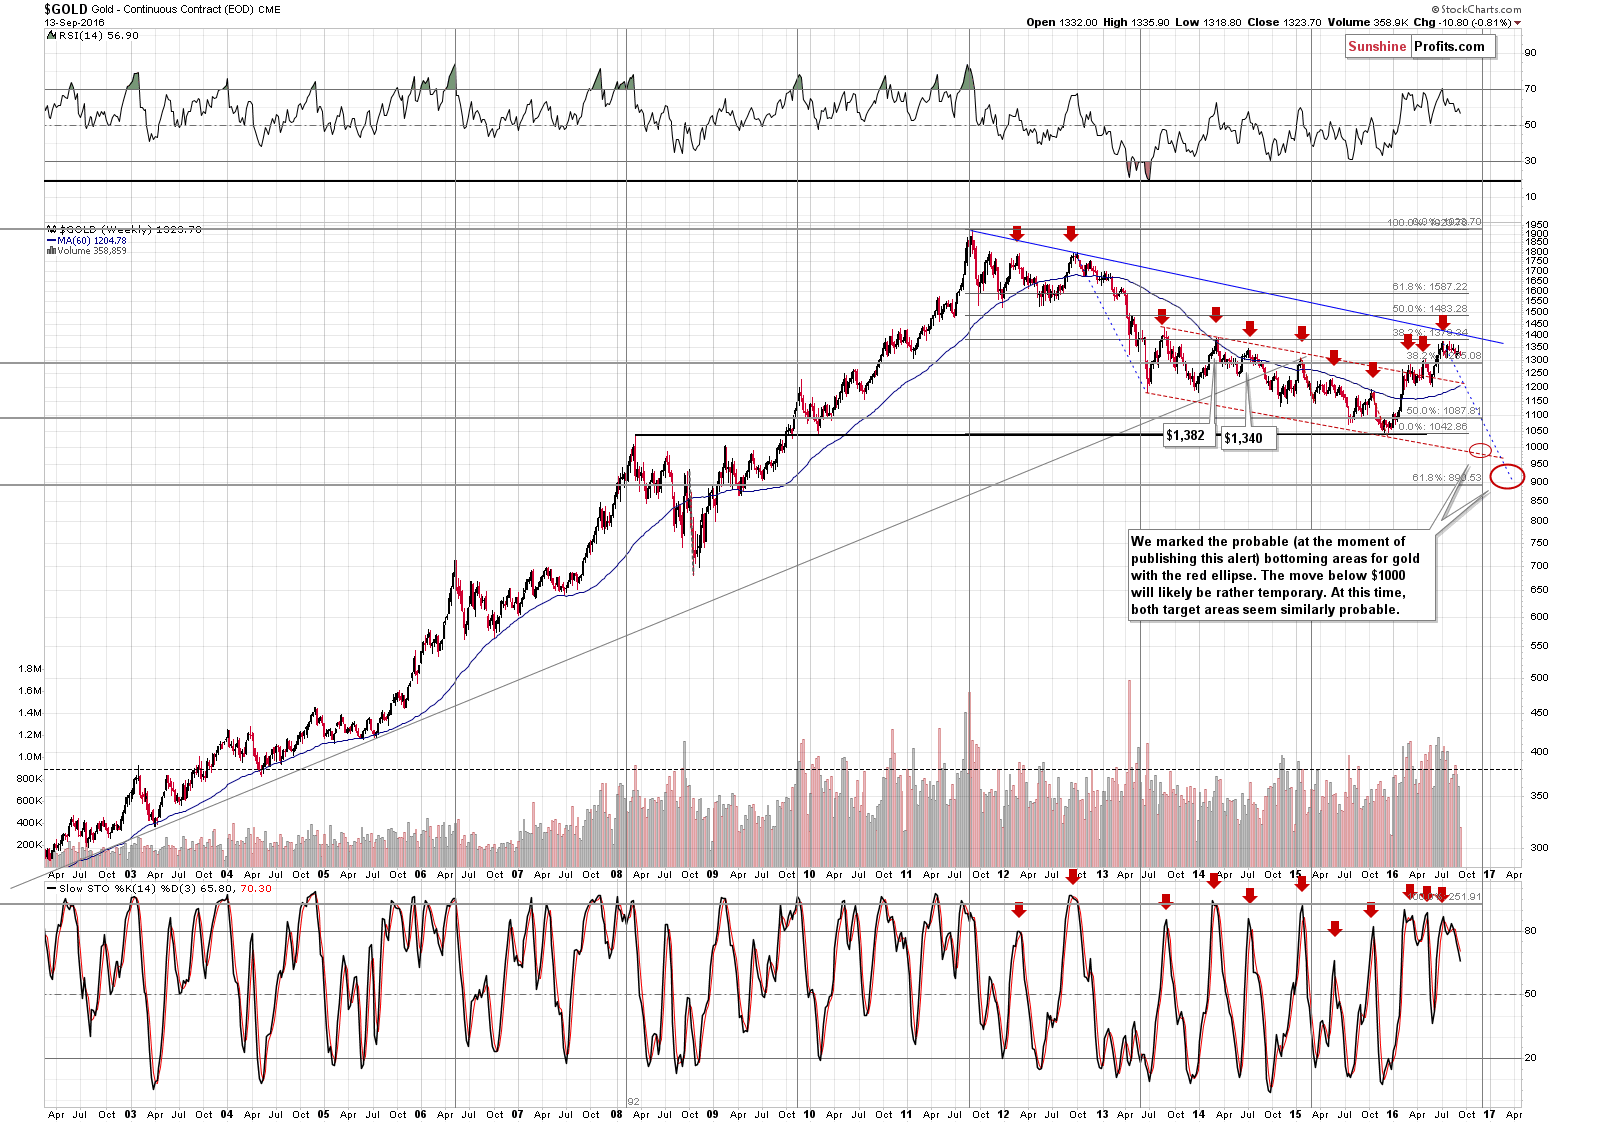
The reply to the question can’t be straightforward, as the question itself isn’t. No market moves in a straight line up or down and gold’s decline will almost certainly be paused by corrective upswings before it is completely over. Consequently, let’s first define, what we mean by “the bottom” here. It is the price level that will not be broken to the downside for the next decade or so (most likely never). We expect this kind of bottom to be formed below the 2015 low – at about $900 – as you can see on the long-term chart above.
The slide to this move is somewhat likely to be similar to the biggest decline that we saw in the previous years (in 2012 and 2013) – after all, history tends to repeat itself. If the pace of decline is indeed similar, then we can expect the final bottom to be seen in the first part of 2017. That’s more or less in tune with the long-term turning points for gold (vertical lines) and it would correspond to the 61.8% Fibonacci retracement level based on the entire bull market.
Naturally, gold will likely not decline in a straight line (back in 2012 and 2013 this wasn’t the case as well) – there will likely be bigger and smaller corrections. Where are they likely to start and are they likely to be big or small?
Generally, the expected size of the bounce depends on the sharpness and size of the preceding decline and the strength of the support that would be reached.
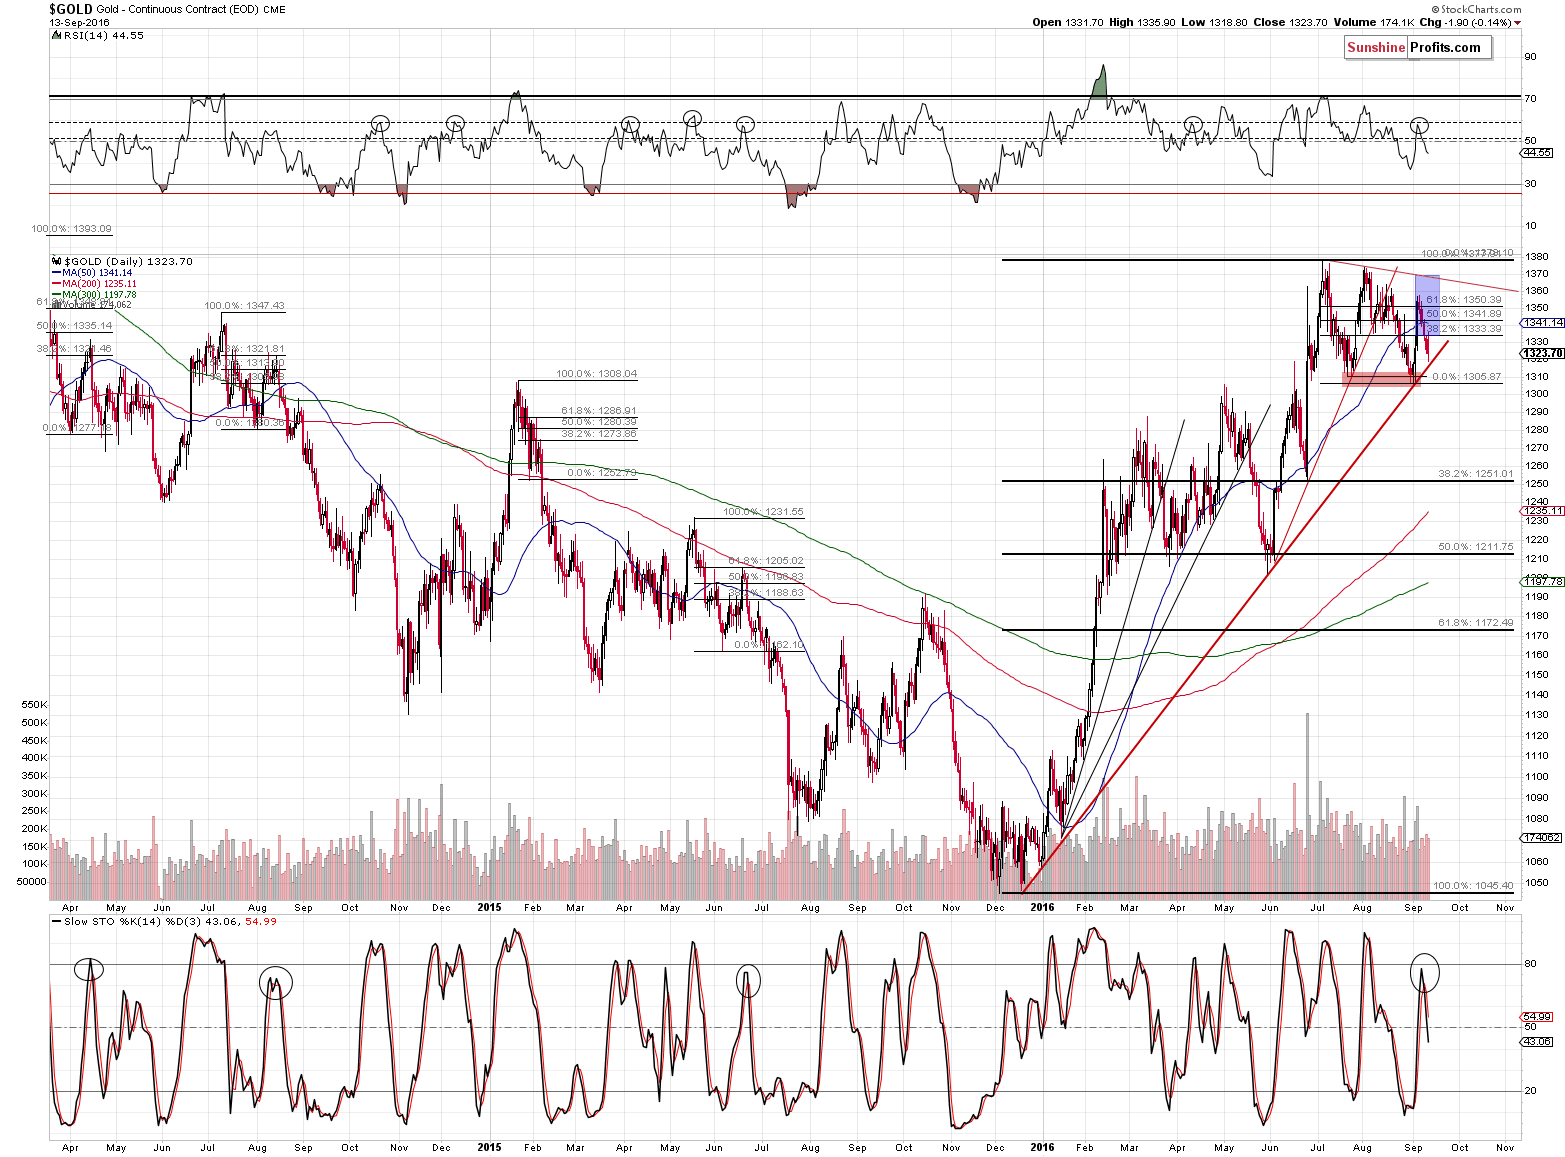
The first support is visible at about $1,320 (based on the rising red support line). It could provide minor support, but we don’t expect to see anything more than a tiny rally (if at all). This level was already tested and generated a bounce. It appears that gold is ready to break it this time. The support level at about $1,300 is stronger, but since gold has been trading close to it for a few months now, it doesn’t have to generate a substantial rally. Based on how gold breaks below support lines, we would not be surprised to see a move higher after gold reaches $1,300 or moves very close to it. Such a rally would take gold back to $1,320 or so (to the rising red support line, which would then be verified as resistance).
Once gold breaks below $1,300, the next support levels are provided by Fibonacci retracements based on the 2015 – 2016 rally. At $1,250 there is also the support in the form of the June bottom. The decline to this level is quite likely to be volatile, as there are no meaningful support levels between $1,300 and $1,250, so we could see a more visible corrective upswing after gold reaches $1,250, but that’s rather unclear at this time.
After moving below $1,250, gold is likely to slide to about $1,200 - the Fibonacci level there (it’s at $1,212) is close to the previous bottoms (March, May). Since there are 2 recent bottoms at this level (and they are also more prominent), this support is stronger and thus this level could generate a bigger bounce (perhaps even back to $1,250 or so), but it depends on many factors, including whether we will have a bigger bounce after gold reaches $1,250 first. If not, then the odds of a bigger bounce from $1,200 become much bigger.
Finally, the $1,172 level provides the weakest resistance as it is not accompanied by a confirmation from previous bottoms. Consequently, this level is least likely to generate a sizable rally, but we would like to emphasize that this is based on the data that we have today – the odds can change.
So, can we – right away – set up a trading plan for the next several months? No – we only have indications what’s more likely to happen than something else, but without seeing confirmations of some sort once gold approaches the specific price levels, it’s too risky to say that opening or closing a trade will be justified at these levels. In other words, we know that it’s likely that something very interesting may happen at these price levels, but we’ll need to be closer to the mentioned price levels to say more. Volume levels, currencies, ratios, indicators etc. all need to be taken into account.
Summing up, the outlook for the precious metals market remains bearish, but the move lower will likely not take the shape of a straight line – there will be corrections along the way, but this is actually good news as it provides for additional opportunities – for instance, if it hadn’t been for the move up this month and the signals that had preceded it, we would probably not have taken profits off the table on September 1 and re-enter the short positions at higher prices on September 8, thus further increasing gains. We will be monitoring the market for similar opportunities and report to you accordingly.
As always, we will keep you – our subscribers – updated.
To summarize:
Trading capital (supplementary part of the portfolio; our opinion): Short positions (100% of the full position) in gold, silver and mining stocks are justified from the risk/reward perspective with the following entry prices, stop-loss orders and initial target price levels:
- Gold: initial target price: $1,006; stop-loss: $1,393, initial target price for the DGLD ETN: $74.37; stop-loss for the DGLD ETN $36.89
- Silver: initial target price: $13.12; stop-loss: $21.63, initial target price for the DSLV ETN: $39.78; stop-loss for the DSLV ETN $14.34
- Mining stocks (price levels for the GDX ETF): initial target price: $9.34; stop-loss: $33.17, initial target price for the DUST ETF: $297; stop-loss for the DUST ETF $18.80
In case one wants to bet on junior mining stocks' prices (we do not suggest doing so – we think senior mining stocks are more predictable in the case of short-term trades – if one wants to do it anyway, we provide the details), here are the stop-loss details and initial target prices:
- GDXJ ETF: initial target price: $14.13; stop-loss: $54.29
- JDST ETF: initial target price: $245; stop-loss: $15.80
Long-term capital (core part of the portfolio; our opinion): No positions
Insurance capital (core part of the portfolio; our opinion): Full position
Plus, you might want to read why our stop-loss orders are usually relatively far from the current price.
Please note that a full position doesn’t mean using all of the capital for a given trade. You will find details on our thoughts on gold portfolio structuring in the Key Insights section on our website.
As a reminder – “initial target price” means exactly that – an “initial” one, it’s not a price level at which we suggest closing positions. If this becomes the case (like it did in the previous trade) we will refer to these levels as levels of exit orders (exactly as we’ve done previously). Stop-loss levels, however, are naturally not “initial”, but something that, in our opinion, might be entered as an order.
Since it is impossible to synchronize target prices and stop-loss levels for all the ETFs and ETNs with the main markets that we provide these levels for (gold, silver and mining stocks – the GDX ETF), the stop-loss levels and target prices for other ETNs and ETF (among other: UGLD, DGLD, USLV, DSLV, NUGT, DUST, JNUG, JDST) are provided as supplementary, and not as “final”. This means that if a stop-loss or a target level is reached for any of the “additional instruments” (DGLD for instance), but not for the “main instrument” (gold in this case), we will view positions in both gold and DGLD as still open and the stop-loss for DGLD would have to be moved lower. On the other hand, if gold moves to a stop-loss level but DGLD doesn’t, then we will view both positions (in gold and DGLD) as closed. In other words, since it’s not possible to be 100% certain that each related instrument moves to a given level when the underlying instrument does, we can’t provide levels that would be binding. The levels that we do provide are our best estimate of the levels that will correspond to the levels in the underlying assets, but it will be the underlying assets that one will need to focus on regarding the signs pointing to closing a given position or keeping it open. We might adjust the levels in the “additional instruments” without adjusting the levels in the “main instruments”, which will simply mean that we have improved our estimation of these levels, not that we changed our outlook on the markets. We are already working on a tool that would update these levels on a daily basis for the most popular ETFs, ETNs and individual mining stocks.
Our preferred ways to invest in and to trade gold along with the reasoning can be found in the how to buy gold section. Additionally, our preferred ETFs and ETNs can be found in our Gold & Silver ETF Ranking.
As always, we'll keep you - our subscribers - updated should our views on the market change. We will continue to send out Gold & Silver Trading Alerts on each trading day and we will send additional Alerts whenever appropriate.
The trading position presented above is the netted version of positions based on subjective signals (opinion) from your Editor, and the Tools and Indicators.
As a reminder, Gold & Silver Trading Alerts are posted before or on each trading day (we usually post them before the opening bell, but we don't promise doing that each day). If there's anything urgent, we will send you an additional small alert before posting the main one.
=====
Latest Free Trading Alerts:
There is a split on interest rates among the Fed officials. What does it mean for the gold market?
=====
Hand-picked precious-metals-related links:
Gold edges up on weaker dollar, easing Fed rate hike worries
Platinum price boost as top producer shuts down smelter
=====
In other news:
Ron Paul: The Fed Plans for Its Next Crisis
There’s a $300 Billion Exodus From Money Markets Ahead
Fed should get rate hike over and done with, Mohamed El-Erian says
=====
Thank you.
Sincerely,
Przemyslaw Radomski, CFA
Founder, Editor-in-chief, Gold & Silver Fund Manager
Gold & Silver Trading Alerts
Forex Trading Alerts
Oil Investment Updates
Oil Trading Alerts

