

Briefly: In our opinion, short positions (full position) in gold, silver and mining stocks are justified from the risk/reward perspective.
Gold declined on Friday, while both silver and mining stocks plunged violently. Conversely, the USD Index rallied. Consequently, we took profits in the currency market and we gained thanks to the slide in metals, miners and the general stock market. Should we take profits off the table given that the moves are already significant?
In short, as far as the precious metals market is concerned, it seems that the opposite will be the case. It appears that the decline is just beginning. On Friday, we got many bearish confirmations and if we get more of them, it’s quite likely that we will further increase the position size. Still, it seems that it’s too early to do so today.
Let’s take a closer look at the charts (charts courtesy of http://stockcharts.com).
In Friday’s alert, we wrote the following:
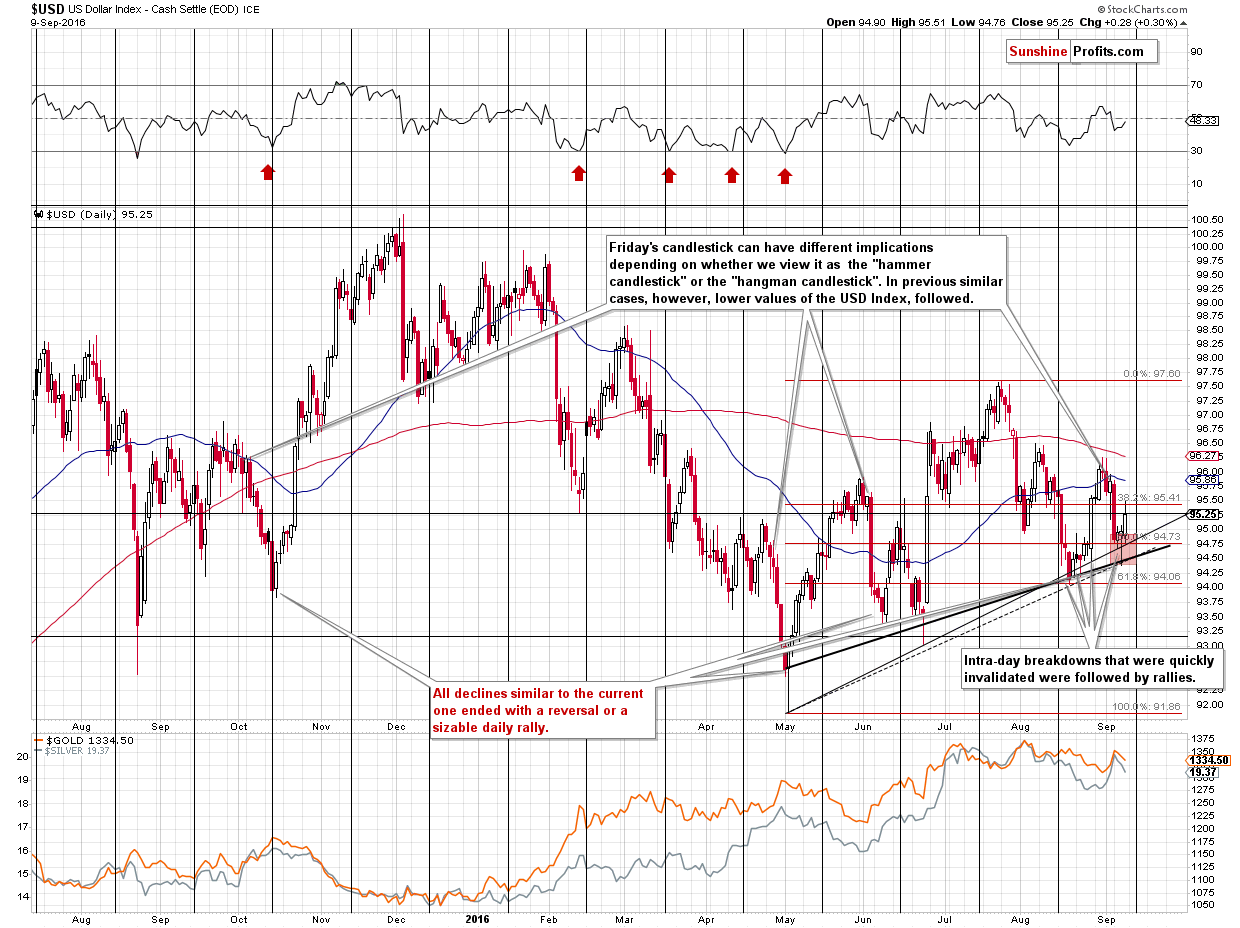
(…) Consequently, we added other relevant support levels to the above chart to estimate the size of the entire short-term move. It appears that most of the decline is already behind us, but an additional slide – to 94.50 or so is quite possible as well. The lowest of the likely target levels is created by the 61.8% Fibonacci retracement and the August low at about 94. We don’t expect the USD Index to move below this level (if it is not stopped higher – for instance at 94.50 or at the current levels – that is).
The USD Index bottomed almost exactly at 94.50 – at the intersection of 2 support lines and at the lower border of our target area. This, by itself, suggests that the bottom is in.
However, the way the USD bottomed (on an intra-day basis) yesterday, makes it even more likely that the bottom for this short-term decline is in. The USD Index formed a hammer reversal candlestick and this is what we saw in case of the final part of previous similar declines. The declines that started with the “hangman” candlestick were all followed by steep declines (with only very temporary pauses) and they ended when the USD proved that it could end one session higher and/or if the USD managed to reverse visibly before the session’s end. We saw both yesterday: the reversal and a daily move higher (only a slight one, but still).
Moreover, similar daily reversals were seen when the USD moved to the rising support line (the highest one) in the second half of August. They were followed by a sharp rally.
Finally, please note that gold didn’t move to new highs yesterday (far from it – gold actually declined) even though the USD moved to new lows – which is a clear sign of underperformance and a bearish confirmation.
All in all, yesterday’s session’s implications are bullish for the USD Index and that makes them bearish for gold, silver and mining stocks.
We didn’t have to wait long for the market to agree with us. The USD Index rallied and even though the move is not yet substantial, it is no longer in the target area, which means that it’s not close to a breakdown. Consequently, the outlook for the USD Index improved based on what happened on Friday and it remains bullish.

Our Friday’s comments on gold also remain up-to-date:
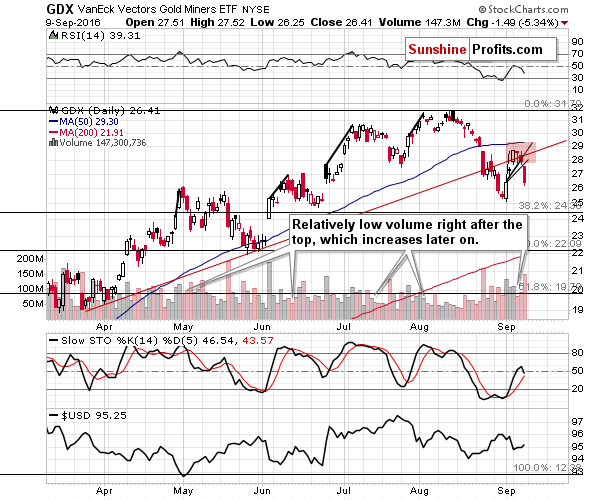
In the case of gold, we saw a breakdown back below the 50% retracement and the 50-day moving average. The volume was not big, but that doesn’t have bullish implications, as the average or even low volume is what we previously saw after local tops, especially similar ones – the initial part of the decline in mid-June took place on relatively low volume and the same goes for the initial part of the decline that we saw in the first half of August 2015.
Looking at indicators also provides us with bearish indications. The RSI indicator (upper part of the above chart) moved to the horizontal dashed line at about 60 and declined from there. It may seem to be nothing important, until one sees that the same thing accompanied quite a few local tops in the past.
What about the Stochastic indicator (lower part of the above chart)? Its almost at the 80 level, moving above which would indicate an overbought condition, but please note that many tops took place with the Stochastic just below this level. In fact, most similar topping formations (initial decline, then a correction to the 61.8% Fibonacci retracement and a continuation of the decline) were accompanied by the Stochastic moving to 70+, but not reaching 80. Consequently, the current position of this indicator is in tune with what happened previously when gold turned south and started powerful declines.
The implications are bearish.
Based on Friday’s session, the Stochastic indicator moved below its signal line, which by itself is a sell signal – it serves as a bearish confirmation.
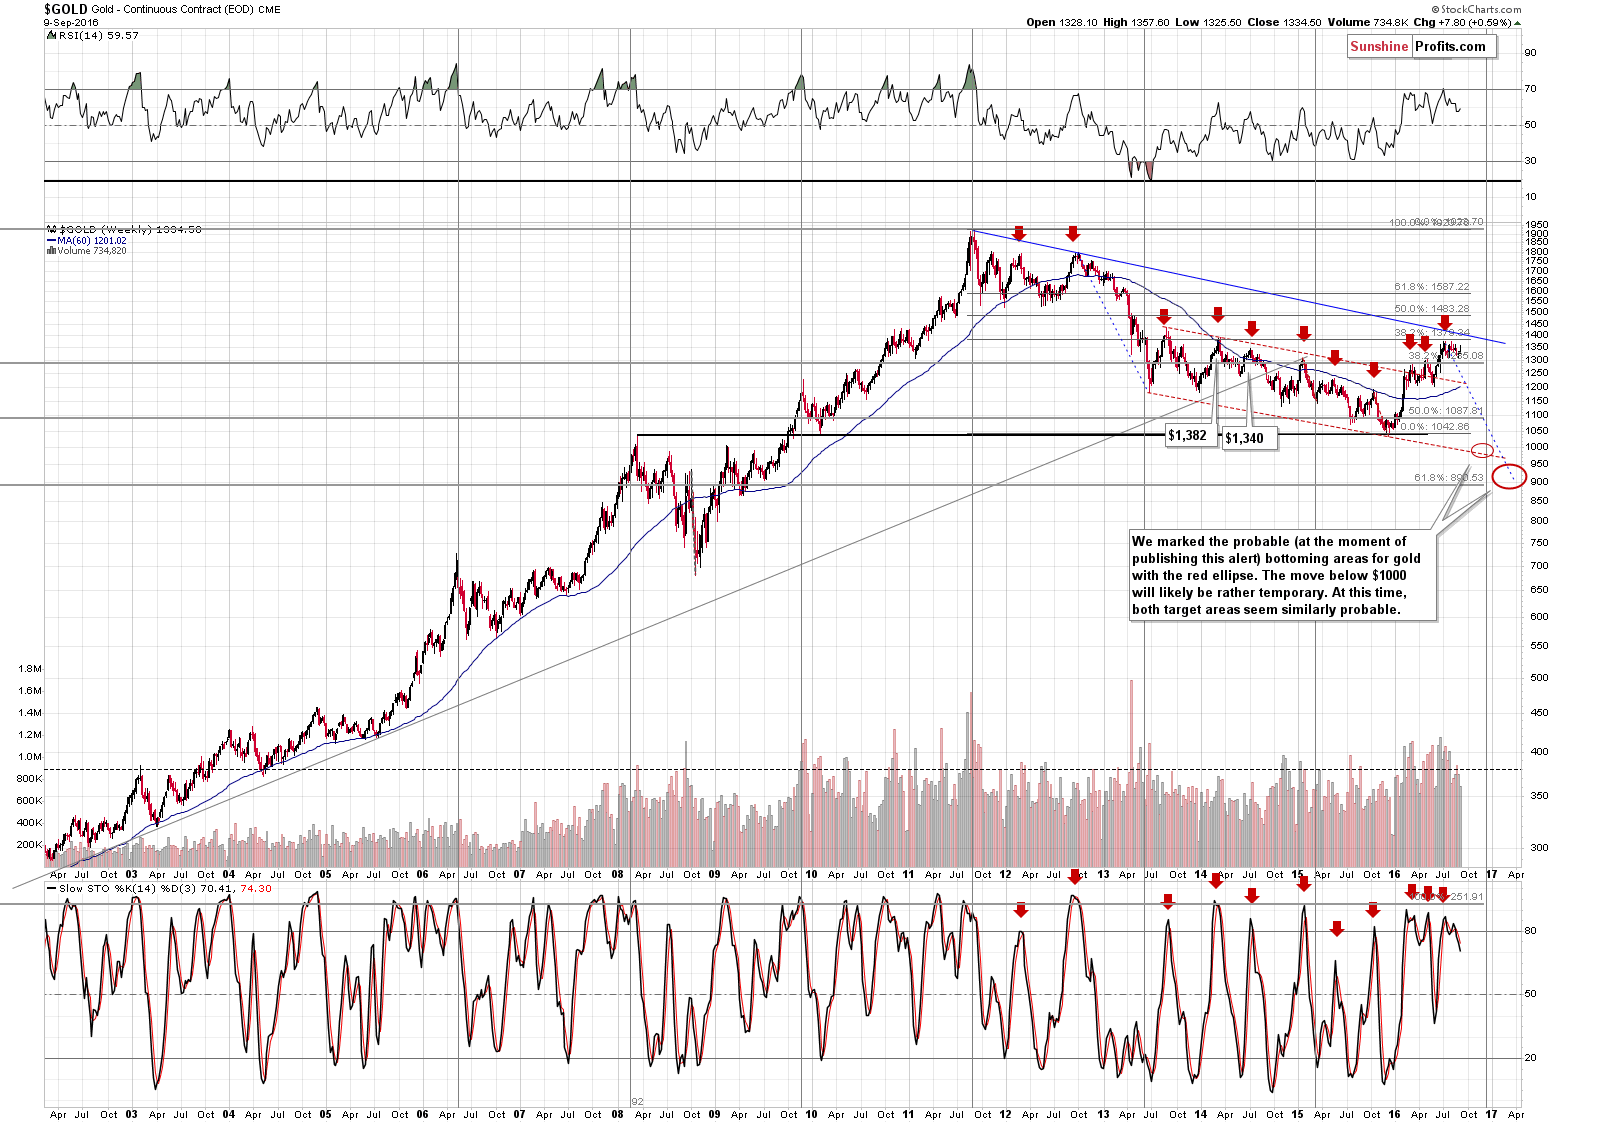
The bearish confirmation that we saw based on the weekly candlesticks is even more important. Gold ultimately closed higher, but that’s far from being bullish, as gold formed a visible weekly reversal (after an intra-week rally to $1,357 it closed at $1,334). That’s something that we saw many times in the past at local tops. The volume wasn’t huge, but that wasn’t the highest top, only a third attempt to move higher, which failed. Therefore, low volume is understandable (buying power is drying up) and it doesn’t invalidate the reversal.
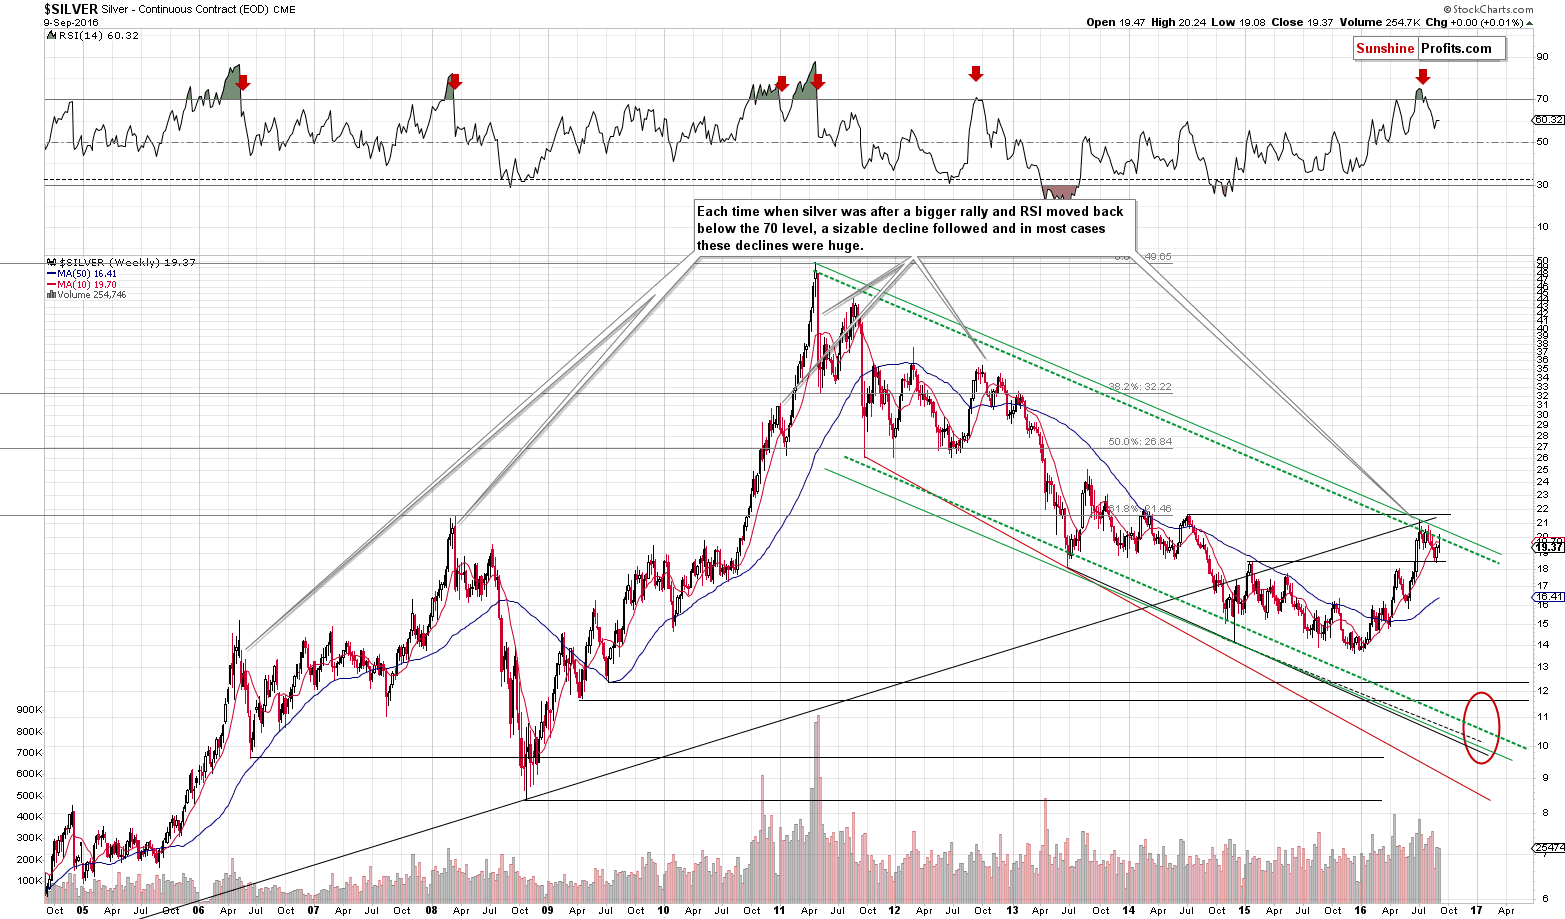
Speaking of reversals – silver’s weekly turnaround is even more profound. The white metal moved to $20.24 and all the way back down after invalidating the moves above the 10-week moving average and the declining green resistance line. The implications are bearish.
Gold stocks not only reversed, but also declined on a weekly basis, despite gold’s weekly move up by about $7. Gold stocks’ underperformance, the weekly reversal and the decline itself are all bearish signs.
In the September 1 Gold & Silver Trading Alert, we took profits on the previous short positions (note: the alert was sent before the session started) and wrote the following regarding mining stocks:
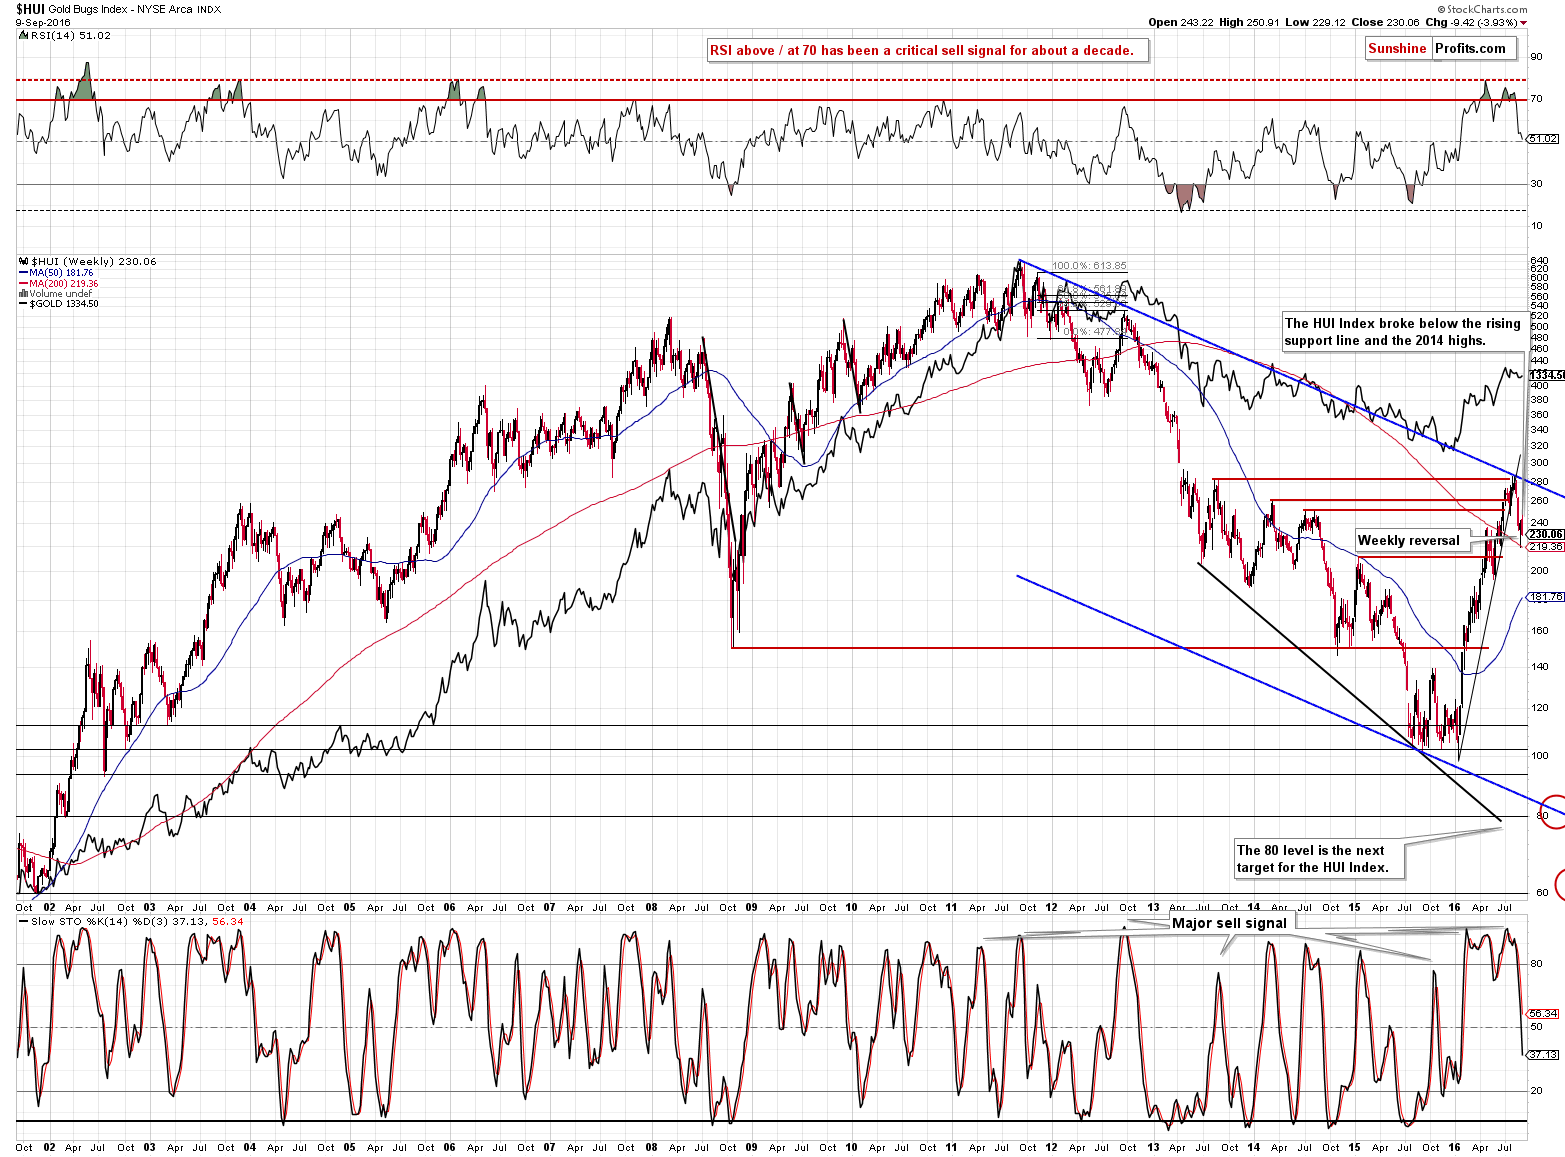
The above factors do not change the main trend, which remains down, but they do suggest a short-term move up is quite possible. Moreover, the previously broken red support / resistance line was not verified as resistance so far, so we could see a move back to it, before the decline resumes (and accelerates). This would give us the $28 level as the upside target for this move, but we don’t think that it’s worth trading it – trading against the bigger trend is too risky and the potential size of the move seems to be too small to justify this risk.
It turned out that miners moved a bit above $28 (to $28.70), which was not a game-changer, but a corrective upswing within a decline that took place in a rather regular manner.
The breakdown below the rising red line is now clearly confirmed and verified and it seems that lower values will follow soon. The volume after the top was rather small, but it increased on Friday, which – again – is in tune with previous tops and subsequent declines.
Summing up, the outlook for the precious metals market once again deteriorated based on Friday’s session and it seems that the next big downswing in the precious metals market is already underway. Consequently, it seems that speculative short positions are justified from the risk to reward point of view.
As always, we will keep you – our subscribers – updated.
To summarize:
Trading capital (supplementary part of the portfolio; our opinion): Short positions (100% of the full position) in gold, silver and mining stocks are justified from the risk/reward perspective with the following entry prices, stop-loss orders and initial target price levels:
- Gold: initial target price: $1,006; stop-loss: $1,393, initial target price for the DGLD ETN: $74.37; stop-loss for the DGLD ETN $36.89
- Silver: initial target price: $13.12; stop-loss: $21.63, initial target price for the DSLV ETN: $39.78; stop-loss for the DSLV ETN $14.34
- Mining stocks (price levels for the GDX ETF): initial target price: $9.34; stop-loss: $33.17, initial target price for the DUST ETF: $297; stop-loss for the DUST ETF $18.80
In case one wants to bet on junior mining stocks' prices (we do not suggest doing so – we think senior mining stocks are more predictable in the case of short-term trades – if one wants to do it anyway, we provide the details), here are the stop-loss details and initial target prices:
- GDXJ ETF: initial target price: $14.13; stop-loss: $54.29
- JDST ETF: initial target price: $245; stop-loss: $15.80
Long-term capital (core part of the portfolio; our opinion): No positions
Insurance capital (core part of the portfolio; our opinion): Full position
Plus, you might want to read why our stop-loss orders are usually relatively far from the current price.
Please note that a full position doesn’t mean using all of the capital for a given trade. You will find details on our thoughts on gold portfolio structuring in the Key Insights section on our website.
As a reminder – “initial target price” means exactly that – an “initial” one, it’s not a price level at which we suggest closing positions. If this becomes the case (like it did in the previous trade) we will refer to these levels as levels of exit orders (exactly as we’ve done previously). Stop-loss levels, however, are naturally not “initial”, but something that, in our opinion, might be entered as an order.
Since it is impossible to synchronize target prices and stop-loss levels for all the ETFs and ETNs with the main markets that we provide these levels for (gold, silver and mining stocks – the GDX ETF), the stop-loss levels and target prices for other ETNs and ETF (among other: UGLD, DGLD, USLV, DSLV, NUGT, DUST, JNUG, JDST) are provided as supplementary, and not as “final”. This means that if a stop-loss or a target level is reached for any of the “additional instruments” (DGLD for instance), but not for the “main instrument” (gold in this case), we will view positions in both gold and DGLD as still open and the stop-loss for DGLD would have to be moved lower. On the other hand, if gold moves to a stop-loss level but DGLD doesn’t, then we will view both positions (in gold and DGLD) as closed. In other words, since it’s not possible to be 100% certain that each related instrument moves to a given level when the underlying instrument does, we can’t provide levels that would be binding. The levels that we do provide are our best estimate of the levels that will correspond to the levels in the underlying assets, but it will be the underlying assets that one will need to focus on regarding the signs pointing to closing a given position or keeping it open. We might adjust the levels in the “additional instruments” without adjusting the levels in the “main instruments”, which will simply mean that we have improved our estimation of these levels, not that we changed our outlook on the markets. We are already working on a tool that would update these levels on a daily basis for the most popular ETFs, ETNs and individual mining stocks.
Our preferred ways to invest in and to trade gold along with the reasoning can be found in the how to buy gold section. Additionally, our preferred ETFs and ETNs can be found in our Gold & Silver ETF Ranking.
As always, we'll keep you - our subscribers - updated should our views on the market change. We will continue to send out Gold & Silver Trading Alerts on each trading day and we will send additional Alerts whenever appropriate.
The trading position presented above is the netted version of positions based on subjective signals (opinion) from your Editor, and the Tools and Indicators.
As a reminder, Gold & Silver Trading Alerts are posted before or on each trading day (we usually post them before the opening bell, but we don't promise doing that each day). If there's anything urgent, we will send you an additional small alert before posting the main one.
=====
Latest Free Trading Alerts:
During Thursday’s press conference, Draghi sounded very optimistic. What does this imply for the gold market?
September Draghi’s Press Conference and Gold
S&P 500 index sold off on Friday, as it got closer to 2,100 mark. Is this a new medium-term downtrend or just downward correction? Is holding short position still justified?
Stock Trading Alert: Stocks Broke Below Their Two Month Long Consolidation - New Downtrend?
=====
Hand-picked precious-metals-related links:
PRECIOUS-Gold holds steady as stocks, other metals suffer
Gold price: Hedge fund bears in about turn
SGE gold withdrawals pick up a little – but still way down on a year ago
Stars aligning for platinum price
Data supports ‘platinum cliff’ theory
=====
In other news:
Clinton's bout of pneumonia raises worries for Democrats
Selloff gathers pace as stimulus pullback fears deepen
Global Selloff Threatens to Spiral as Central Banks Angst Builds
The Last Word on Fed Policy Goes to Brainard
Goldman: We've Reached 'Maximum' Bullishness and That's Bad News for U.S. Stocks
OPEC sees more oil supply from rivals, implying larger 2017 surplus
=====
Thank you.
Sincerely,
Przemyslaw Radomski, CFA
Founder, Editor-in-chief, Gold & Silver Fund Manager
Gold & Silver Trading Alerts
Forex Trading Alerts
Oil Investment Updates
Oil Trading Alerts

