

Briefly: In our opinion, short positions (full position) in gold, silver and mining stocks are justified from the risk/reward perspective.
As we discussed in yesterday’s second alert, yesterday’s session changed quite a lot as far as the short-term outlook for the precious metals was concerned. Let’s jump right into charts and see the details (charts courtesy of http://stockcharts.com).
The key developments were seen in the USD Index, gold and mining stocks, so these are the charts that we’ll focus on today. Let’s start with the former.
In Wednesday’s alert we wrote the following:
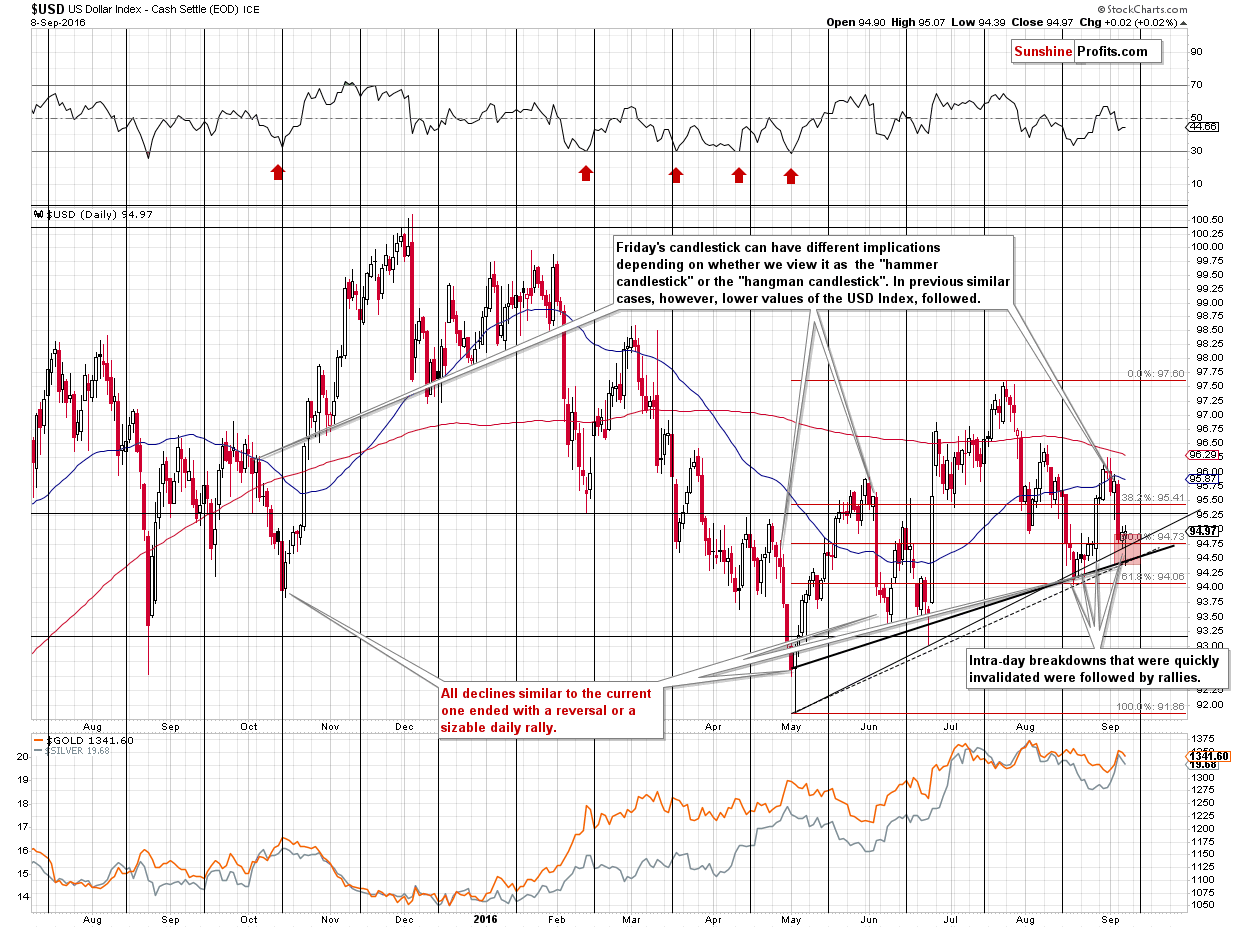
Now, since the USD Index has already moved to the mentioned 50% retracement, is the bottom in? It could be, but it doesn’t have to be. If it had taken several days for the USD Index to reach this level (and the rising support line, at the same time), we would view the bottom as being most likely in, but given that it took just one day to decline so significantly, we think that there might be a few additional daily declines before the decline is truly over.
The sessions that we marked on the above chart (similar based on the hangman candlestick and also based on the follow-up decline) were all followed by at least a few daily declines, which suggests that there may be more to come.
Consequently, we added other relevant support levels to the above chart to estimate the size of the entire short-term move. It appears that most of the decline is already behind us, but an additional slide – to 94.50 or so is quite possible as well. The lowest of the likely target levels is created by the 61.8% Fibonacci retracement and the August low at about 94. We don’t expect the USD Index to move below this level (if it is not stopped higher – for instance at 94.50 or at the current levels – that is).
The USD Index bottomed almost exactly at 94.50 – at the intersection of 2 support lines and at the lower border of our target area. This, by itself, suggests that the bottom is in.
However, the way the USD bottomed (on an intra-day basis) yesterday, makes it even more likely that the bottom for this short-term decline is in. The USD Index formed a hammer reversal candlestick and this is what we saw in case of the final part of previous similar declines. The declines that started with the “hangman” candlestick were all followed by steep declines (with only very temporary pauses) and they ended when the USD proved that it could end one session higher and/or if the USD managed to reverse visibly before the session’s end. We saw both yesterday: the reversal and a daily move higher (only a slight one, but still).
Moreover, similar daily reversals were seen when the USD moved to the rising support line (the highest one) in the second half of August. They were followed by a sharp rally.
Finally, please note that gold didn’t move to new highs yesterday (far from it – gold actually declined) even though the USD moved to new lows – which is a clear sign of underperformance and a bearish confirmation.
All in all, yesterday’s session’s implications are bullish for the USD Index and that makes them bearish for gold, silver and mining stocks.
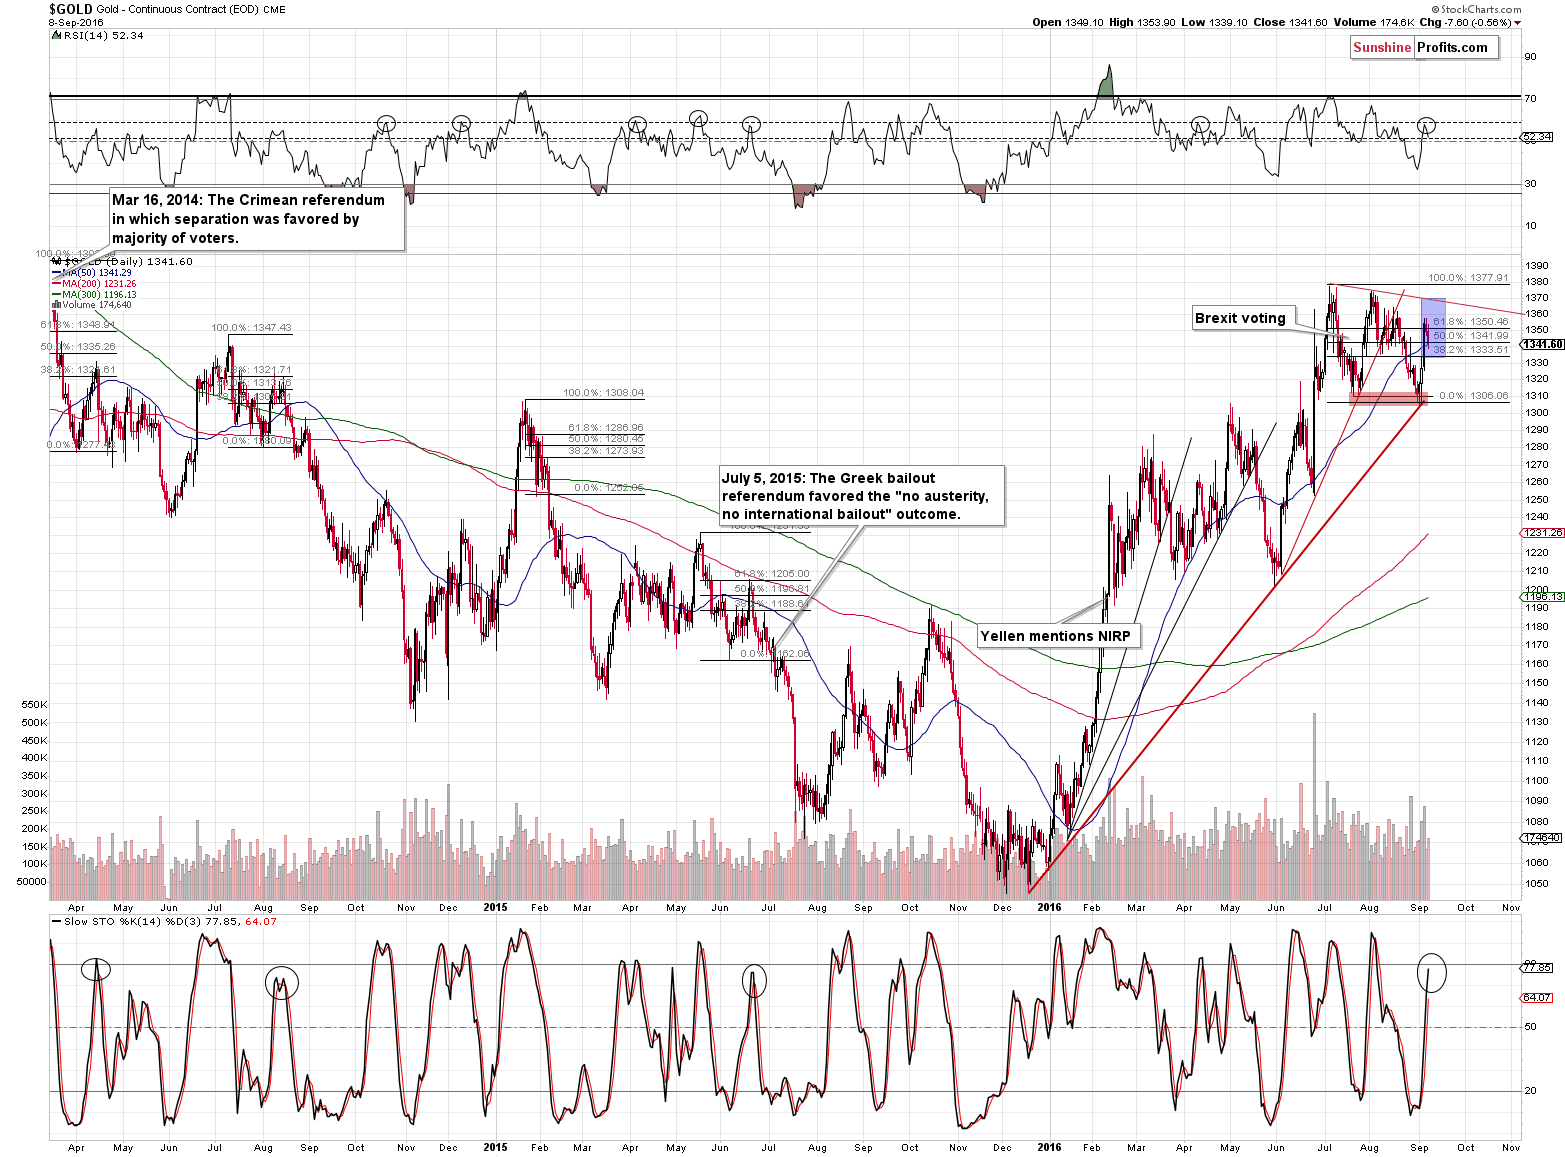
In the case of gold, we saw a breakdown back below the 50% retracement and the 50-day moving average. The volume was not big, but that doesn’t have bullish implications, as the average or even low volume is what we previously saw after local tops, especially similar ones – the initial part of the decline in mid-June took place on relatively low volume and the same goes for the initial part of the decline that we saw in the first half of August 2015.
Looking at indicators also provides us with bearish indications. The RSI indicator (upper part of the above chart) moved to the horizontal dashed line at about 60 and declined from there. It may seem to be nothing important, until one sees that the same thing accompanied quite a few local tops in the past.
What about the Stochastic indicator (lower part of the above chart)? It's almost at the 80 level, moving above which would indicate an overbought condition, but please note that many tops took place with the Stochastic just below this level. In fact, most similar topping formations (initial decline, then a correction to the 61.8% Fibonacci retracement and a continuation of the decline) were accompanied by the Stochastic moving to 70+, but not reaching 80. Consequently, the current position of this indicator is in tune with what happened previously when gold turned south and started powerful declines.
The implications are bearish.
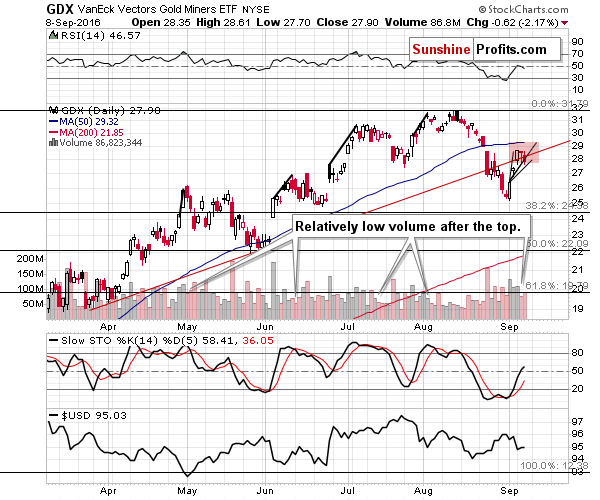
Mining stocks provide us with bearish implications as well. The volume increased yesterday when miners declined, but it was not huge and… It’s not bullish. In fact, that’s what happened previously after similar tops – the initial parts of the declines (marked on the chart) were accompanied by relatively low volume.
As far as the price is concerned, please note that miners broke – and closed below – the rising red support / resistance line. This serves as a bearish signal, as this is an invalidation of the previous breakout.
Time-wise, we also have a situation in which miners seem to be ready to decline. Plotting the previous shapes of rallies on the early-September upswing provided us with a target area, but that’s not only an area for prices, but also for time. Miners seem to have taken more or less the average amount of time that they took previously to rally – they are still within the target, but the time is half up. Consequently, a decline here would be very much in tune with the past price patterns.
Summing up, the outlook for the precious metals market deteriorated based on yesterday’s session and it seems that the next big downswing in the precious metals market is already underway. If it’s not, then metals and miners are not likely to rally far before turning south anyway. Consequently, it seems that speculative short positions are now justified from the risk to reward point of view.
As always, we will keep you – our subscribers – updated.
To summarize:
Trading capital (supplementary part of the portfolio; our opinion): Short positions (100% of the full position) in gold, silver and mining stocks are justified from the risk/reward perspective with the following entry prices, stop-loss orders and initial target price levels:
- Gold: initial target price: $1,006; stop-loss: $1,393, initial target price for the DGLD ETN: $74.37; stop-loss for the DGLD ETN $36.89
- Silver: initial target price: $13.12; stop-loss: $21.63, initial target price for the DSLV ETN: $39.78; stop-loss for the DSLV ETN $14.34
- Mining stocks (price levels for the GDX ETF): initial target price: $9.34; stop-loss: $33.17, initial target price for the DUST ETF: $297; stop-loss for the DUST ETF $18.80
In case one wants to bet on junior mining stocks' prices (we do not suggest doing so – we think senior mining stocks are more predictable in the case of short-term trades – if one wants to do it anyway, we provide the details), here are the stop-loss details and initial target prices:
- GDXJ ETF: initial target price: $14.13; stop-loss: $54.29
- JDST ETF: initial target price: $245; stop-loss: $15.80
Long-term capital (core part of the portfolio; our opinion): No positions
Insurance capital (core part of the portfolio; our opinion): Full position
Plus, you might want to read why our stop-loss orders are usually relatively far from the current price.
Please note that a full position doesn’t mean using all of the capital for a given trade. You will find details on our thoughts on gold portfolio structuring in the Key Insights section on our website.
As a reminder – “initial target price” means exactly that – an “initial” one, it’s not a price level at which we suggest closing positions. If this becomes the case (like it did in the previous trade) we will refer to these levels as levels of exit orders (exactly as we’ve done previously). Stop-loss levels, however, are naturally not “initial”, but something that, in our opinion, might be entered as an order.
Since it is impossible to synchronize target prices and stop-loss levels for all the ETFs and ETNs with the main markets that we provide these levels for (gold, silver and mining stocks – the GDX ETF), the stop-loss levels and target prices for other ETNs and ETF (among other: UGLD, DGLD, USLV, DSLV, NUGT, DUST, JNUG, JDST) are provided as supplementary, and not as “final”. This means that if a stop-loss or a target level is reached for any of the “additional instruments” (DGLD for instance), but not for the “main instrument” (gold in this case), we will view positions in both gold and DGLD as still open and the stop-loss for DGLD would have to be moved lower. On the other hand, if gold moves to a stop-loss level but DGLD doesn’t, then we will view both positions (in gold and DGLD) as closed. In other words, since it’s not possible to be 100% certain that each related instrument moves to a given level when the underlying instrument does, we can’t provide levels that would be binding. The levels that we do provide are our best estimate of the levels that will correspond to the levels in the underlying assets, but it will be the underlying assets that one will need to focus on regarding the signs pointing to closing a given position or keeping it open. We might adjust the levels in the “additional instruments” without adjusting the levels in the “main instruments”, which will simply mean that we have improved our estimation of these levels, not that we changed our outlook on the markets. We are already working on a tool that would update these levels on a daily basis for the most popular ETFs, ETNs and individual mining stocks.
Our preferred ways to invest in and to trade gold along with the reasoning can be found in the how to buy gold section. Additionally, our preferred ETFs and ETNs can be found in our Gold & Silver ETF Ranking.
As always, we'll keep you - our subscribers - updated should our views on the market change. We will continue to send out Gold & Silver Trading Alerts on each trading day and we will send additional Alerts whenever appropriate.
The trading position presented above is the netted version of positions based on subjective signals (opinion) from your Editor, and the Tools and Indicators.
As a reminder, Gold & Silver Trading Alerts are posted before or on each trading day (we usually post them before the opening bell, but we don't promise doing that each day). If there's anything urgent, we will send you an additional small alert before posting the main one.
=====
Latest Free Trading Alerts:
Yesterday, the European Central Bank released its most recent monetary policy statement. What does it imply for the gold market?
September ECB Meeting and Gold
The ISM non-manufacturing index fell to 51.4 percent in August. What does it imply for the gold market?
Will U.S. Services Push Gold Up?
The unique 2016 U.S. presidential election is just weeks away. Consequently, we invite you to read our today’s article presenting the precious metals market’s performance during presidential election cycle. In particular, we encourage you to learn how gold, silver and gold stocks were affected by the presidential cycle and how they are likely to perform in the future.
Gold during Presidential Election Cycle
Earlier today, the Australian Bureau of Statistics reported that the trade deficit narrowed to A$2.410 billion in July, beating analysts’ forecasts. Thanks to these solid numbers, the Australian dollar extended gains against its U.S. counterpart, which pushed AUD/USD above short-term resistance zone. How high could the exchange rate go in the coming days?
Forex Trading Alert: AUD/USD – Where Are Currency Bears?
=====
Hand-picked precious-metals-related links:
Asia Gold-Higher prices hurt demand; Indian festivals likely to ignite interest
Deeper Gets Deadly for Workers in Aging South Africa Gold Mines
Blockchain could revive gold’s role as a payments currency
=====
In other news:
U.S. Index Futures Retreat With S&P 500 Stuck in Two-Month Lull
Gundlach Says It’s Time to Get Defensive as Rates May Rise
Fed Urges U.S. Ban on Wall Street Buying Stakes in Companies
Draghi Asset Buying Deepens the Hole in Europe’s Pension Funds
Draghi just fueled speculation the ECB is pressuring governments to splash the cash
$9 trillion and counting: How central banks are still flooding the world with money
Oil soars as glut shrinks by most since '99
=====
Thank you.
Sincerely,
Przemyslaw Radomski, CFA
Founder, Editor-in-chief, Gold & Silver Fund Manager
Gold & Silver Trading Alerts
Forex Trading Alerts
Oil Investment Updates
Oil Trading Alerts

