

Briefly: Short positions (150% of the full position) in gold, silver and mining stocks are justified from the risk/reward perspective.
Gold, silver and mining stocks rallied strongly on Friday, but the rally was quite short-lived. It didn’t take more than a few hours for the entire rally to be cancelled – PMs and mining stocks were more or less back to their previous closing prices before the session was over. What are the implications?
Let’s take a closer look at the charts (charts courtesy of http://stockcharts.com).
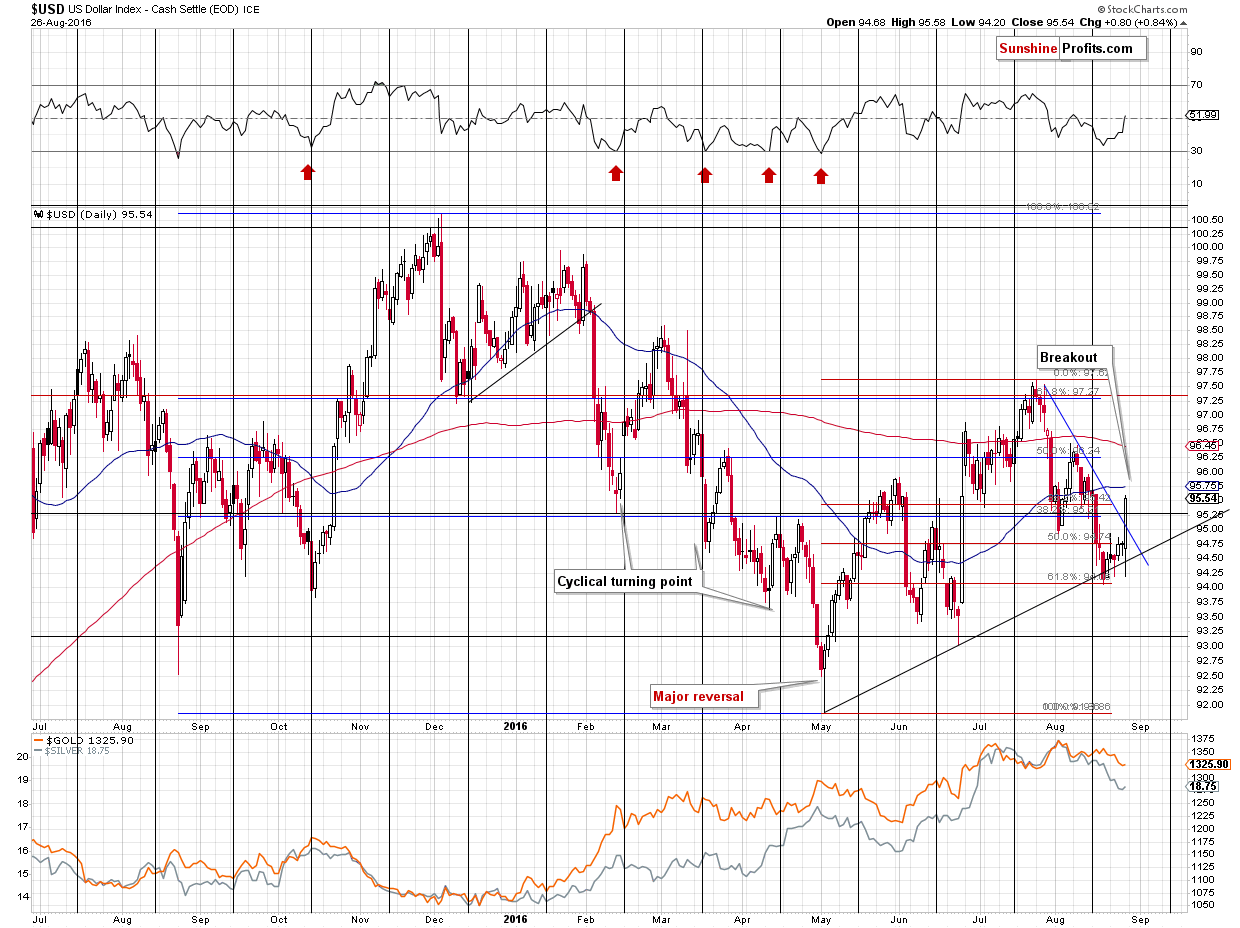
The USD Index has clearly soared on Friday after a small attempt to move below the rising support line. The tiny breakdown was quickly invalidated and the US dollar soared, even moving above the declining resistance line. The breakout above it was quite clear and significant and the consequences thereof are bullish. The implications for the precious metals market are bearish.
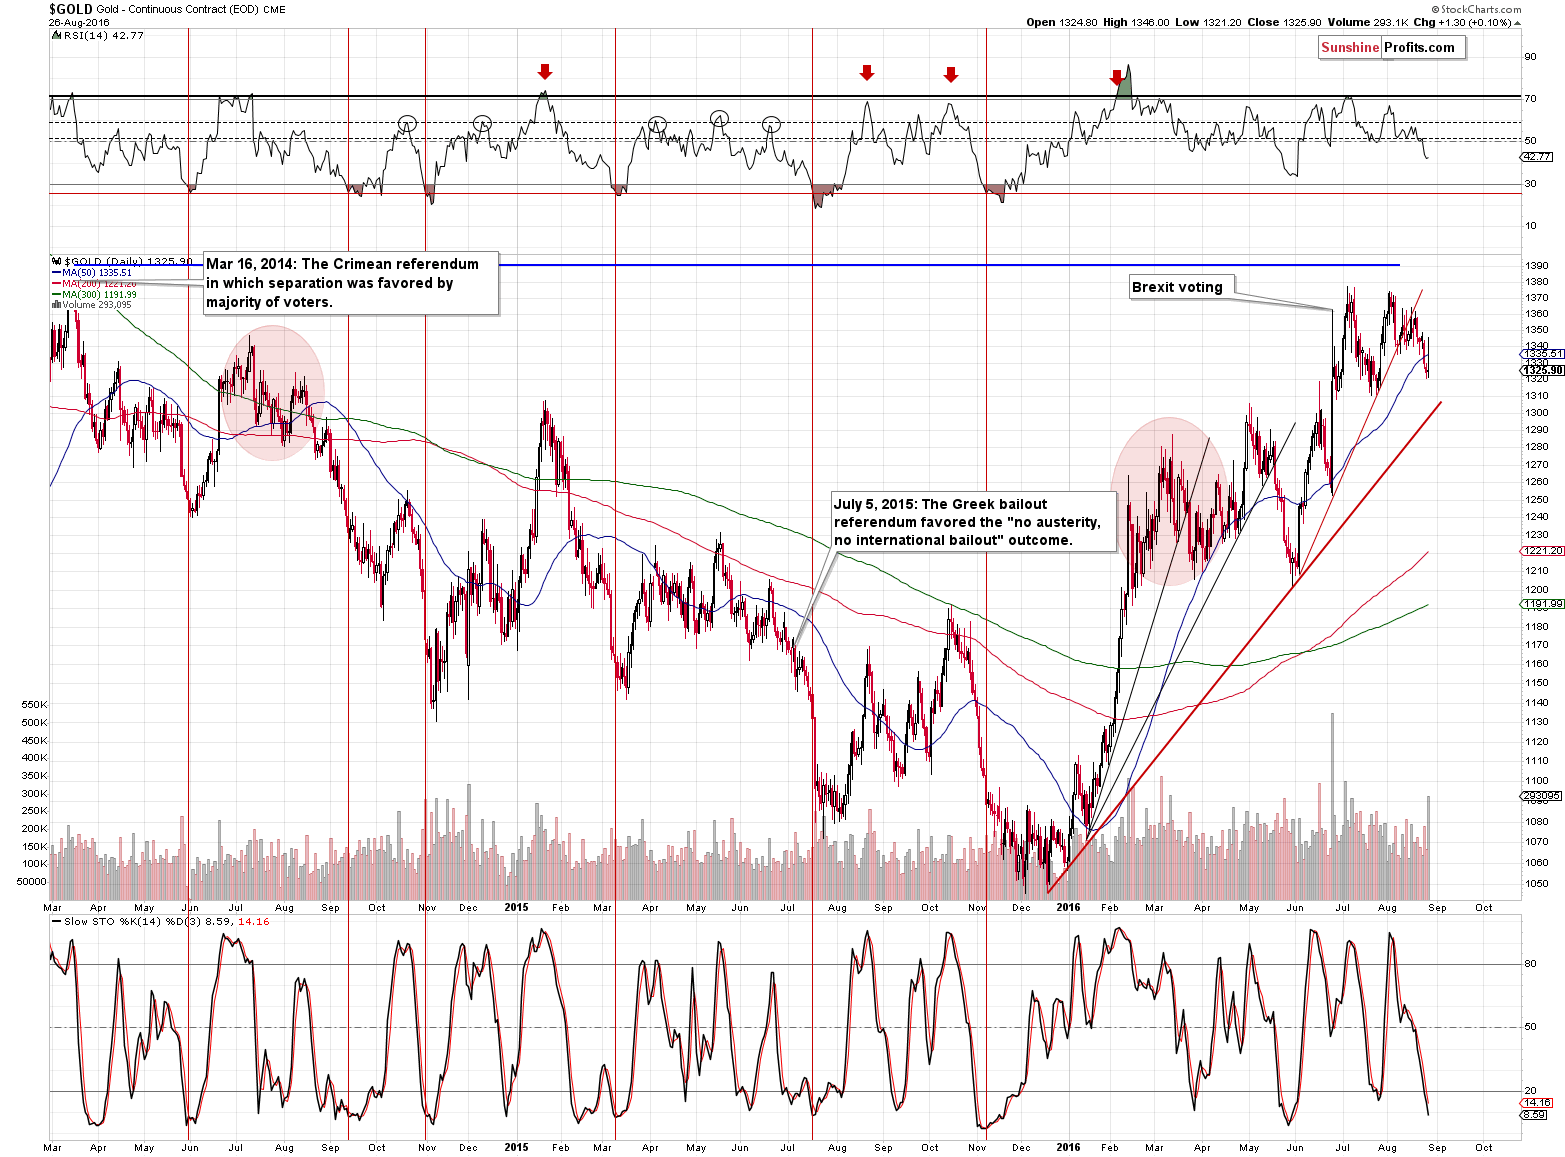
The gold price didn’t change much, in terms of closing prices, but we saw an intra-day rally and then a subsequent slide on Friday. The accompanying volume was huge, which makes this session significant. In some cases, such a move back and forth on huge volume could have bullish implications, but we don’t think this was really the case on Friday. Months ago, when Yellen just mentioned the zero-rate interest rate policy, gold soared tens of dollars higher and when decreasing the rates when it appears necessary was mentioned again on Friday, gold didn’t do anything (in terms of closing prices). The strength of reaction has surely weakened and the implications are bearish.
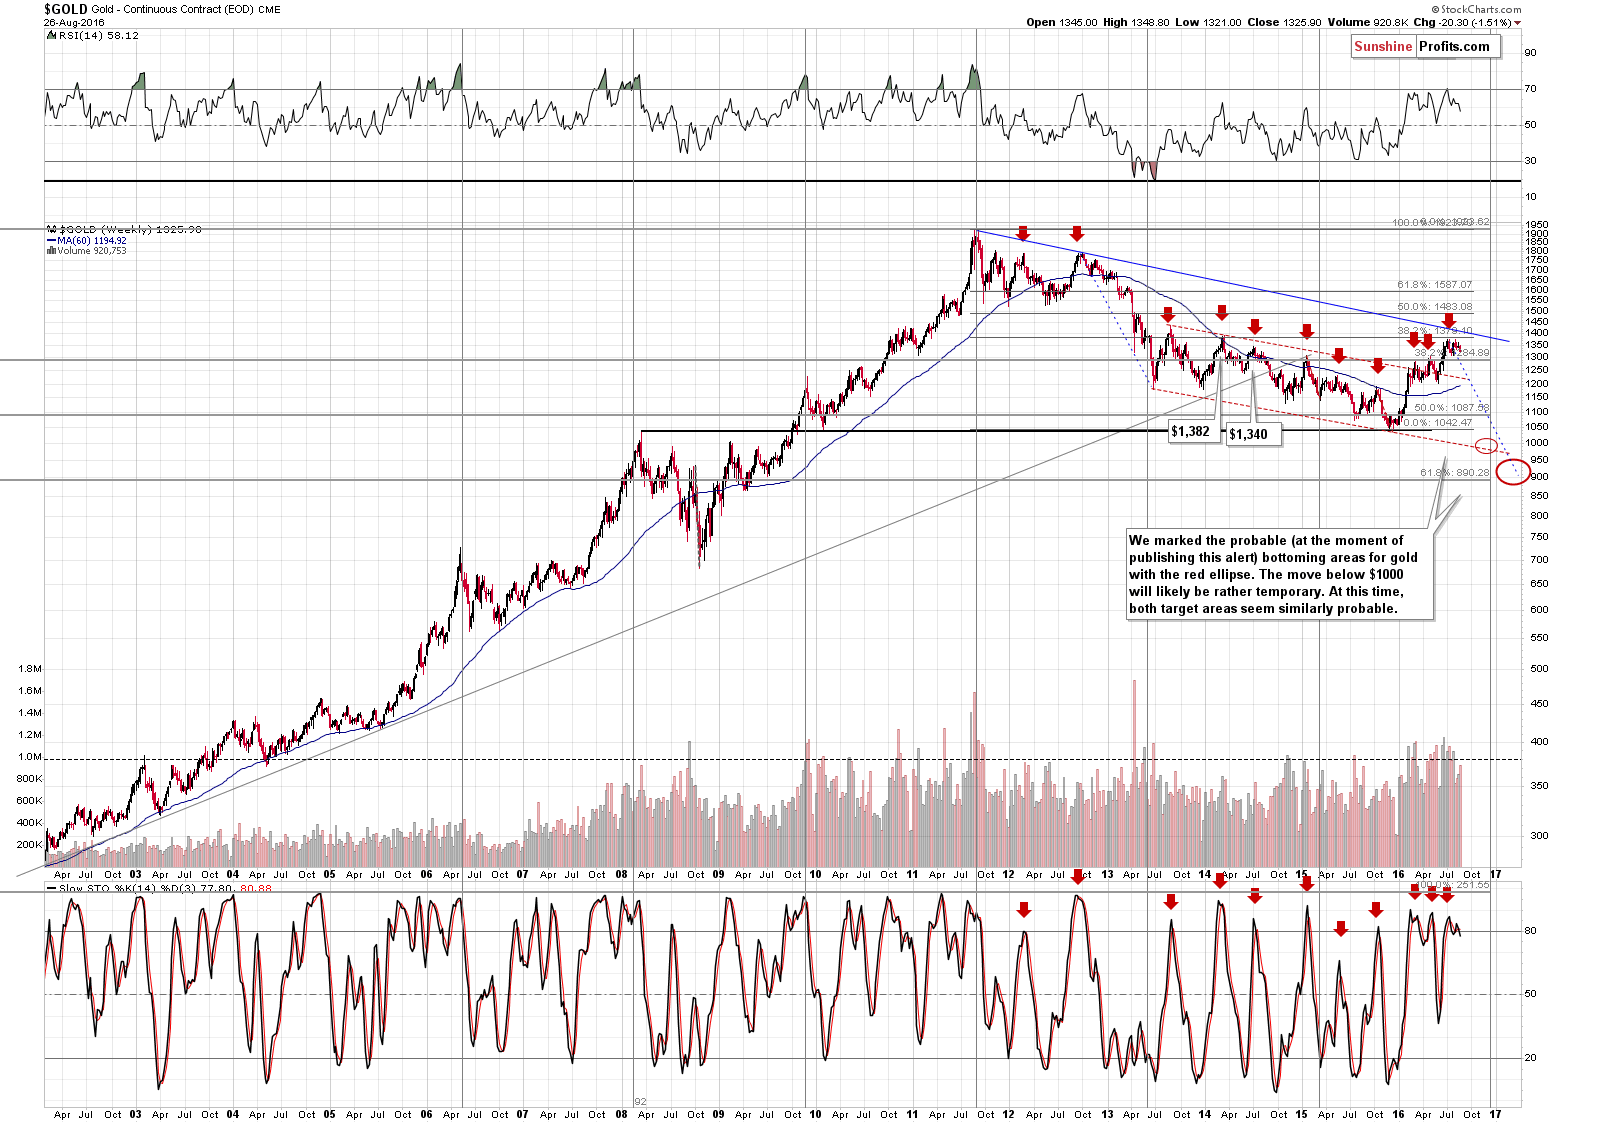
In case of the weekly price changes, gold moved lower as well – more than $20 lower. The important thing is that the volume rose as the price declined, confirming the direction of the move. The sell signal from the weekly version of the Stochastic indicator remains in place and the overall implications remain bearish.
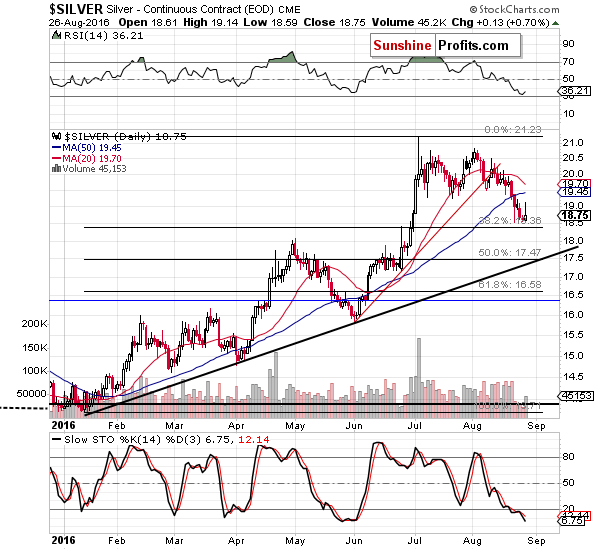
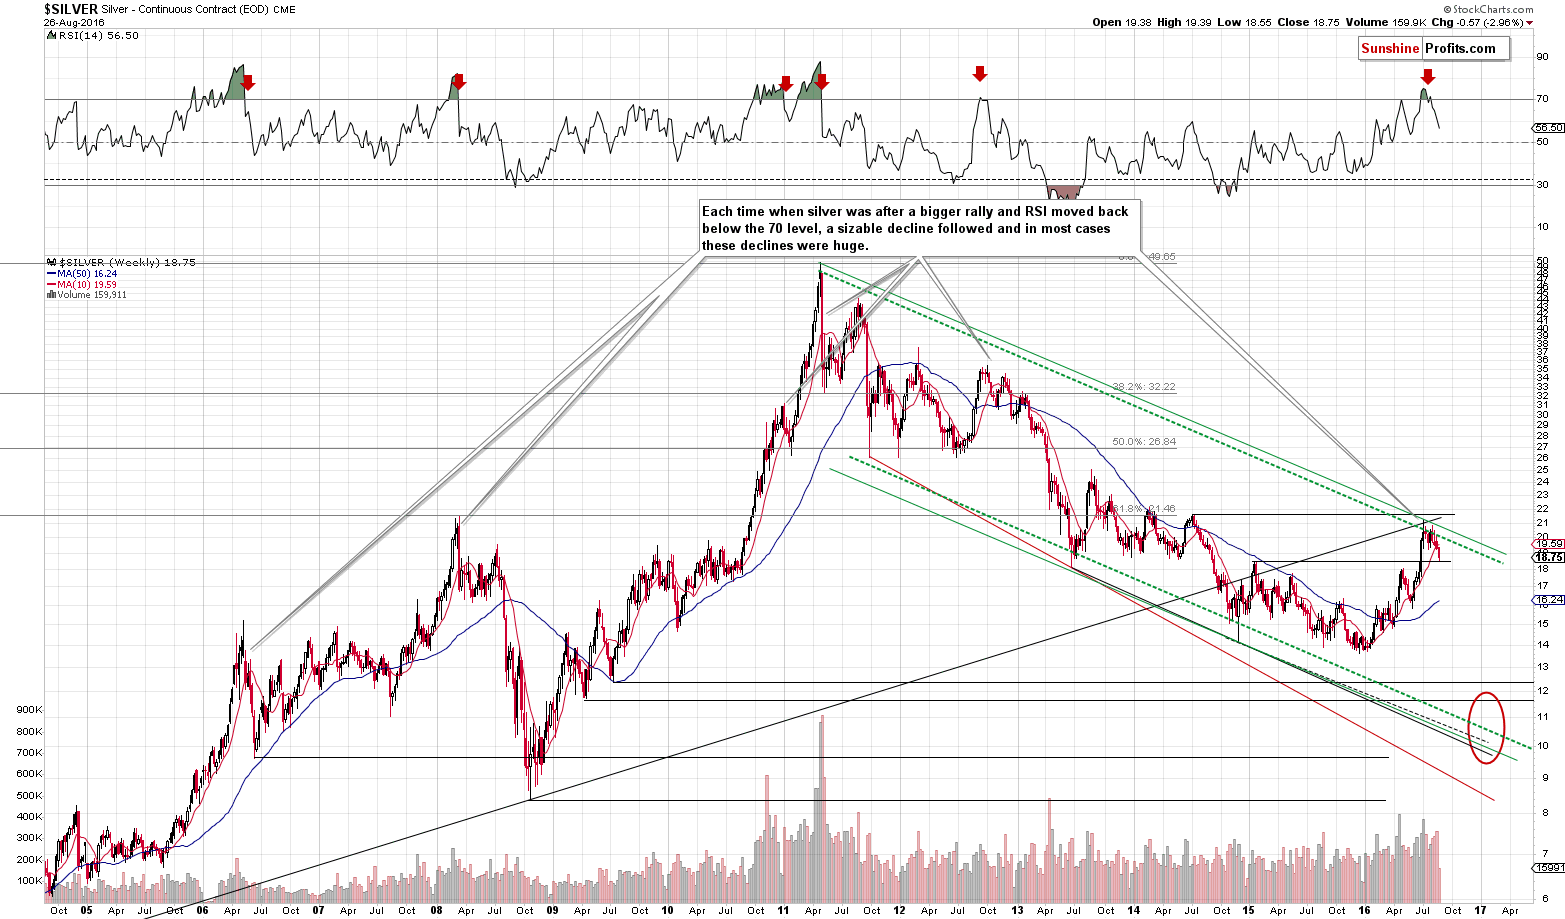
The intra-day action in silver is similar to the one in gold. The volume during the reversal (to the downside) was big when compared to the recent sessions, but not big in comparison to the sessions that we saw earlier this month. The implications are bearish but not strongly so.
We previously wrote that silver could pause based on the proximity of the 38.2% Fibonacci retracement and the 2015 high and it seems that we saw just that. Silver didn’t break lower, but it also didn’t rally back up. The trend remains bearish.
The weekly volume wasn’t huge, but that is not bullish as this was also the course of action in case of the early parts of the previous major declines. For instance, we saw the same thing is March 2012 and March 2013.
We previously wrote the following about silver’s bearish relationships with currencies:
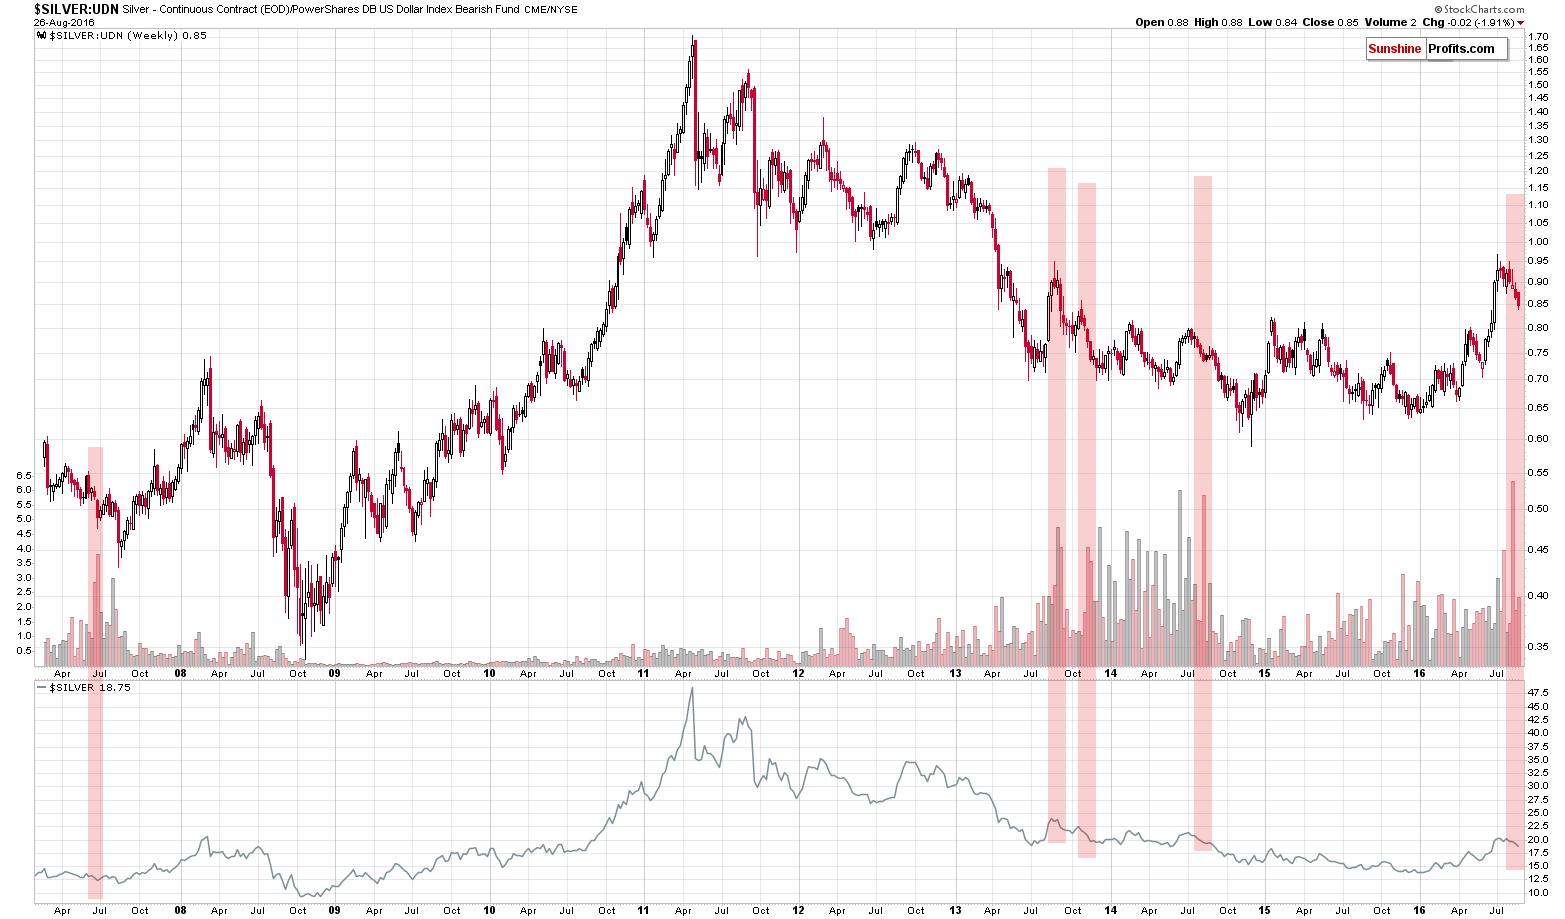
What’s interesting on the above [silver:UDN] chart? 2 things. One thing is the invalidation of silver’s brief move above the 2013 high. Naturally, the implications thereof are bearish. The second thing is the exceptionally high reading in weekly volume that we saw last week (precisely: the ratio of volumes: silver vs. the UDN ETF). We marked similar situations in the past with red rectangles. In all previous cases (since 2007 – we don’t have the UDN data before that time) silver declined in the short term and in most cases (the most recent ones) silver declined very significantly in the following weeks. The implications of the above chart are clearly bearish.
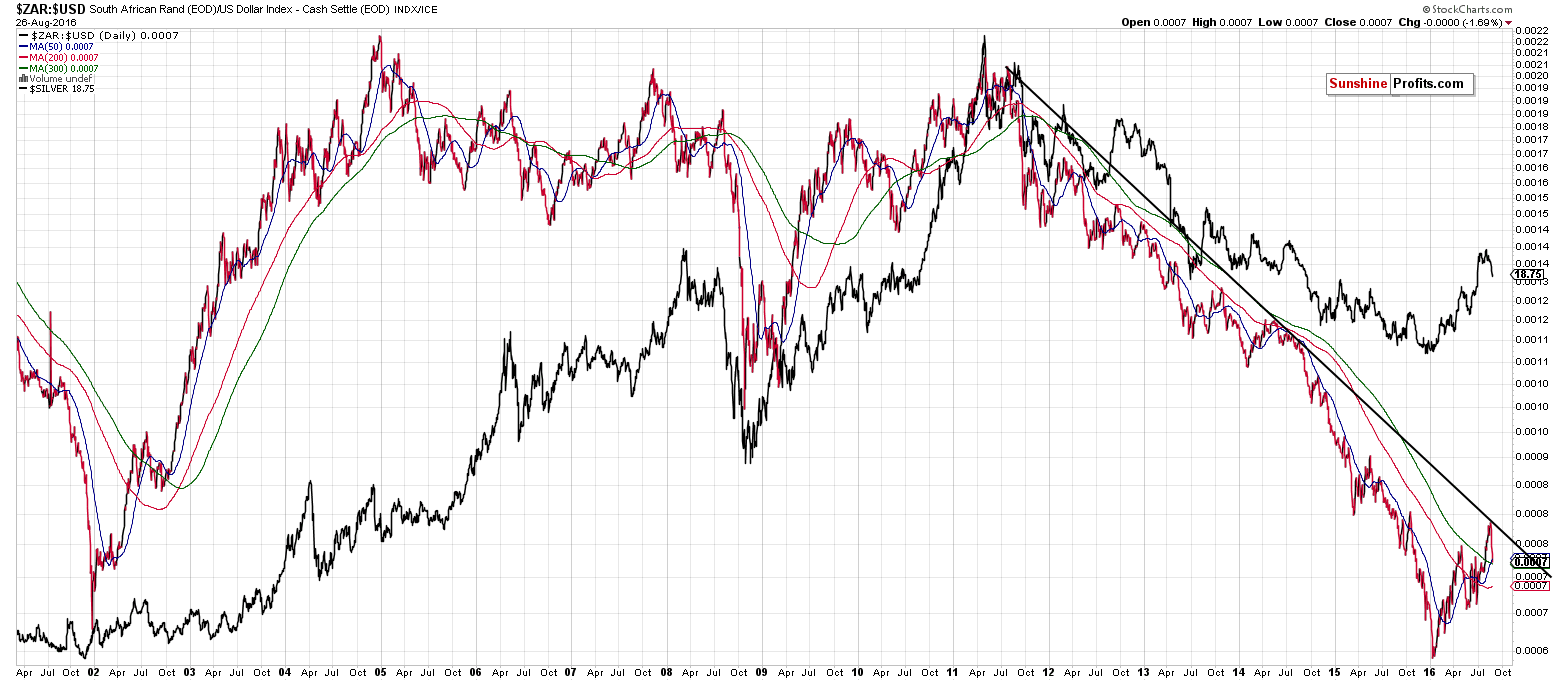
We were asked to comment on the link between silver and the ratio of the South African rand and the USD Index. There is indeed a quite strong medium-term correlation between the two, as you can see on the above chart. In particular, since mid-2008 the tops and bottoms were quite in tune with each other. At times they formed at the same time and at times they were a few weeks apart from each other, but more or less both markets moved in the same direction in the short term and medium term on multiple occasions. In particular, the alignment was quite clear so far this year.
How can this help us determine what’s likely ahead for silver? Well, the ratio is about to encounter a very strong, long-term resistance line and the implications thereof are strongly bearish. If the link between the two is to be upheld, we can expect it to correspond to a decline in the price of the white metal.
The Rand ratio did indeed move lower after touching the declining resistance line and the implications for the silver market remain bearish.
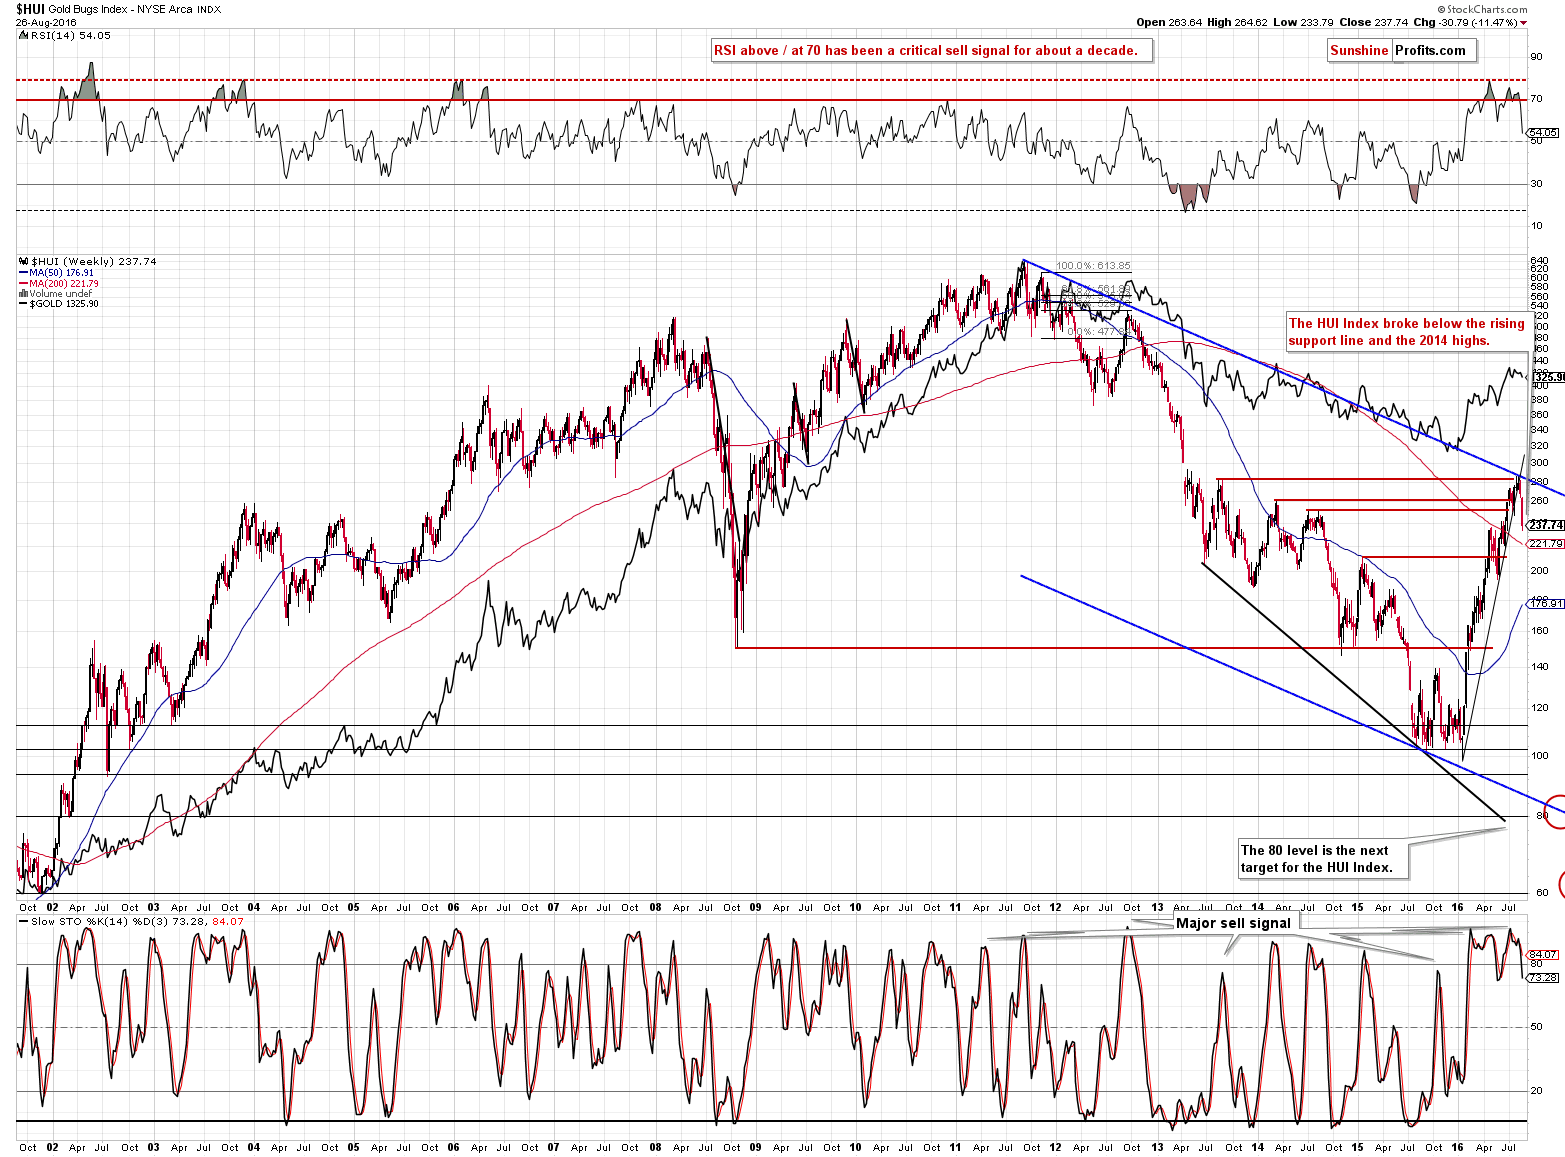
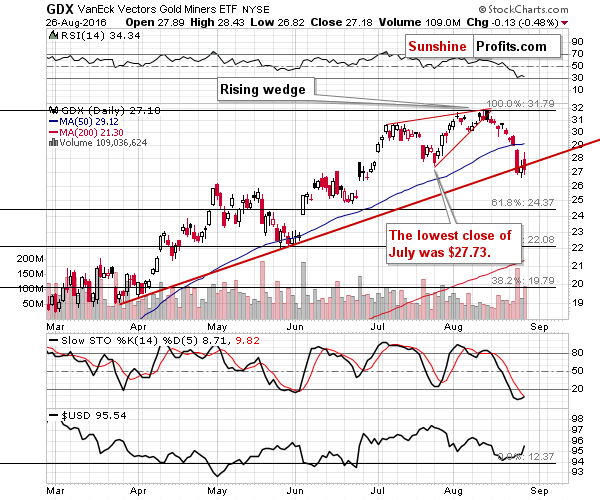
In case of mining stocks, we saw a daily and – most importantly – weekly decline (confirmed by weekly closing prices) that took miners below the rising short-term support line and both 2014 highs. The implications are bearish, especially that Friday’s reversal and decline took place on relatively strong volume.
Summing up, the analogy to the 1983 decline remains in place and so do many bearish signals discussed previously. Friday’s failed attempts to move higher in gold, silver and mining stocks confirm the bearish outlook.
As always, we will keep you – our subscribers – updated.
To summarize:
Trading capital (supplementary part of the portfolio; our opinion): Short positions (150% of the full position) in gold, silver and mining stocks are justified from the risk/reward perspective with the following entry prices, stop-loss orders and initial target price levels:
- Gold: initial target price: $1,006; stop-loss: $1,423, initial target price for the DGLD ETN: $74.37; stop-loss for the DGLD ETN $34.91
- Silver: initial target price: $13.12; stop-loss: $21.63, initial target price for the DSLV ETN: $39.78; stop-loss for the DSLV ETN $14.34
- Mining stocks (price levels for the GDX ETF): initial target price: $9.34; stop-loss: $33.17, initial target price for the DUST ETF: $297; stop-loss for the DUST ETF $18.80 (we have adjusted the prices for the DUST ETF based on the 5 for 1 split)
In case one wants to bet on junior mining stocks' prices (we do not suggest doing so – we think senior mining stocks are more predictable in the case of short-term trades – if one wants to do it anyway, we provide the details), here are the stop-loss details and initial target prices:
- GDXJ ETF: initial target price: $14.13; stop-loss: $54.29
- JDST ETF: initial target price: $245; stop-loss: $15.80
Long-term capital (core part of the portfolio; our opinion): No positions
Insurance capital (core part of the portfolio; our opinion): Full position
Plus, you might want to read why our stop-loss orders are usually relatively far from the current price.
Please note that a full position doesn’t mean using all of the capital for a given trade. You will find details on our thoughts on gold portfolio structuring in the Key Insights section on our website.
As a reminder – “initial target price” means exactly that – an “initial” one, it’s not a price level at which we suggest closing positions. If this becomes the case (like it did in the previous trade) we will refer to these levels as levels of exit orders (exactly as we’ve done previously). Stop-loss levels, however, are naturally not “initial”, but something that, in our opinion, might be entered as an order.
Since it is impossible to synchronize target prices and stop-loss levels for all the ETFs and ETNs with the main markets that we provide these levels for (gold, silver and mining stocks – the GDX ETF), the stop-loss levels and target prices for other ETNs and ETF (among other: UGLD, DGLD, USLV, DSLV, NUGT, DUST, JNUG, JDST) are provided as supplementary, and not as “final”. This means that if a stop-loss or a target level is reached for any of the “additional instruments” (DGLD for instance), but not for the “main instrument” (gold in this case), we will view positions in both gold and DGLD as still open and the stop-loss for DGLD would have to be moved lower. On the other hand, if gold moves to a stop-loss level but DGLD doesn’t, then we will view both positions (in gold and DGLD) as closed. In other words, since it’s not possible to be 100% certain that each related instrument moves to a given level when the underlying instrument does, we can’t provide levels that would be binding. The levels that we do provide are our best estimate of the levels that will correspond to the levels in the underlying assets, but it will be the underlying assets that one will need to focus on regarding the signs pointing to closing a given position or keeping it open. We might adjust the levels in the “additional instruments” without adjusting the levels in the “main instruments”, which will simply mean that we have improved our estimation of these levels, not that we changed our outlook on the markets. We are already working on a tool that would update these levels on a daily basis for the most popular ETFs, ETNs and individual mining stocks.
Our preferred ways to invest in and to trade gold along with the reasoning can be found in the how to buy gold section. Additionally, our preferred ETFs and ETNs can be found in our Gold & Silver ETF Ranking.
As always, we'll keep you - our subscribers - updated should our views on the market change. We will continue to send out Gold & Silver Trading Alerts on each trading day and we will send additional Alerts whenever appropriate.
The trading position presented above is the netted version of positions based on subjective signals (opinion) from your Editor, and the Tools and Indicators.
As a reminder, Gold & Silver Trading Alerts are posted before or on each trading day (we usually post them before the opening bell, but we don't promise doing that each day). If there's anything urgent, we will send you an additional small alert before posting the main one.
=====
Latest Free Trading Alerts:
On Friday, Fed Chair Janet Yellen delivered a speech entitled “Designing Resilient Monetary Policy Frameworks for the Future” at the Federal Reserve Bank of Kansas City in Jackson Hole, Wyoming. What can we learn from it?
Yellen’s Speech in Jackson Hole and Gold
S&P 500 index extends its short-term fluctuations. Is this a topping pattern or just consolidation before another leg up? Is holding short position still justified?
Stock Trading Alert: No Clear Short-Term Direction, Will It Continue Higher?
=====
Hand-picked precious-metals-related links:
Gold hits near 5-week low after Fed strikes hawkish note
Barrick signs on to Venezuela gold push as oil sinks economy
=====
In other news:
European Stocks Fall as Fed Outlook Lifts Dollar; Oil Declines
Yellen and FOMC accused of 'Fedequivocation' as hike jitters resurface
How the Next U.S. Jobs Report Could Influence the Fed
Central Bankers Spurn Call for Radical Approach at Jackson Hole
Draghi Silence Puts Numbers in Spotlight Before ECB Meeting
Cash hoarding reinforces China view further monetary easing futile: sources
India's growth pace likely slowed in April-June: Reuters Poll
US nonfarm payrolls, China manufacturing PMIs to drive sentiment this week
Banks are preparing for an ‘economic nuclear winter'
=====
Thank you.
Sincerely,
Przemyslaw Radomski, CFA
Founder, Editor-in-chief, Gold & Silver Fund Manager
Gold & Silver Trading Alerts
Forex Trading Alerts
Oil Investment Updates
Oil Trading Alerts

