

Briefly: Short positions (150% of the full position) in gold, silver and mining stocks are justified from the risk/reward perspective.
In Friday’s alert we focused on the very important action in the USD Index and we will start with it once again as the weekly closing prices further confirmed the importance of the signal.
Let’s take look at the USD Index chart (charts courtesy of http://stockcharts.com).
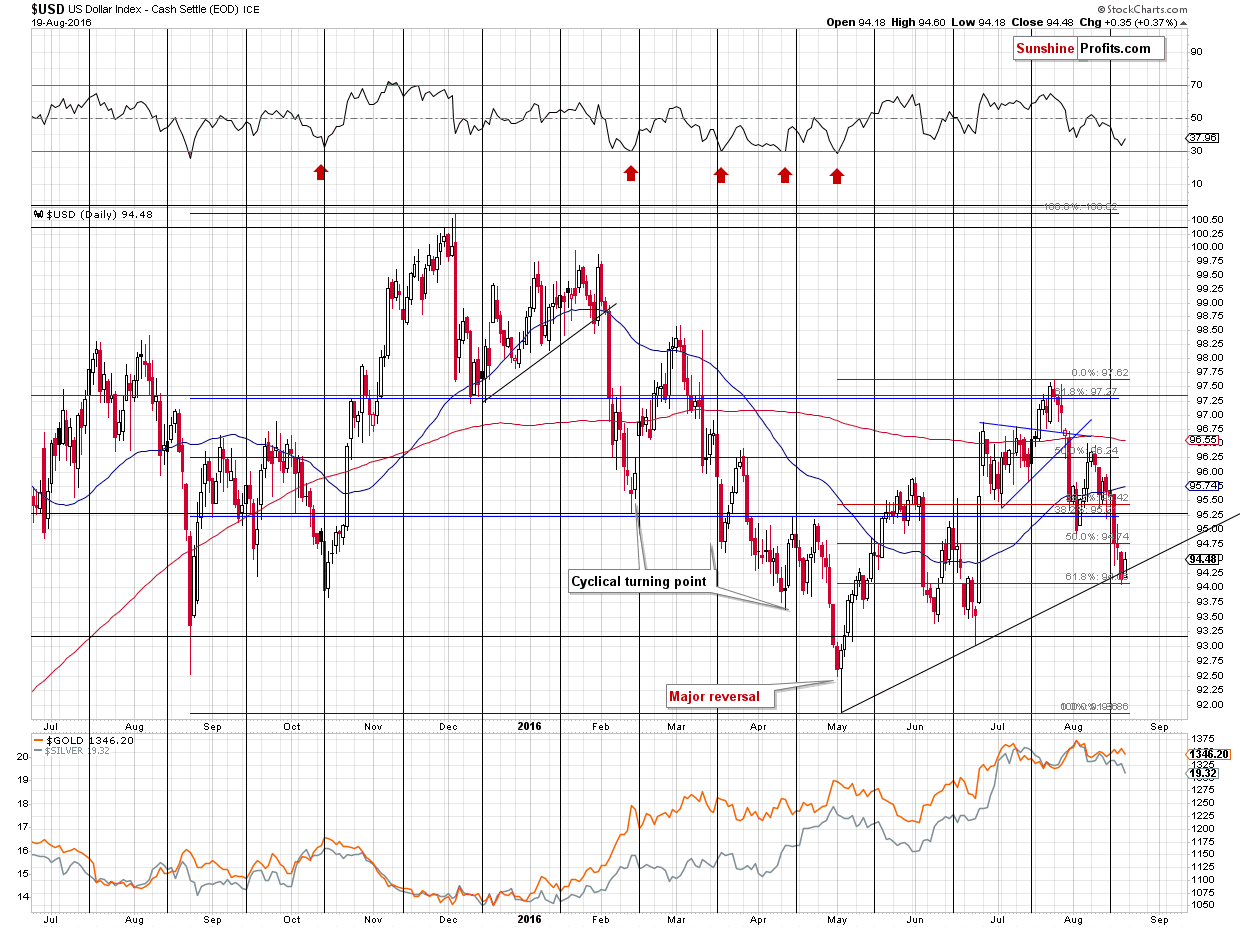
On Friday, we wrote the following:
The key thing is that there was no real breakdown.
In the previous alerts we wrote that the support was approximately at 94 – 94.2 and the lower border was based on the 61.8% Fibonacci retracement. The USD Index moved to this retracement and then bounced a bit back.
There was only a tiny move below the rising support line and nothing else. Moreover, this tiny breakdown has already been invalidated in today’s trading (with USD Index at about 94.5 at the moment of writing these words). The invalidation of the breakdown is a very bullish phenomenon by itself, and the implications are bearish for the precious metals sector.
Additionally, please note that the RSI indicator moved close to the 30 level and at times, the proximity of this level (for instance in October 2015) was enough to trigger a powerful rally.
The USD Index closed the week visibly above the rising support line and the temporary breakdown was clearly invalidated. The implications are bullish for the USD Index and bearish for the precious metals sector.
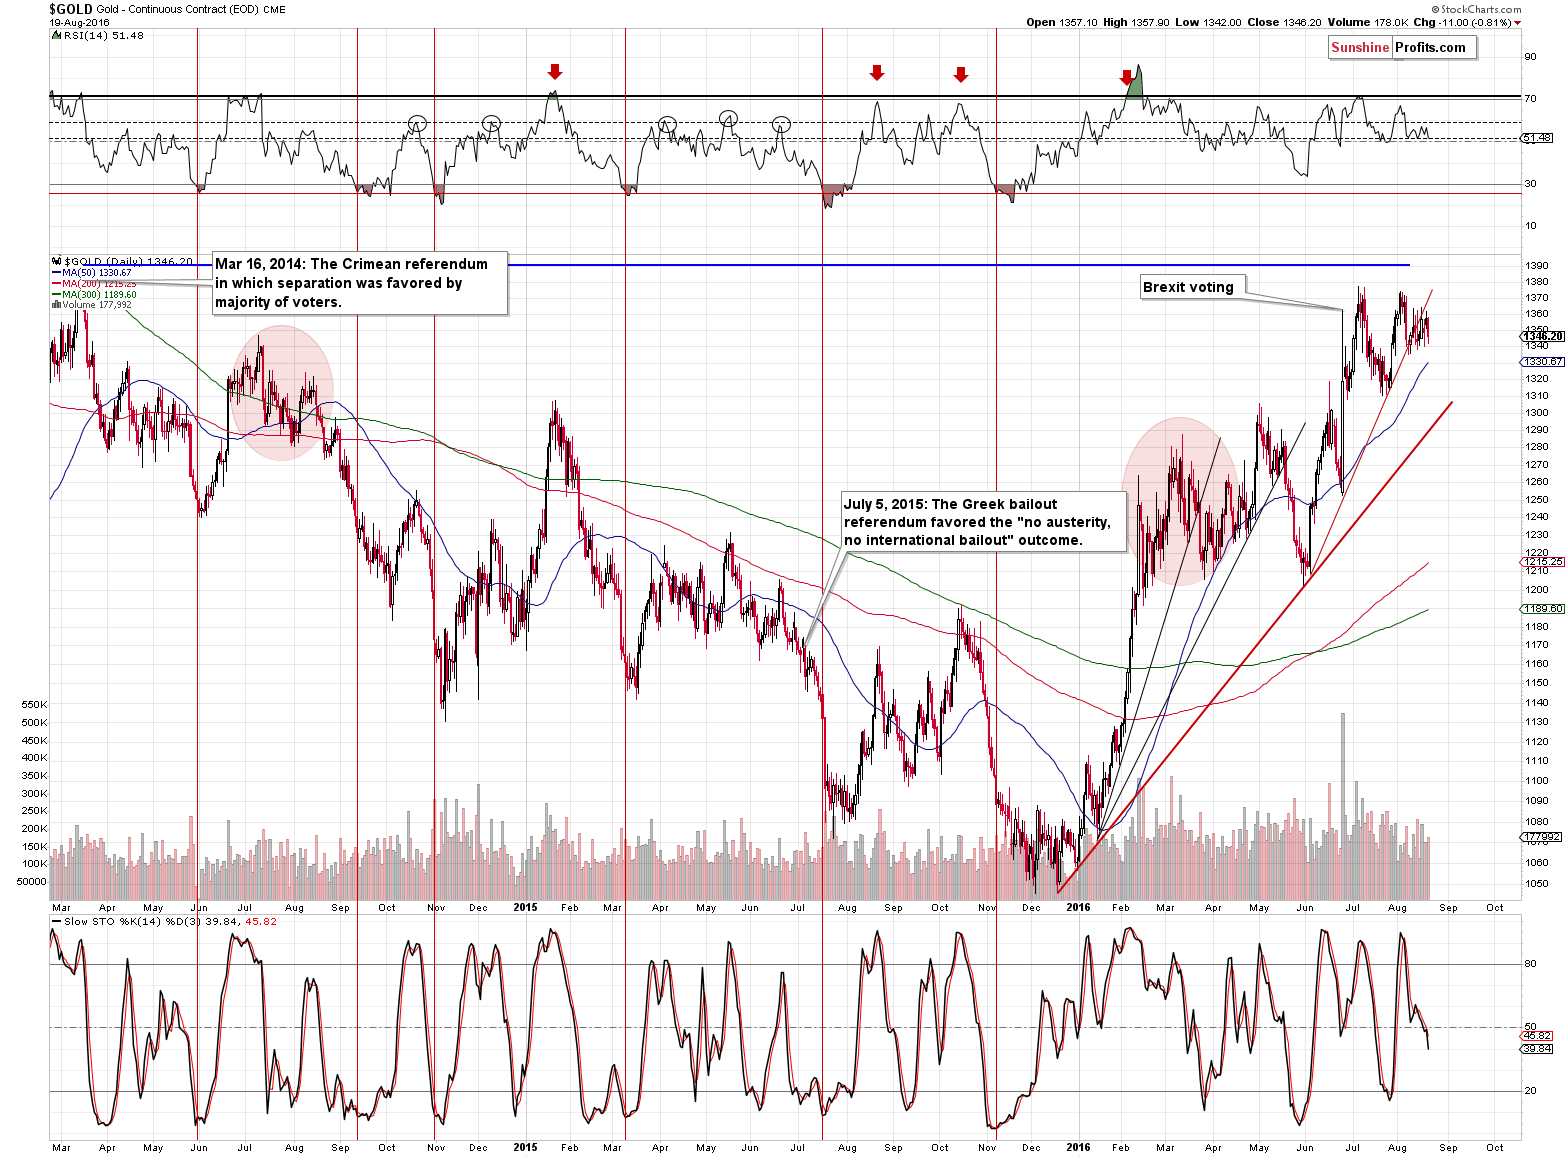
The action is gold was not as exciting – there was no breakdown or breakout – gold continued to trade sideways last week. However, at the moment of writing these words, gold is trading at about $1,333, so we could see a breakdown below the August lows shortly.
Looking at the weekly price changes provides us with more clarity and more bearish implications. Last week gold tried to move higher and once again failed, declining before the week was over, thus creating a bearish reversal weekly candlestick.
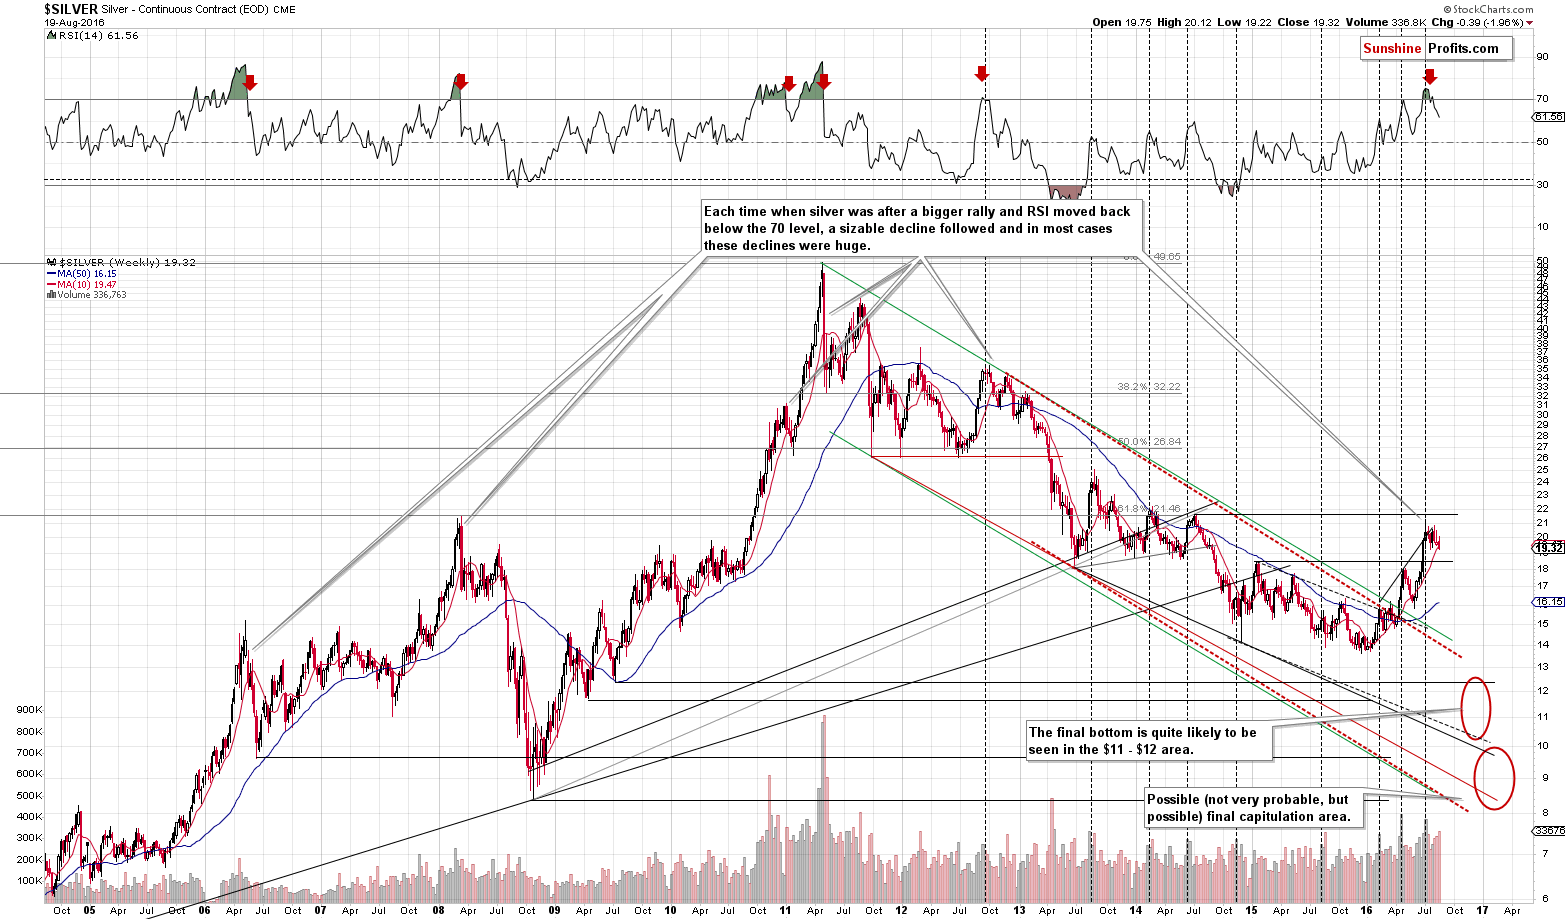
Silver declined more visibly last week, and the volume increased, confirming that silver is really starting a decline, not just pausing within a rally. At the moment of writing these words, silver is already after another pre-market slide, trading at about $18.90. The breakdown below the 50-day moving average (marked in red) is now clearly visible – in terms of both the weekly closing prices and intra-day prices.
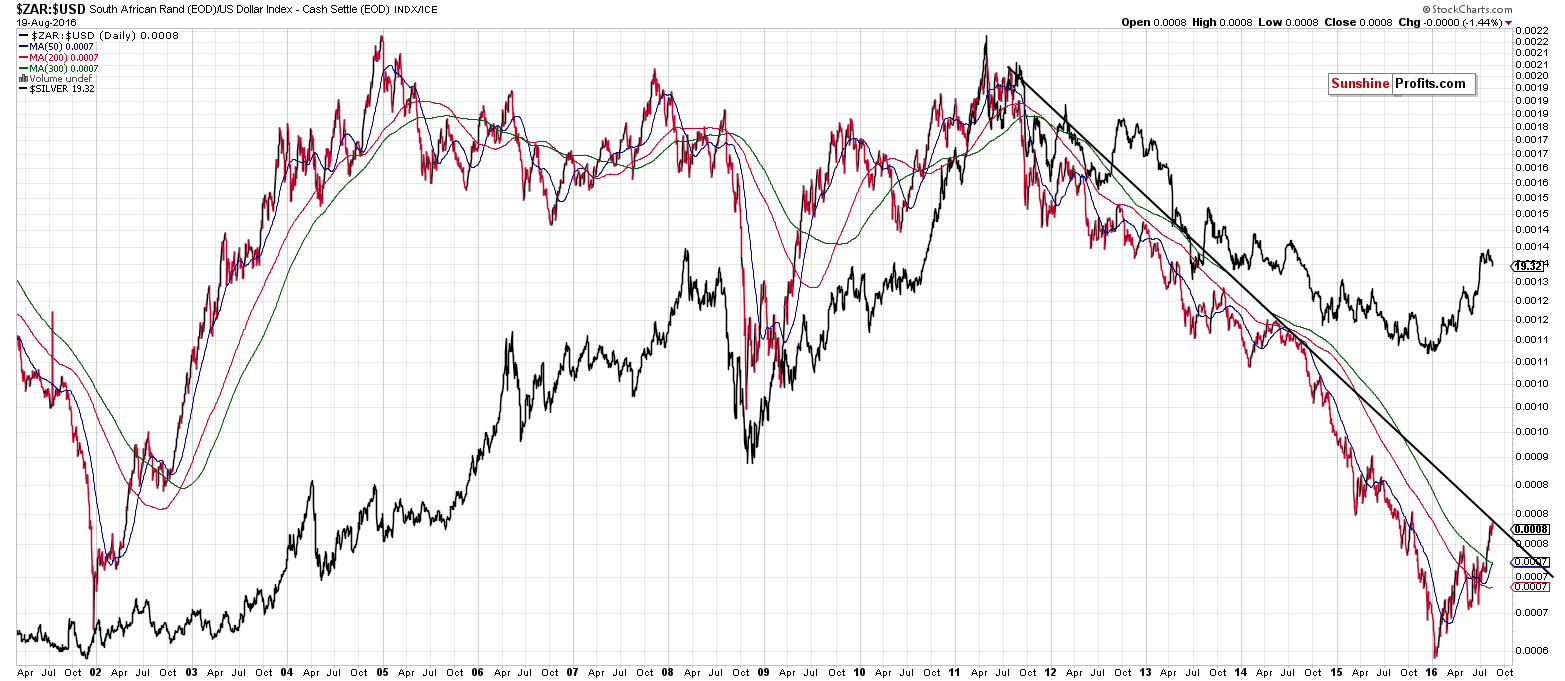
In last Monday’s alert we wrote the following about the above chart:
We were asked to comment on the link between silver and the ratio of the South African rand and the USD Index. There is indeed a quite strong medium-term correlation between the two, as you can see on the above chart. In particular, since mid-2008 the tops and bottoms were quite in tune with each other. At times they formed at the same time and at times they were a few weeks apart from each other, but more or less both markets moved in the same direction in the short term and medium term on multiple occasions. In particular, the alignment was quite clear so far this year.
How can this help us determine what’s likely ahead for silver? Well, the ratio is about to encounter a very strong, long-term resistance line and the implications thereof are strongly bearish. If the link between the two is to be upheld, we can expect it to correspond to a decline in the price of the white metal.
The mentioned resistance line was just reached, so we can expect a decline in both the ratio and silver.
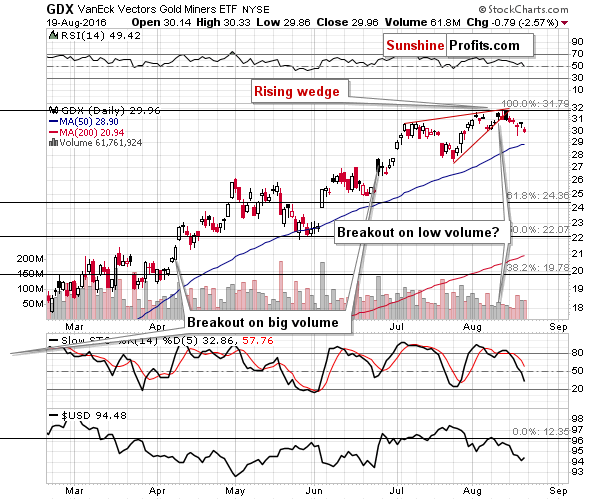
In the case of mining stocks, we see the decline’s continuation and a small breakdown below the previous August low. This is not yet a profoundly bearish development, but a move below the July low will serve as a strong bearish signal. We are likely to see it (not necessarily today, though) based on what’s going on in gold and silver today and also based on the fact that Friday’s decline took place on sizable volume.
Summing up, the analogy to the 1983 decline remains in place and so do many bearish signals discussed previously. Based on the invalidation of the breakdown in the USD Index, it seems that the decline in the USD and the rallies in gold, silver and mining stocks are over. The outlook for the precious metals sector is very bearish for the following weeks.
As always, we will keep you – our subscribers – updated.
To summarize:
Trading capital (supplementary part of the portfolio; our opinion): Short positions (150% of the full position) in gold, silver and mining stocks are justified from the risk/reward perspective with the following entry prices, stop-loss orders and initial target price levels:
- Gold: initial target price: $1,006; stop-loss: $1,423, initial target price for the DGLD ETN: $74.37; stop-loss for the DGLD ETN $34.91
- Silver: initial target price: $13.12; stop-loss: $21.63, initial target price for the DSLV ETN: $39.78; stop-loss for the DSLV ETN $14.34
- Mining stocks (price levels for the GDX ETF): initial target price: $9.34; stop-loss: $33.17, initial target price for the DUST ETF: $16.38; stop-loss for the DUST ETF $3.77
In case one wants to bet on junior mining stocks' prices (we do not suggest doing so – we think senior mining stocks are more predictable in the case of short-term trades – if one wants to do it anyway, we provide the details), here are the stop-loss details and initial target prices:
- GDXJ ETF: initial target price: $14.13; stop-loss: $54.29
- JDST ETF: initial target price: $14.39; stop-loss: $3.22
Long-term capital (core part of the portfolio; our opinion): No positions
Insurance capital (core part of the portfolio; our opinion): Full position
Plus, you might want to read why our stop-loss orders are usually relatively far from the current price.
Please note that a full position doesn’t mean using all of the capital for a given trade. You will find details on our thoughts on gold portfolio structuring in the Key Insights section on our website.
As a reminder – “initial target price” means exactly that – an “initial” one, it’s not a price level at which we suggest closing positions. If this becomes the case (like it did in the previous trade) we will refer to these levels as levels of exit orders (exactly as we’ve done previously). Stop-loss levels, however, are naturally not “initial”, but something that, in our opinion, might be entered as an order.
Since it is impossible to synchronize target prices and stop-loss levels for all the ETFs and ETNs with the main markets that we provide these levels for (gold, silver and mining stocks – the GDX ETF), the stop-loss levels and target prices for other ETNs and ETF (among other: UGLD, DGLD, USLV, DSLV, NUGT, DUST, JNUG, JDST) are provided as supplementary, and not as “final”. This means that if a stop-loss or a target level is reached for any of the “additional instruments” (DGLD for instance), but not for the “main instrument” (gold in this case), we will view positions in both gold and DGLD as still open and the stop-loss for DGLD would have to be moved lower. On the other hand, if gold moves to a stop-loss level but DGLD doesn’t, then we will view both positions (in gold and DGLD) as closed. In other words, since it’s not possible to be 100% certain that each related instrument moves to a given level when the underlying instrument does, we can’t provide levels that would be binding. The levels that we do provide are our best estimate of the levels that will correspond to the levels in the underlying assets, but it will be the underlying assets that one will need to focus on regarding the signs pointing to closing a given position or keeping it open. We might adjust the levels in the “additional instruments” without adjusting the levels in the “main instruments”, which will simply mean that we have improved our estimation of these levels, not that we changed our outlook on the markets. We are already working on a tool that would update these levels on a daily basis for the most popular ETFs, ETNs and individual mining stocks.
Our preferred ways to invest in and to trade gold along with the reasoning can be found in the how to buy gold section. Additionally, our preferred ETFs and ETNs can be found in our Gold & Silver ETF Ranking.
As always, we'll keep you - our subscribers - updated should our views on the market change. We will continue to send out Gold & Silver Trading Alerts on each trading day and we will send additional Alerts whenever appropriate.
The trading position presented above is the netted version of positions based on subjective signals (opinion) from your Editor, and the Tools and Indicators.
As a reminder, Gold & Silver Trading Alerts are posted before or on each trading day (we usually post them before the opening bell, but we don't promise doing that each day). If there's anything urgent, we will send you an additional small alert before posting the main one.
=====
Latest Free Trading Alerts:
Stock Trading Alert: Stocks Remain Close To Record Highs - Top Or Just Pause Before Another Leg Up?
S&P 500 index extended its short-term fluctuations on Friday. Will it break above its last week's new all-time high? Or is this some topping pattern before downward reversal?
=====
Hand-picked precious-metals-related links:
Fed comments push gold lower but what does the future hold for bullion?
Gold hits one-week low on U.S. rate hike prospects
=====
In other news:
Tensions mount between Russia and Ukraine following ‘terror incident’
Was Rio China's worst-ever Olympics?
=====
Thank you.
Sincerely,
Przemyslaw Radomski, CFA
Founder, Editor-in-chief, Gold & Silver Fund Manager
Gold & Silver Trading Alerts
Forex Trading Alerts
Oil Investment Updates
Oil Trading Alerts

