

Briefly: In our opinion speculative short positions (full) in gold, silver and mining stocks are currently justified from the risk/reward point of view.
Last week mining stocks and silver plunged, but moved back up before the week was over and this seems to have been the key development that we saw – but it wasn’t. Given the closing prices, we can see even more important developments that no precious metals investor should miss. Let’s take a look (charts courtesy of http://stockcharts.com).
Like in the previous few alerts, we’ll start with the USD Index.
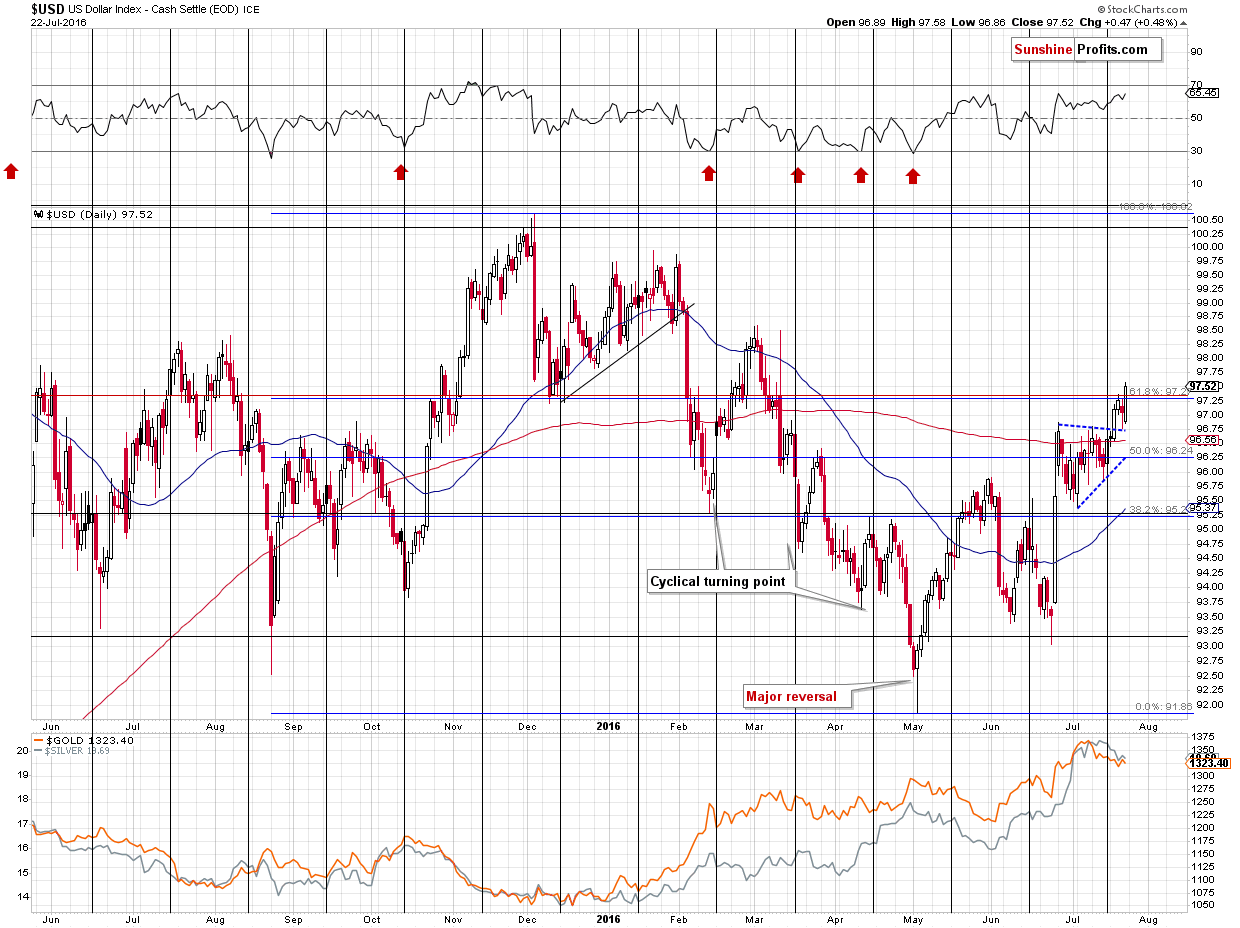
Having confirmed the breakout above the triangle pattern, the USD Index rallied, as we expected. It even broke below another very important resistance – the 61.8% Fibonacci retracement level. The Fibonacci retracement levels are particularly important in the currency markets and 61.8% is one of the classic levels, which makes it so important. The breakout has not been confirmed so far – only 1 daily close above it, so the implications are not very bullish yet. Besides, in the case of the Euro Index (the EUR/USD currency pair is the biggest component of the USD Index) we have only seen a move to the analogous retracement, but no breakout below it.
What does the above change from the long-term point of view?
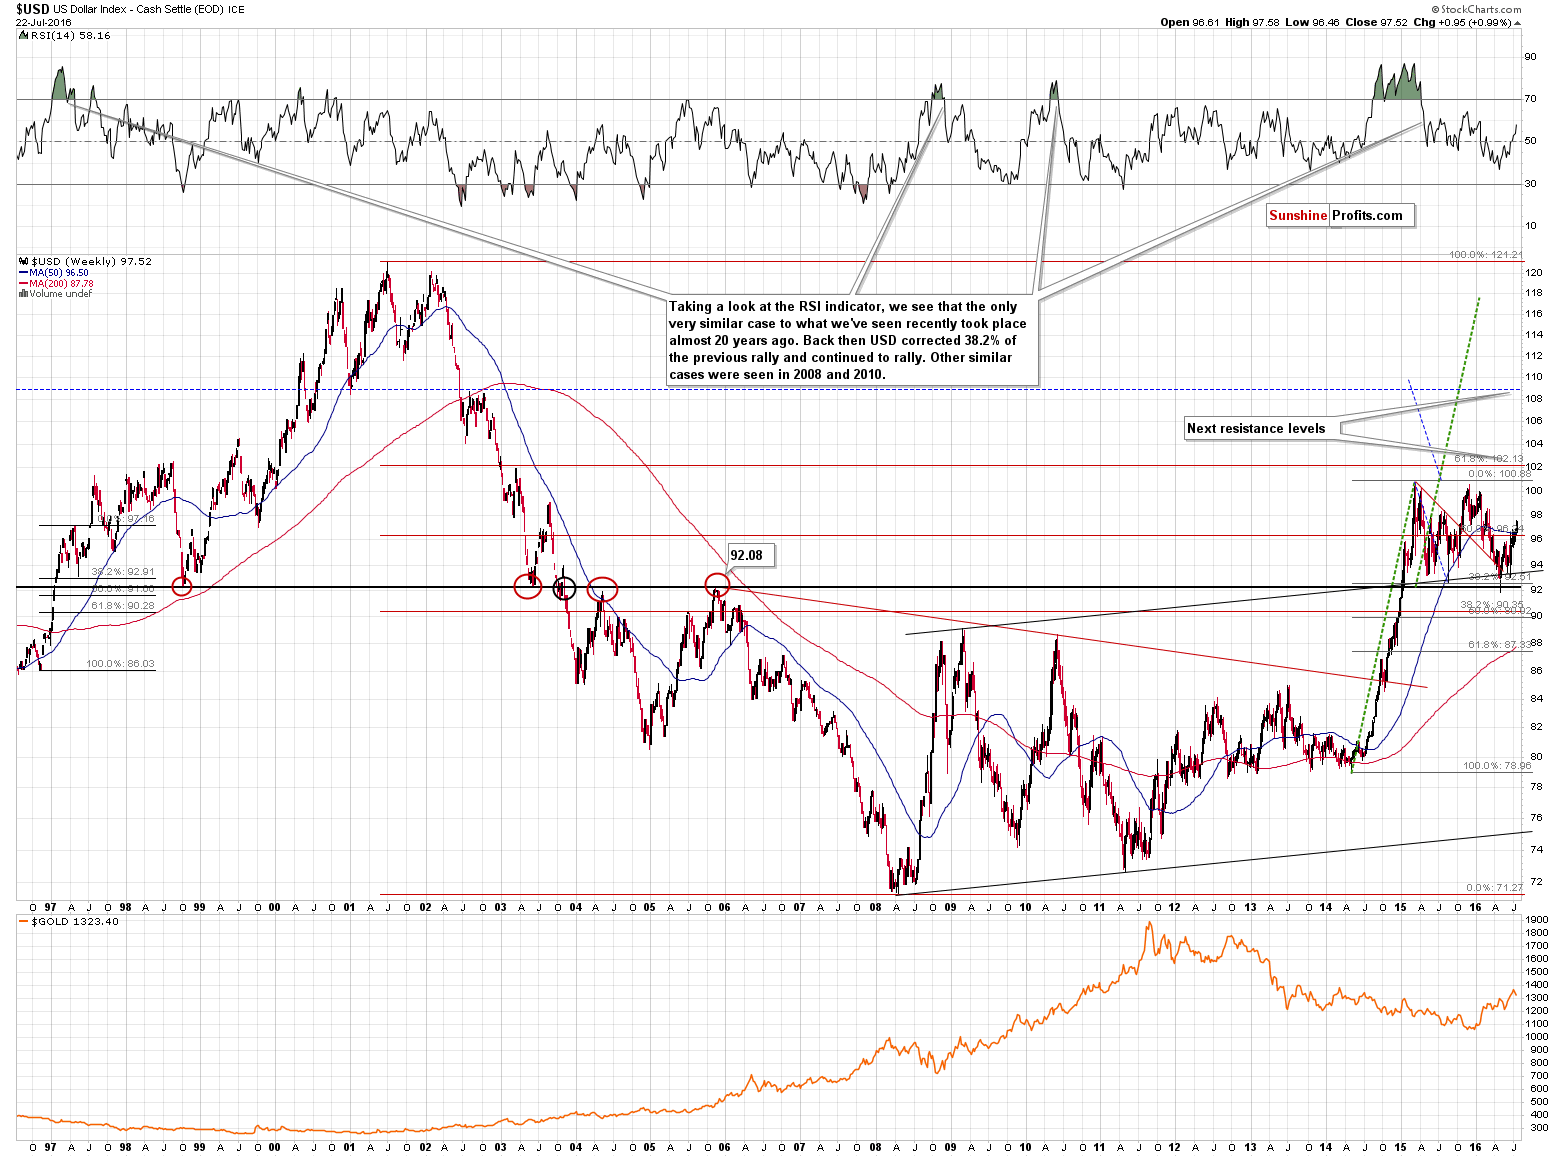
Nothing. The USD Index appears to be ending its consolidation that started in early 2015 and the long-term target levels are much higher than the current value of the index (about 110 and 118). The implications for the precious metals remain bearish in the medium term, but are only a bit bearish in the very short term (for the next few days).
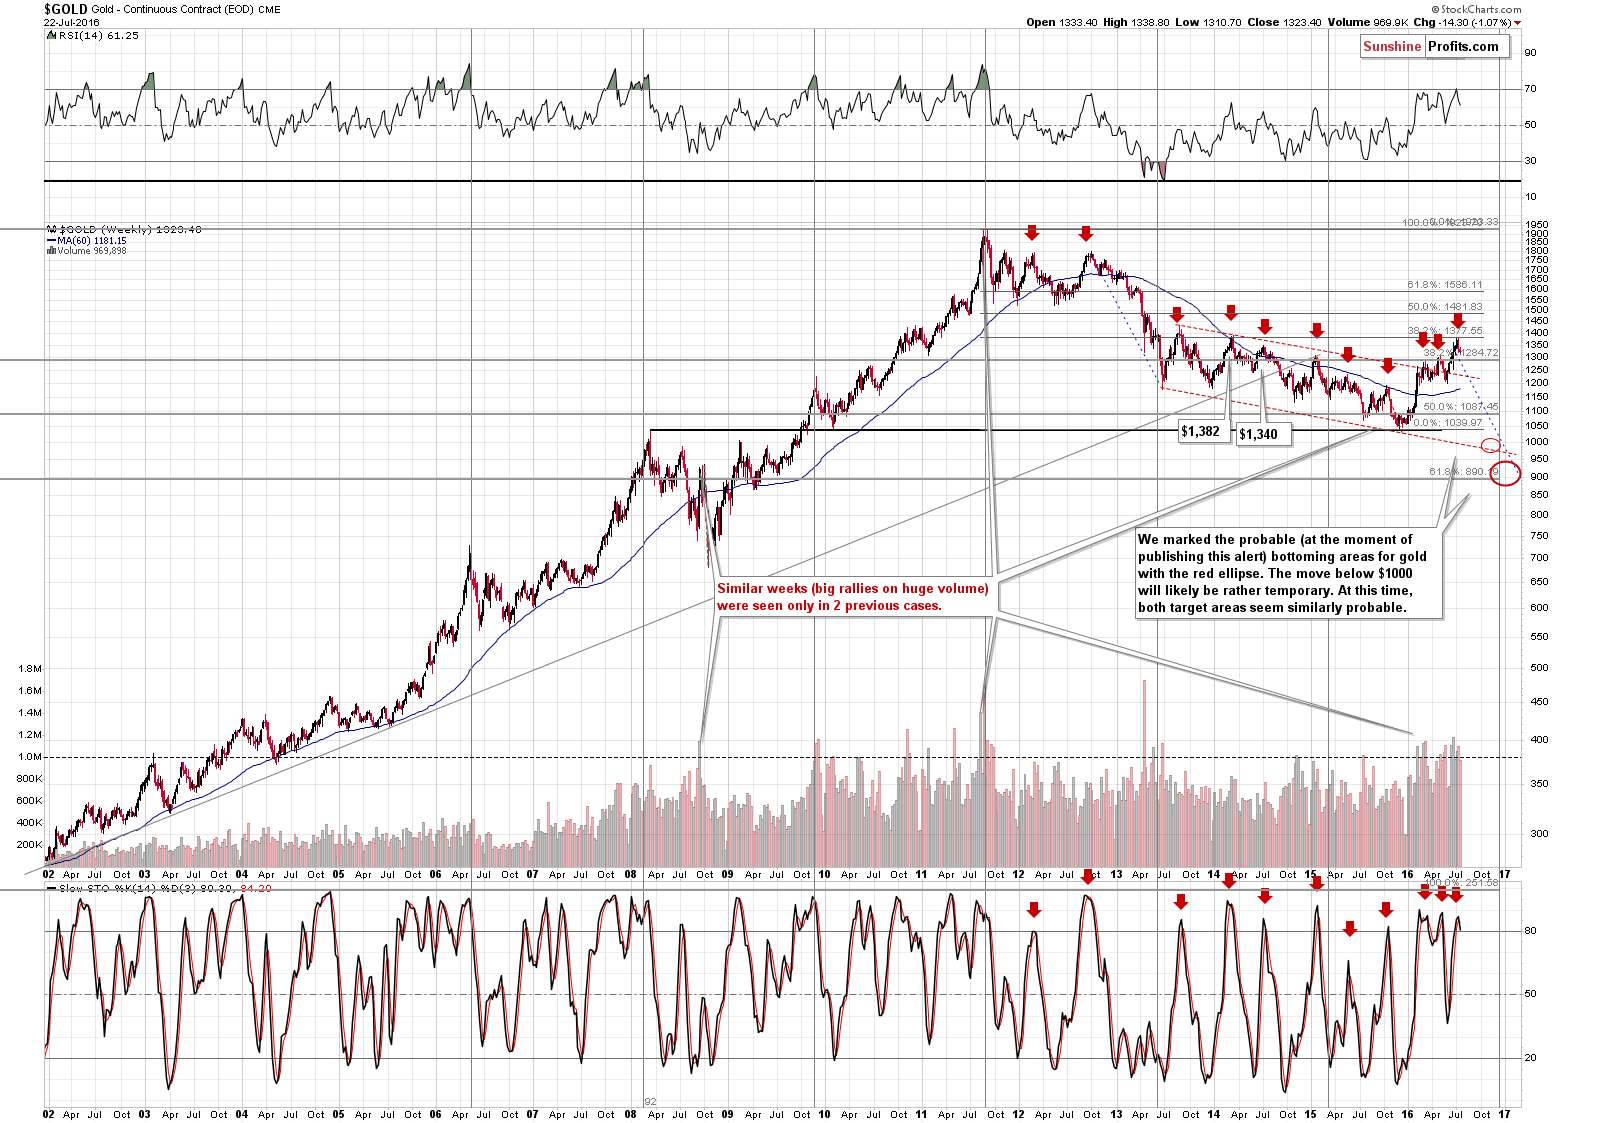
Gold’s long-term chart features a very important signal (one of the signals that we mentioned in the opening paragraph of the alert) – the weekly version of the Stochastic indicator just flashed a sell signal. In most cases, very big declines followed (and in most of the remaining cases, smaller declines followed anyway), so the implications are very bearish for the following weeks.
Moreover, please note that gold is back below both 2014 highs.
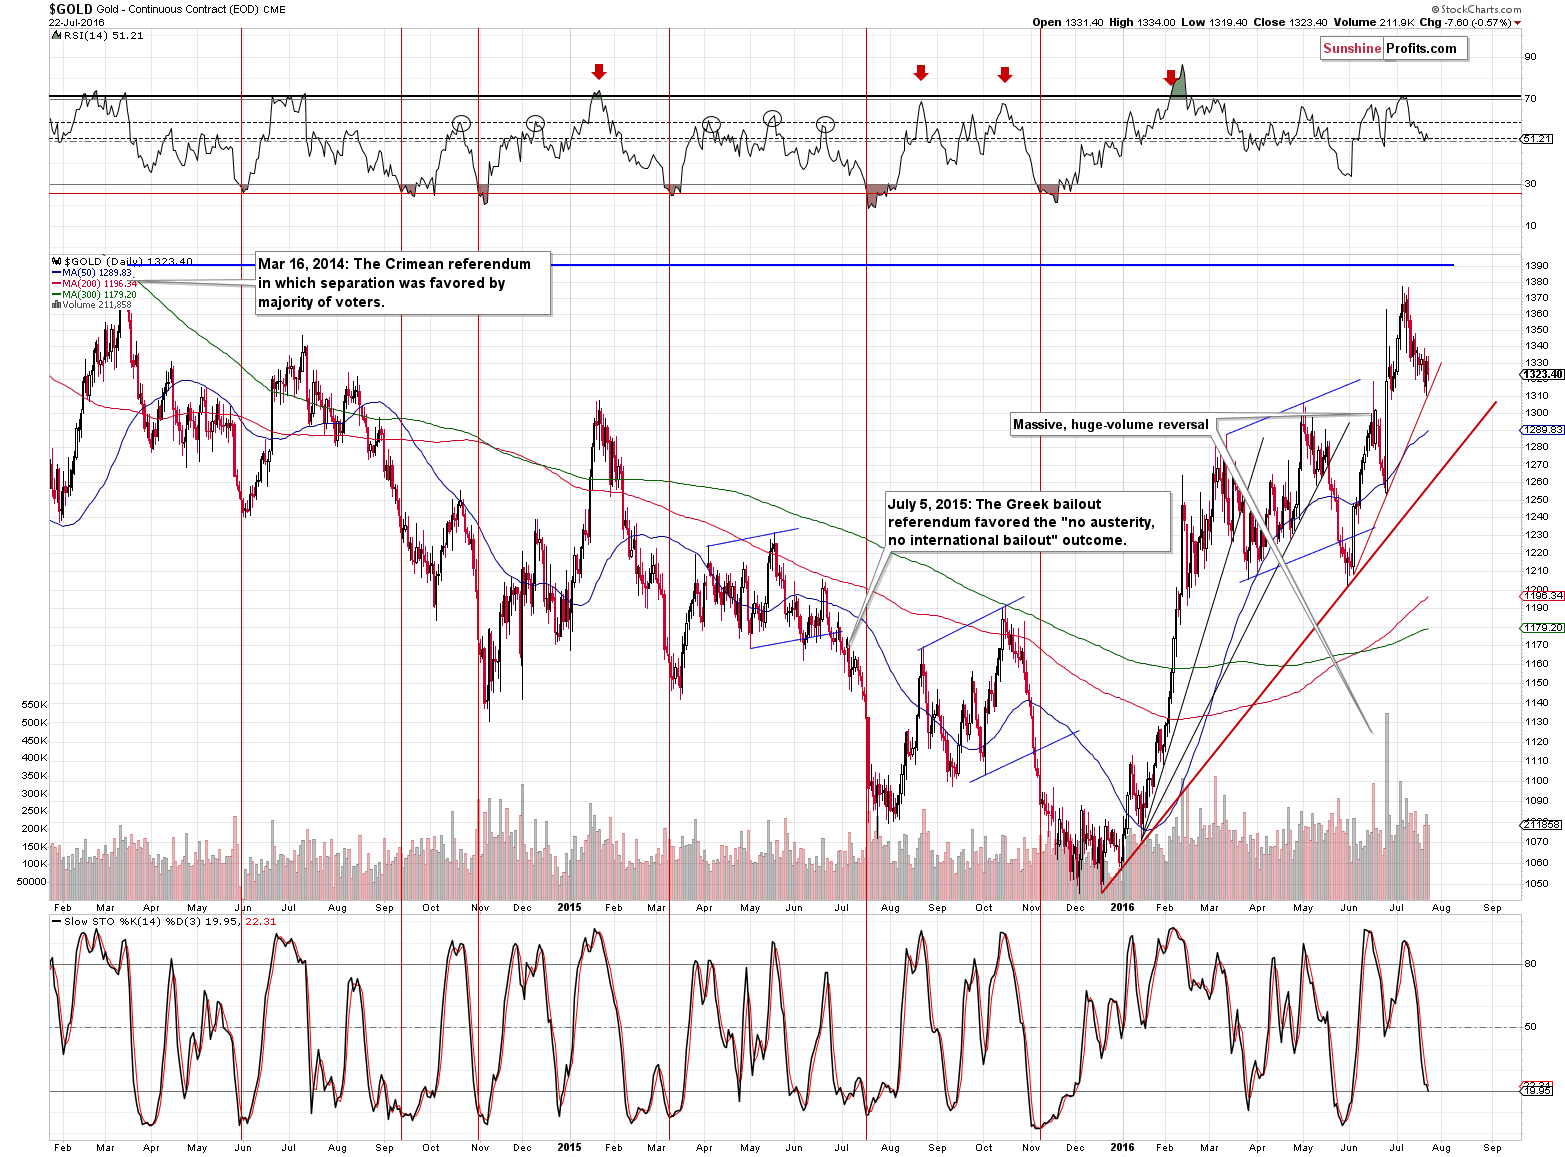
From the short-term point of view, we see that gold paused after moving to the rising support line. It seems that traders are waiting for more profound moves in the USD Index or a confirmation of the breakout above the 61.8% Fibonacci retracement level.
The volume that we saw on Friday when gold declined was not as big as the one accompanying Thursday’s upswing, but the difference was not significant and we view this bullish signal as something much less important than the sell signal from the weekly Stochastic indicator. Consequently, it seems that the outlook for gold deteriorated after all.
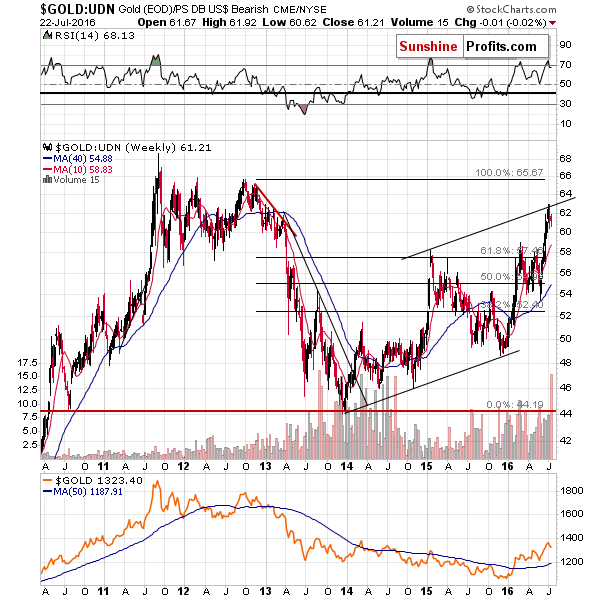
As far as the gold to UDN ratio is concerned (gold seen from the non-USD perspective), the reading in volume (the ratio of volumes) is very significant. We saw a similar development about a year ago and 2 years ago – both cases were followed by declines.
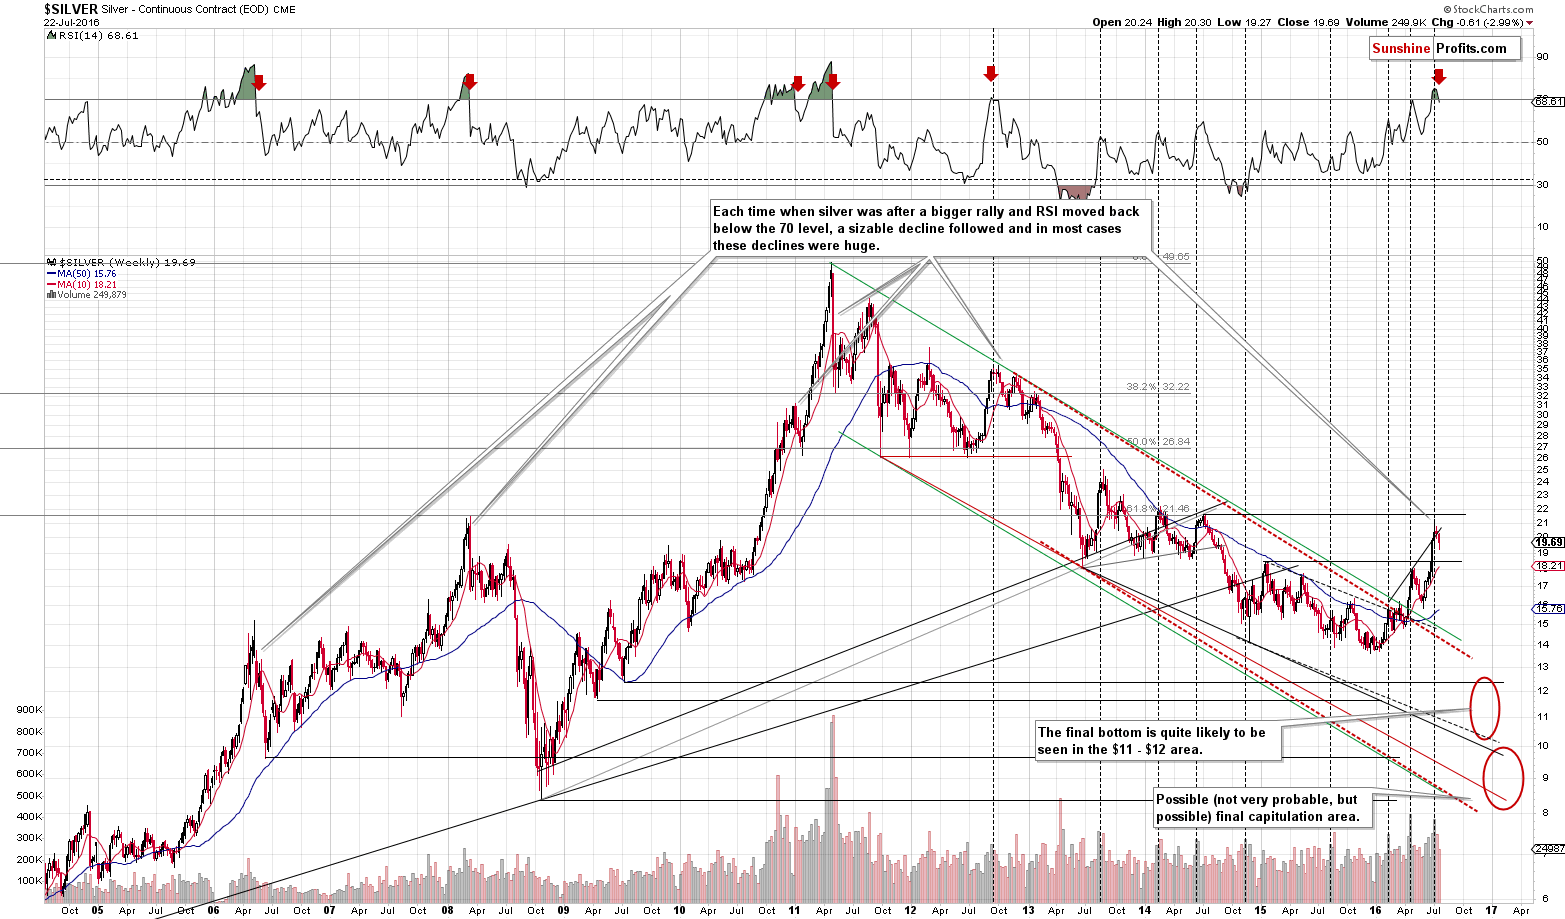
Moving on to silver, we see that it declined over 50 cents last week and that the small breakout above the rising resistance line was invalidated. The implications are bearish, but the most bearish ones come from the RSI indicator that moved lower and closed the week below the 70 level. The move is visible and the last time we saw something like that, silver dropped over $15 in the following months.
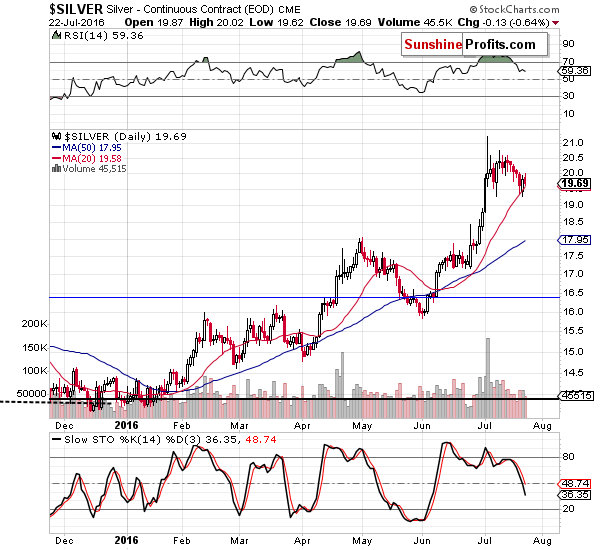
As far as the short-term picture is concerned, our previous comments remain up-to-date:
As far as silver is concerned, the white metal also moved lower on higher volume, but the more important volume reading was seen at the beginning of the month, when silver soared on an intra-day basis, only to slide later on. Then silver had an additional short-term run-up and it’s now declining, moving to its 20-day moving average. The situation is very similar to what happened in late April and in the first half of May. Back then silver also had a huge-volume reversal, followed by a short-term run-up and subsequent decline. What can we infer from this similarity? That silver could spend a few days moving close to the 20-day moving average, just like it did in mid-May. The decline is likely to continue either after such a small consolidation or right away.
(…) Back in May, after several days of back and forth trading, silver’s decline continued. This outcome remains likely also in light of yesterday’s move higher.
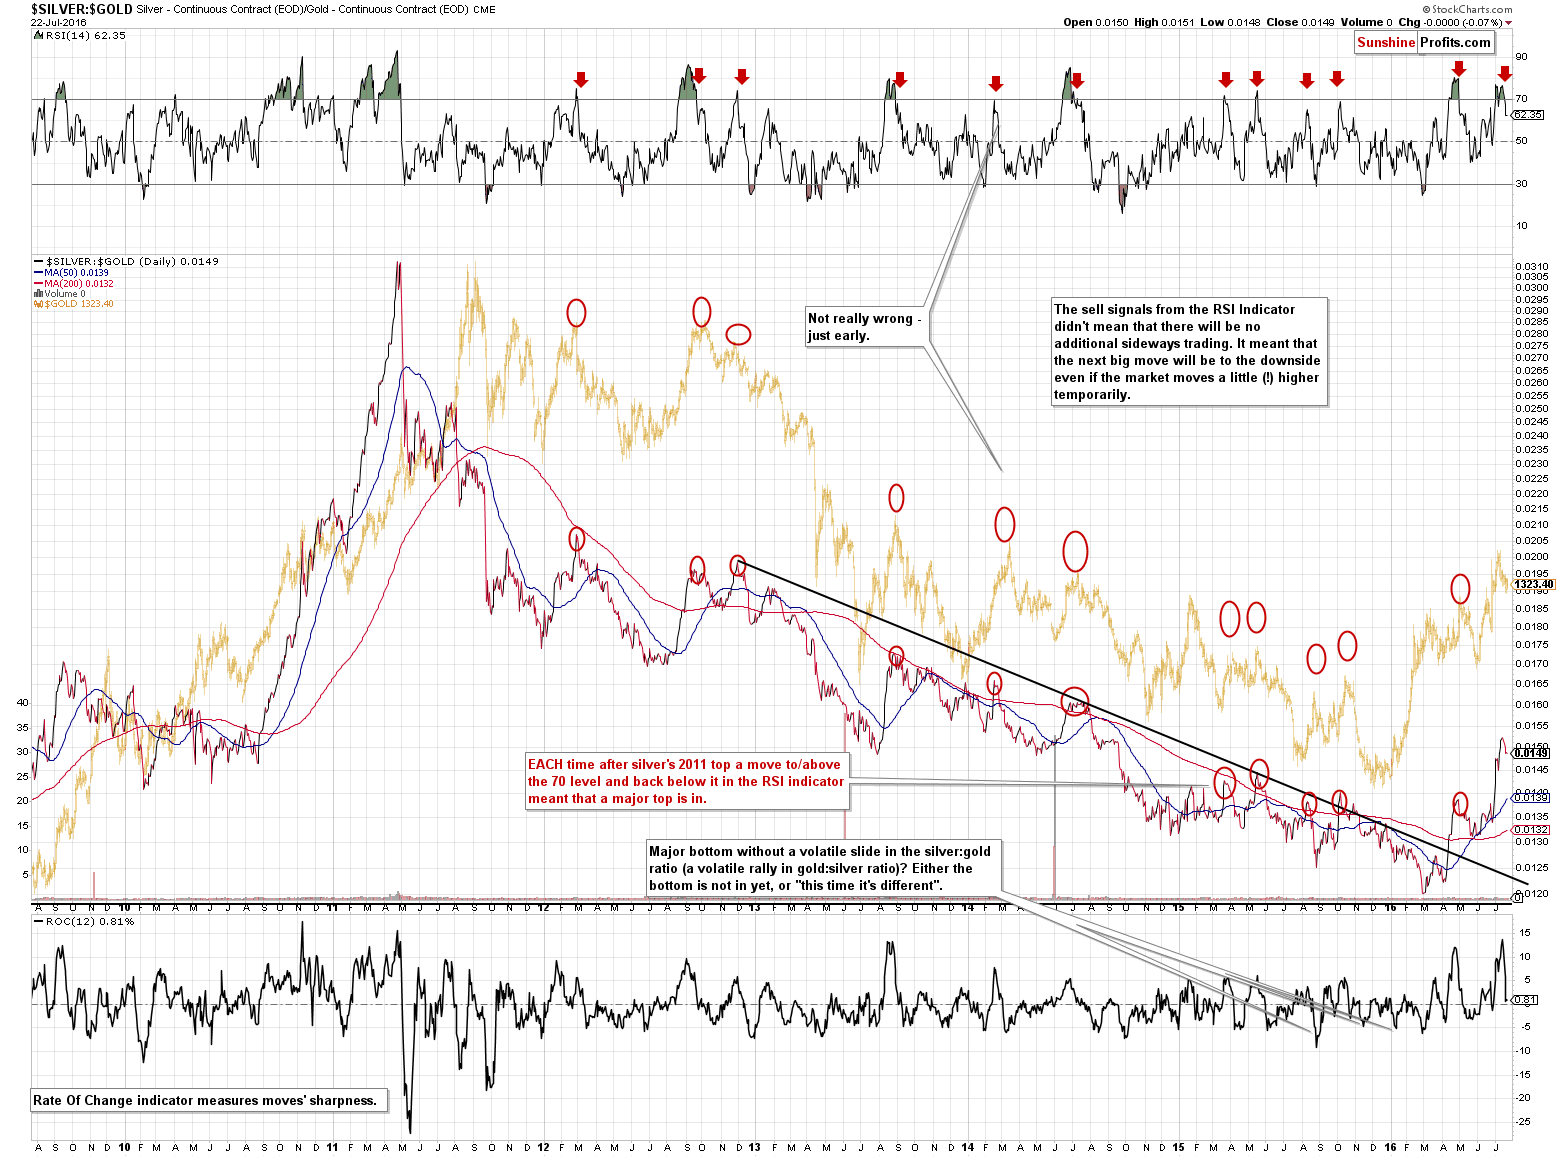
The silver to gold ratio has bearish implications as well. The key thing is – just like it is the case with silver – that the RSI indicator moved back below the 70 level, which confirmed important tops multiple times in the past. Unlike in the case of silver’s RSI (featured previously) alone which is based on weekly closing prices, the above chart is based on daily prices, so both signals confirm each other – it’s not just the same signal viewed from different perspectives.
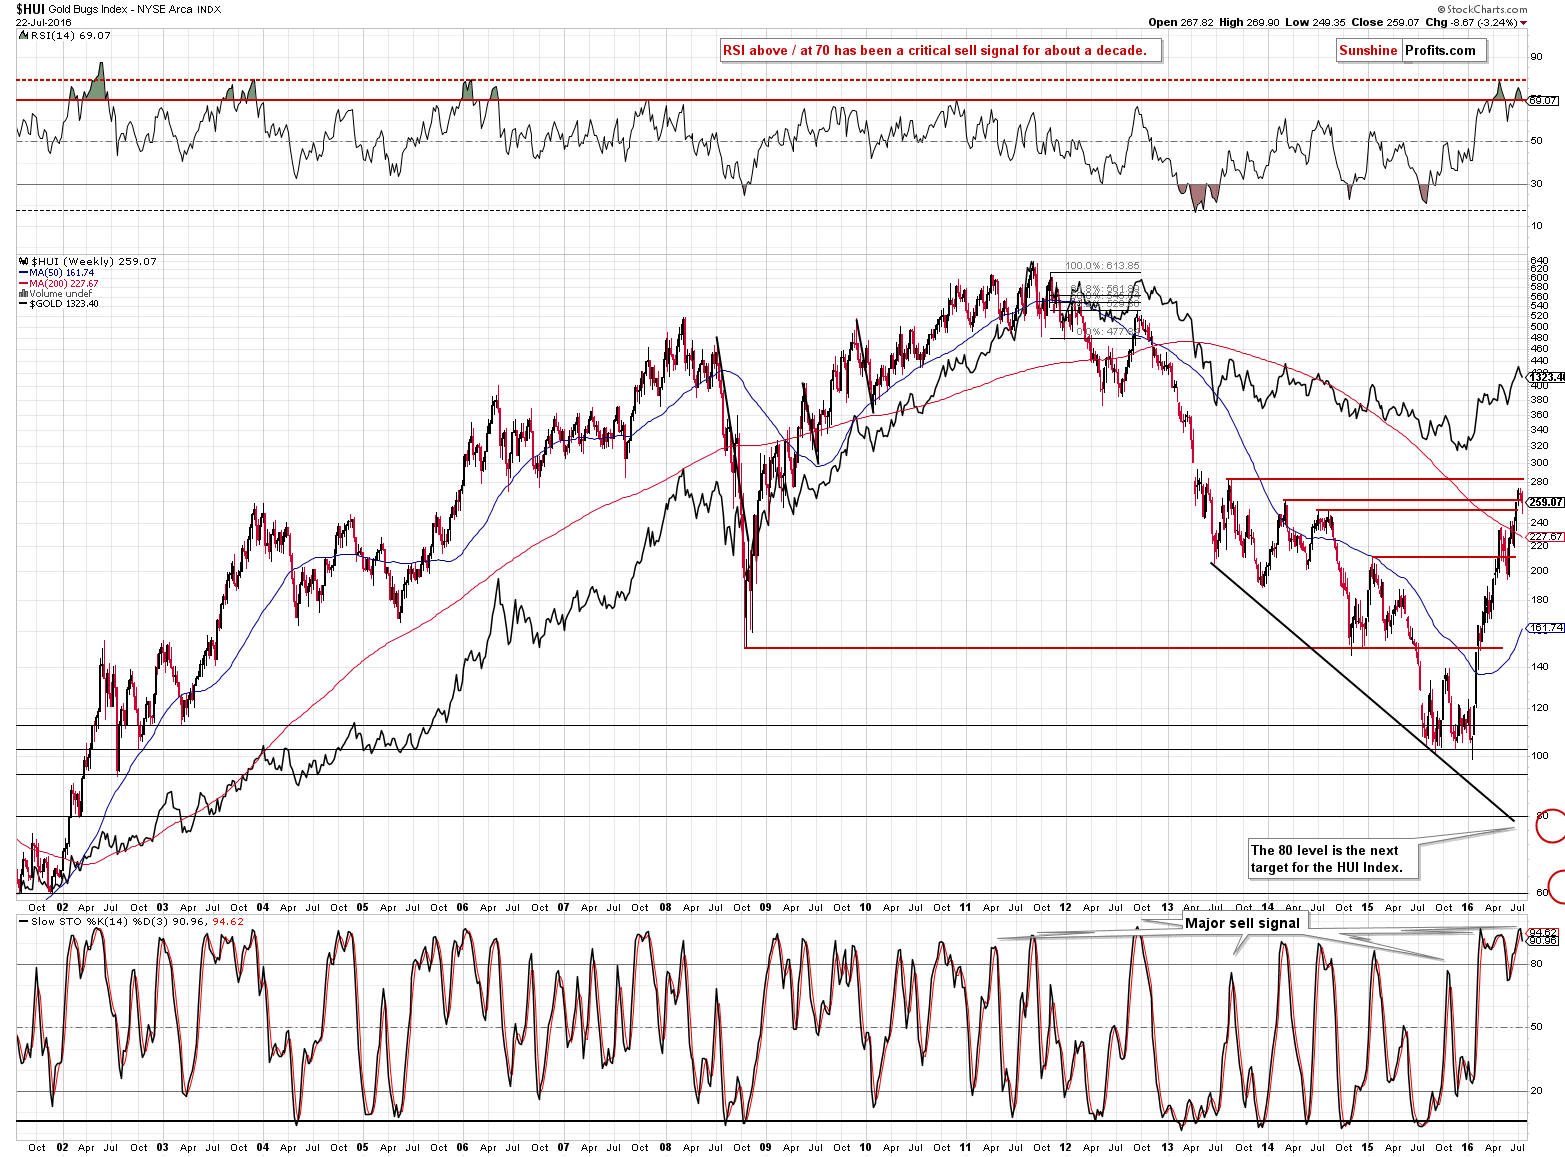
Moving on to gold stocks, we see that - unlike gold - they didn’t invalidate the breakout below the 2014 lows – at least in terms of the weekly closing prices. However, we saw 2 different bearish signals. The first one comes from the RSI indicator as it moved below the 70 level, and the second one comes from the weekly Stochastic indicator which just moved below its signal line, while being extremely overbought. The implications are bearish.
From the short-term point of view, we can say that our previous comments remain up-to-date:
(…) What’s also bearish is the fact that miners moved decisively below the most recent trading range – in the case of the previous huge-volume declines that we saw earlier this year miners remained within the trading range after the huge-volume slide (for instance in late March and in mid-May). Consequently, we can speak of a specific breakdown that has already happened.
(…) Miners moved higher yesterday, but the move was not accompanied by relatively high volume (lower than what we saw on Wednesday) and the move took miners only to the previously broken red line – not back above it. Consequently, the breakdown was not invalidated and the implications remain bearish.
Based on the Friday’s almost non-existent price movement, the breakdown was not invalidated, so the implications remain bearish as well.
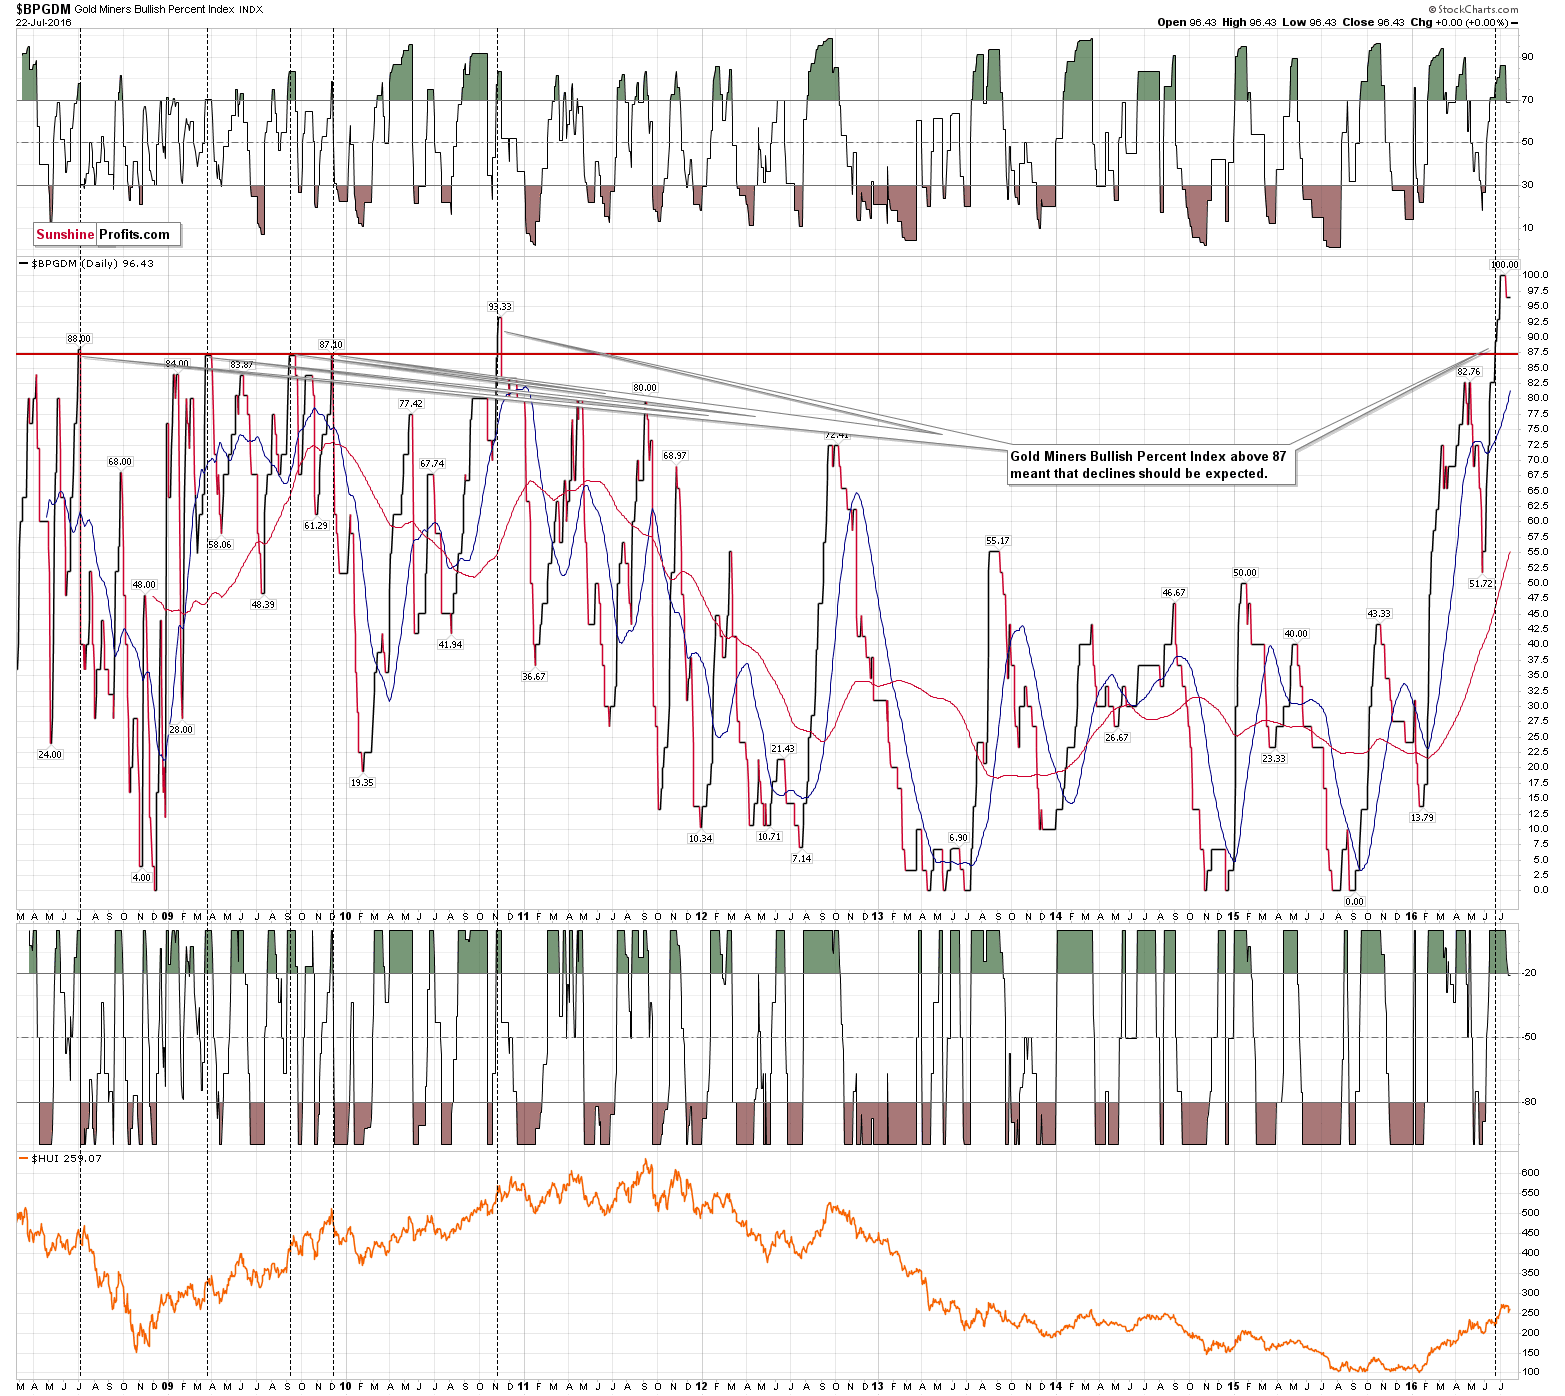
Let’s not forget that mining stocks are still extremely overbought as measured by the Gold Miners Bullish Percent Index. What we wrote about the latter last week, remains up-to-date:
The index finally moved below the extreme 100 reading, but the sell signal that this level indicated by itself (and what the RSI and Williams %R indicators confirmed) remains in place. Similar situations in the past were followed by substantial declines – for instance in 2008 the HUI Index declined by about 300 points in the following months.
Summing up, last week we saw additional bearish signals of medium-term significance, but as far as the short-term is concerned, we could still see a few days of sideways movement based on the moving average in silver, support lines in gold and mining stocks.
As always, we will keep you – our subscribers – updated.
To summarize:
Trading capital (supplementary part of the portfolio; our opinion): Short positions (full position) in gold, silver and mining stocks are justified from the risk/reward perspective with the following entry prices, stop-loss orders and initial target price levels:
- Gold: initial target price: $1,006; stop-loss: $1,423, initial target price for the DGLD ETN: $86.30; stop-loss for the DGLD ETN $34.86
- Silver: initial target price: $12.13; stop-loss: $20.83, initial target price for the DSLV ETN: $65.88; stop-loss for the DSLV ETN $16.76
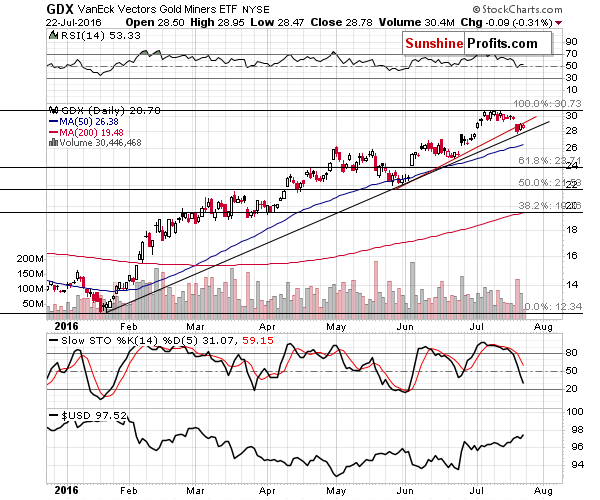
- Mining stocks (price levels for the GDX ETF): initial target price: $9.34; stop-loss: $32.27, initial target price for the DUST ETF: $47.90; stop-loss for the DUST ETF $4.67
In case one wants to bet on junior mining stocks' prices (we do not suggest doing so – we think senior mining stocks are more predictable in the case of short-term trades – if one wants to do it anyway, we provide the details), here are the stop-loss details and initial target prices:
- GDXJ ETF: initial target price: $14.13; stop-loss: $54.43
- JDST ETF: initial target price: $61.74; stop-loss: $3.73
Long-term capital (core part of the portfolio; our opinion): No positions
Insurance capital (core part of the portfolio; our opinion): Full position
Plus, you might want to read why our stop-loss orders are usually relatively far from the current price.
Please note that a full position doesn’t mean using all of the capital for a given trade. You will find details on our thoughts on gold portfolio structuring in the Key Insights section on our website.
As a reminder – “initial target price” means exactly that – an “initial” one, it’s not a price level at which we suggest closing positions. If this becomes the case (like it did in the previous trade) we will refer to these levels as levels of exit orders (exactly as we’ve done previously). Stop-loss levels, however, are naturally not “initial”, but something that, in our opinion, might be entered as an order.
Since it is impossible to synchronize target prices and stop-loss levels for all the ETFs and ETNs with the main markets that we provide these levels for (gold, silver and mining stocks – the GDX ETF), the stop-loss levels and target prices for other ETNs and ETF (among other: UGLD, DGLD, USLV, DSLV, NUGT, DUST, JNUG, JDST) are provided as supplementary, and not as “final”. This means that if a stop-loss or a target level is reached for any of the “additional instruments” (DGLD for instance), but not for the “main instrument” (gold in this case), we will view positions in both gold and DGLD as still open and the stop-loss for DGLD would have to be moved lower. On the other hand, if gold moves to a stop-loss level but DGLD doesn’t, then we will view both positions (in gold and DGLD) as closed. In other words, since it’s not possible to be 100% certain that each related instrument moves to a given level when the underlying instrument does, we can’t provide levels that would be binding. The levels that we do provide are our best estimate of the levels that will correspond to the levels in the underlying assets, but it will be the underlying assets that one will need to focus on regarding the signs pointing to closing a given position or keeping it open. We might adjust the levels in the “additional instruments” without adjusting the levels in the “main instruments”, which will simply mean that we have improved our estimation of these levels, not that we changed our outlook on the markets. We are already working on a tool that would update these levels on a daily basis for the most popular ETFs, ETNs and individual mining stocks.
Our preferred ways to invest in and to trade gold along with the reasoning can be found in the how to buy gold section. Additionally, our preferred ETFs and ETNs can be found in our Gold & Silver ETF Ranking.
As always, we'll keep you - our subscribers - updated should our views on the market change. We will continue to send out Gold & Silver Trading Alerts on each trading day and we will send additional Alerts whenever appropriate.
The trading position presented above is the netted version of positions based on subjective signals (opinion) from your Editor, and the Tools and Indicators.
As a reminder, Gold & Silver Trading Alerts are posted before or on each trading day (we usually post them before the opening bell, but we don't promise doing that each day). If there's anything urgent, we will send you an additional small alert before posting the main one.
=====
Latest Free Trading Alerts:
Gold prices fell the day after the terrorist attack in Nice, but rose initially on Turkey’s coup. Why does gold react differently to distinct geopolitical events?
S&P 500 index continues to trade close to its new all-time high. Will the uptrend continue? Is holding short position justified?
Stock Trading Alert: More Short-Term Uncertainty As Investors React To Earnings Releases
=====
Hand-picked precious-metals-related links:
Gold slips on firmer equities; central banks in focus
European Stocks Climb on German Confidence as Gold, Bonds Fall
Price not the main factor for India's physical gold market standstill: sources
These safe havens are becoming danger zones: JPM
Amplats sees limited platinum-supply growth as profit drops 58%
=====
In other news:
No Brexit talks for several months, EU's Juncker concedes
Emerging Currencies Weaken Before Fed, BOJ Meetings This Week
Pound Outlook Darkens as First Signs of Brexit Fallout Emerge
'Insane amount of catalysts' on investors' radar in the week ahead
=====
Thank you.
Sincerely,
Przemyslaw Radomski, CFA
Founder, Editor-in-chief, Gold & Silver Fund Manager
Gold & Silver Trading Alerts
Forex Trading Alerts
Oil Investment Updates
Oil Trading Alerts

